| Param | Original file | Final file |
|---|---|---|
| Filename | modeM0/AS1T04_090T01_9000004840_33892cztM0_level2.evt | modeM0/AS1T04_090T01_9000004840_33892cztM0_level2_quad_clean.evt |
| Size (bytes) | 587,108,160 | 83,831,040 |
| Size | 559.9 MB | 79.9 MB |
| Events in quadrant A | 3,754,072 | 547,255 |
| Events in quadrant B | 3,247,049 | 543,082 |
| Events in quadrant C | 3,456,465 | 542,263 |
| Events in quadrant D | 6,916,442 | 486,207 |
| Mode M9 | |||
|---|---|---|---|
| Quadrant | BADHDUFLAG | Total packets | Discarded packets |
| A | 0 | 21 | 0 |
| B | 0 | 21 | 0 |
| C | 0 | 21 | 0 |
| D | 0 | 22 | 0 |
| Mode M0 | |||
|---|---|---|---|
| Quadrant | BADHDUFLAG | Total packets | Discarded packets |
| A | 0 | 15290 | 3 |
| B | 0 | 13548 | 2 |
| C | 0 | 13858 | 2 |
| D | 0 | 24701 | 2 |
| Mode SS | |||
|---|---|---|---|
| Quadrant | BADHDUFLAG | Total packets | Discarded packets |
| A | 0 | 122 | 0 |
| B | 0 | 122 | 0 |
| C | 0 | 122 | 0 |
| D | 0 | 122 | 0 |
| Quadrant | Total seconds | Saturated seconds | Saturation percentage |
|---|---|---|---|
| A | 6009 | 390 | 6.490265% |
| B | 6009 | 88 | 1.464470% |
| C | 6009 | 106 | 1.764021% |
| D | 6009 | 875 | 14.561491% |
Noise dominated data is calculated using 1-second bins in cleaned event files. If a bin has >2000 counts, and if more than 50% of those come from <1% of pixels, then it is considered to be noise-dominated and hence unusable.
| Quadrant | # 1 sec bins | Bins with >0 counts | Bins with >2000 counts | High rate bins dominated by noise | Noise dominated (total time) | Noise dominated (detector-on time) | Marked lightcurve |
|---|---|---|---|---|---|---|---|
| A | 7292 | 6010 | 307 | 307 | 4.21% | 5.11% | 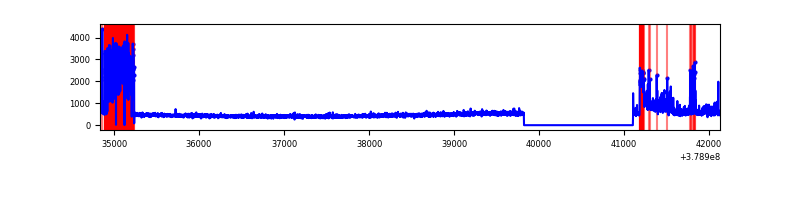 |
| B | 7292 | 6010 | 54 | 54 | 0.74% | 0.90% | 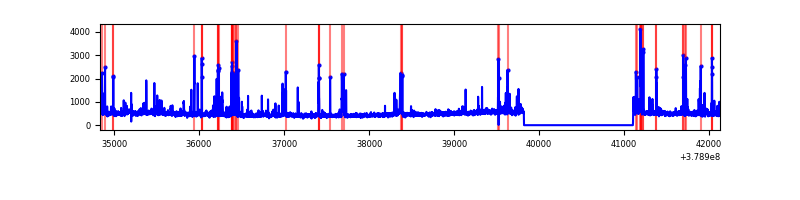 |
| C | 7292 | 6010 | 69 | 69 | 0.95% | 1.15% | 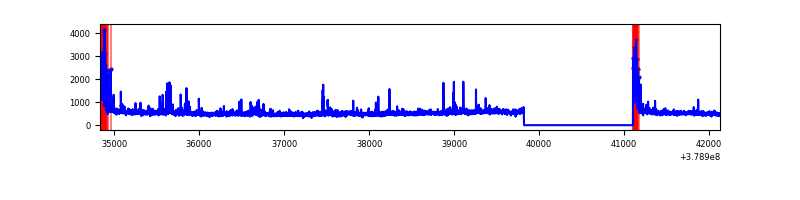 |
| D | 7292 | 6010 | 732 | 732 | 10.04% | 12.18% | 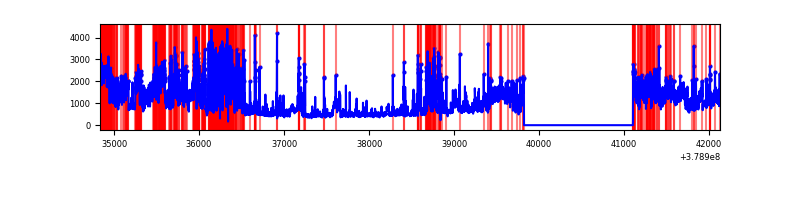 |
Top three noisy pixels from each quadrant. If the there are fewer than three noisy pixels in the level2.evt file, extra rows are filled as -1
| Pixel properties | Quadrant properties | ||||||
|---|---|---|---|---|---|---|---|
| Quadrant | DetID | PixID | Counts | Sigma | Mean | Median | Sigma |
| A | 15 | 169 | 1107830 | 8246.31 | 664 | 649 | 134.3 |
| A | 7 | 16 | 55629 | 409.49 | 664 | 649 | 134.3 |
| A | 13 | 6 | 15546 | 110.95 | 664 | 649 | 134.3 |
| B | 5 | 172 | 310454 | 2312.72 | 689 | 669 | 133.9 |
| B | 4 | 81 | 34702 | 254.08 | 689 | 669 | 133.9 |
| B | 4 | 170 | 23213 | 168.3 | 689 | 669 | 133.9 |
| C | 0 | 10 | 396469 | 2523.17 | 673 | 678 | 156.9 |
| C | 15 | 214 | 261506 | 1662.78 | 673 | 678 | 156.9 |
| C | 3 | 233 | 107630 | 681.82 | 673 | 678 | 156.9 |
| D | 1 | 52 | 1814712 | 11403.7 | 643 | 625 | 159.1 |
| D | 12 | 235 | 982881 | 6174.65 | 643 | 625 | 159.1 |
| D | 8 | 195 | 798458 | 5015.33 | 643 | 625 | 159.1 |
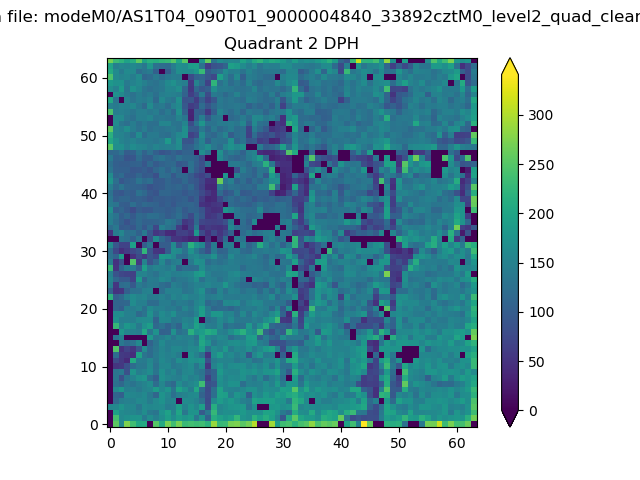
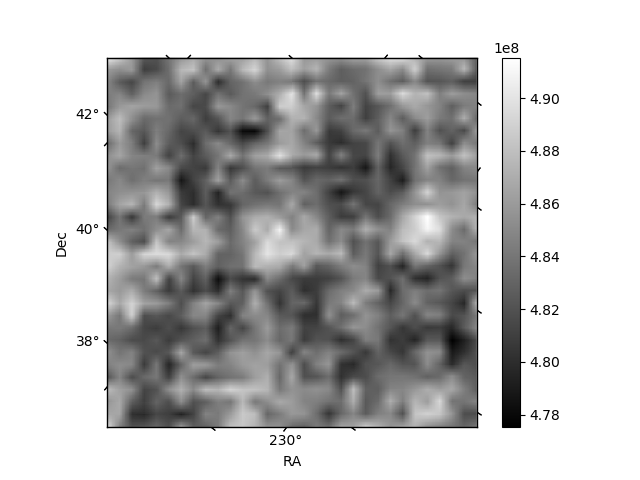
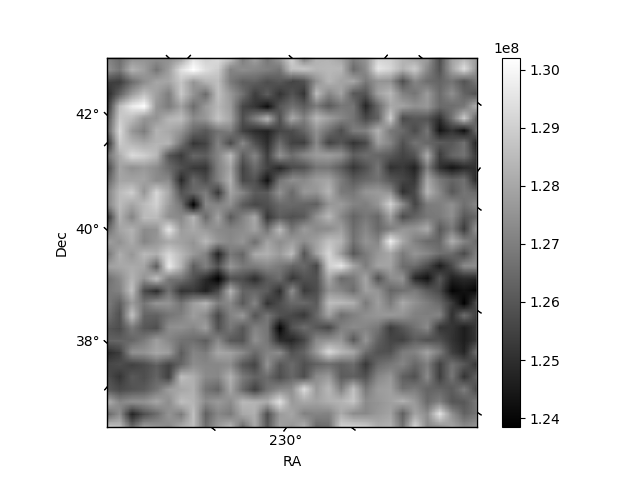
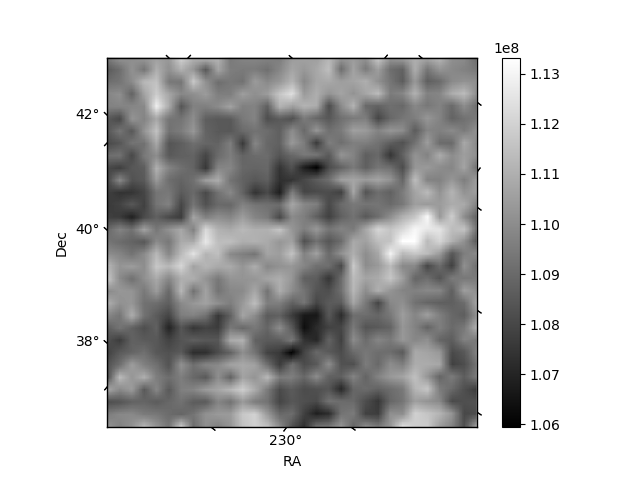
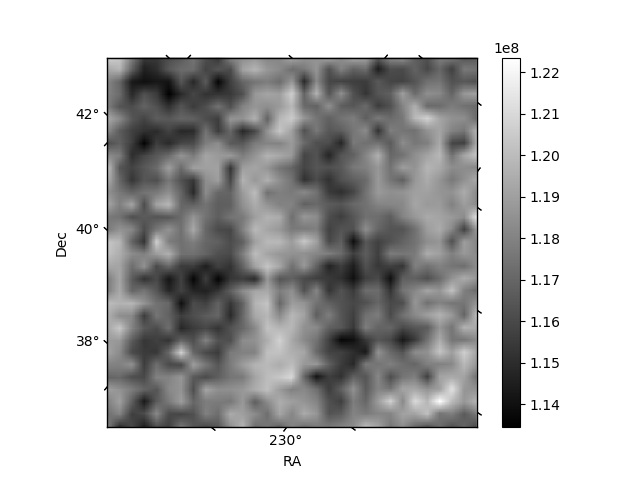
Histogram calculated using DETX and DETY for each event in the final _common_clean file
| Quadrant A | 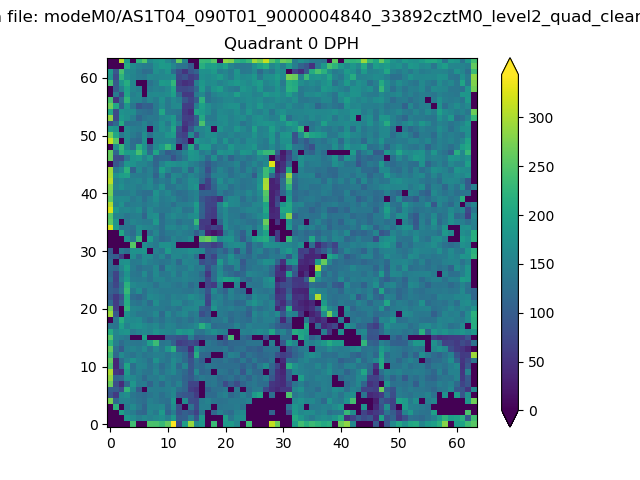 |
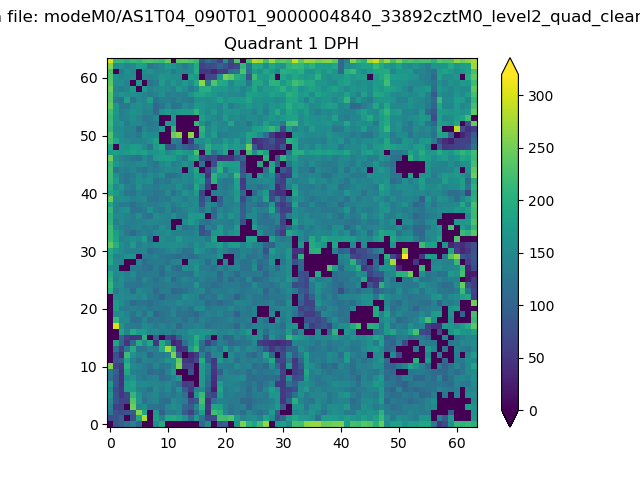 |
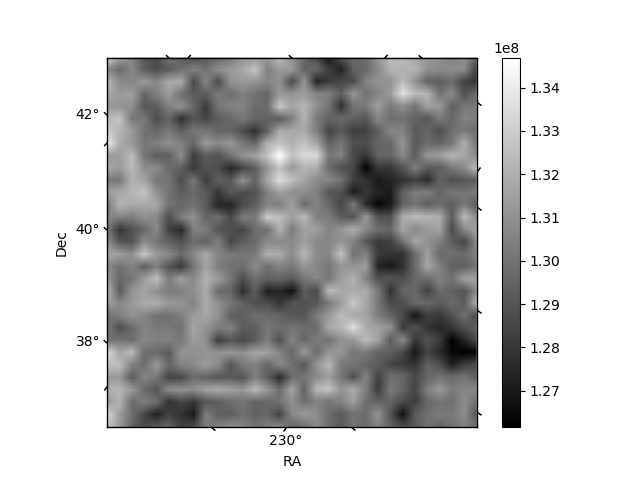
Quadrant B |
|---|---|---|---|
| Quadrant D | 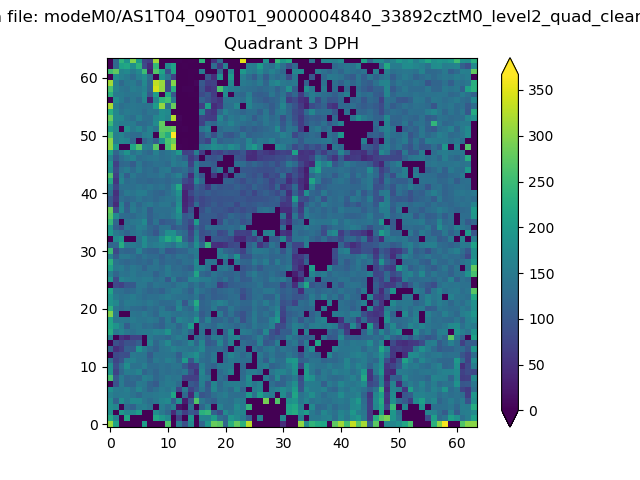 |
 |
Quadrant C |
| Plot type | Count rate plots | Images |
|---|---|---|
| Comparison with Poisson distribution Blue bars denote a histogram of data divided into 1 sec bins. Red curve is a Poisson curve with rate = median count rate of data. |
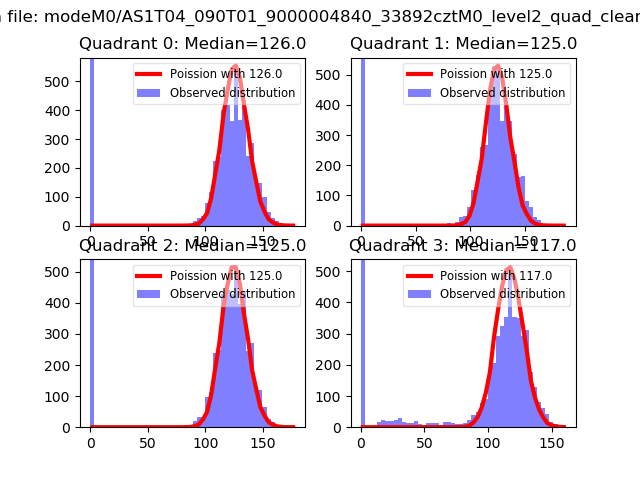 |
 |
| Quadrant-wise count rates Data is divided into 100 sec bins |
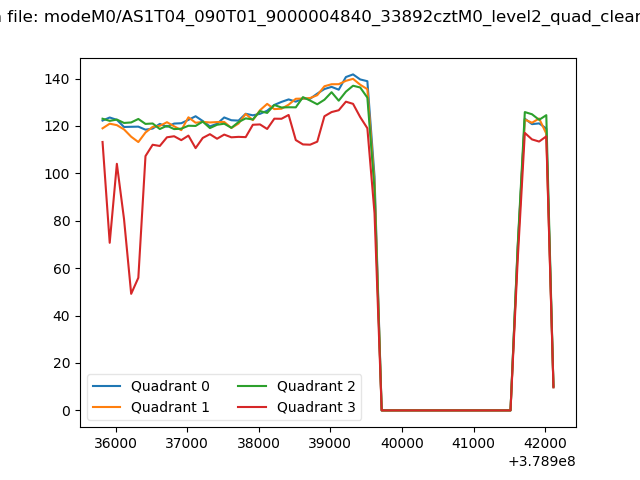 |
|
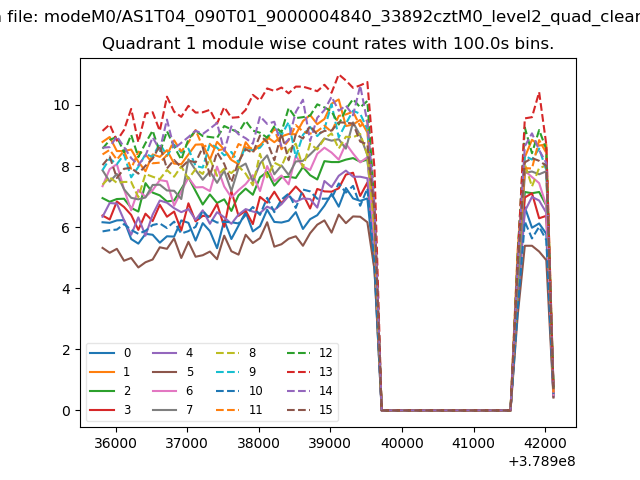
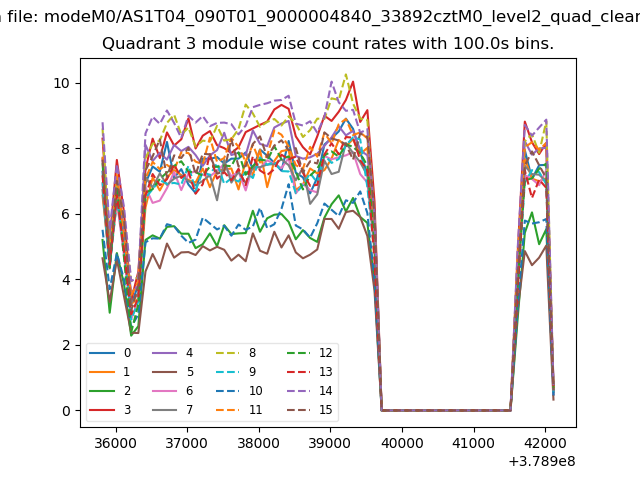
| Module-wise count rates for Quadrant A Data is divided into 100 sec bins |
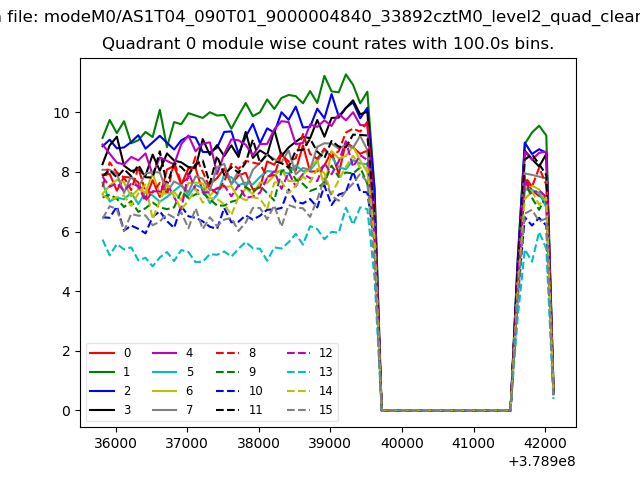 |
 |
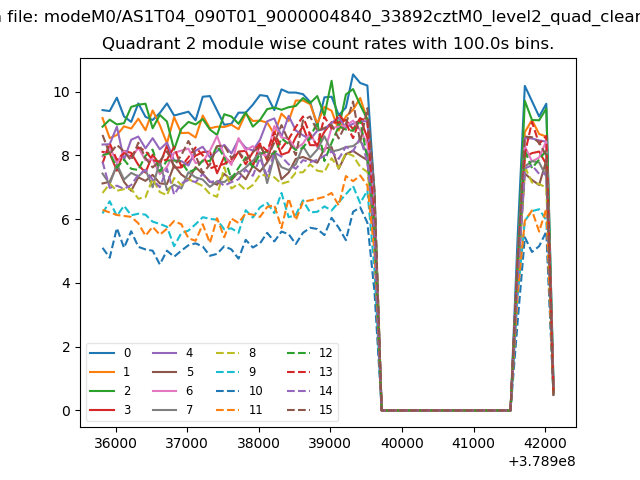
| Module-wise count rates for Quadrant B Data is divided into 100 sec bins |
 |
 |
| Module-wise count rates for Quadrant C Data is divided into 100 sec bins |
 |
 |
| Module-wise count rates for Quadrant D Data is divided into 100 sec bins |
 |
 |
| Parameter | Plot |
|---|---|
| CZT HV Monitor | 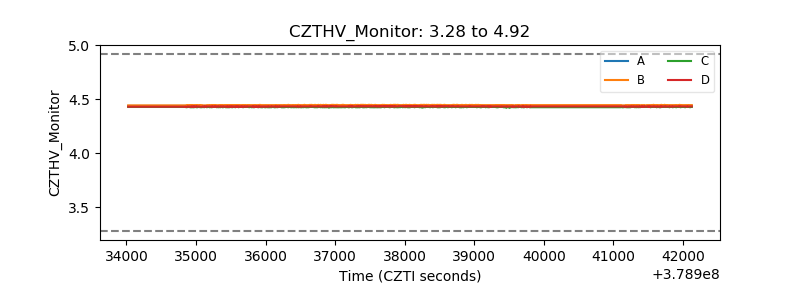 |
| D_VDD | 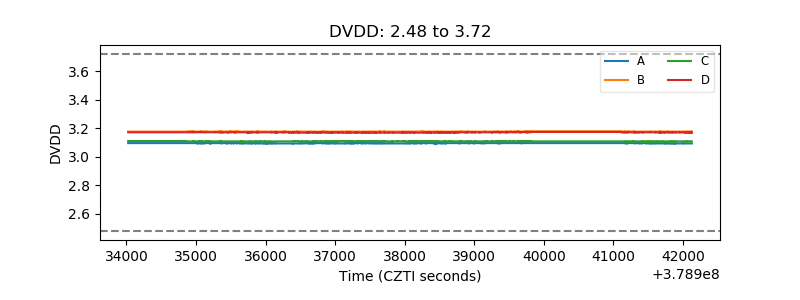 |
| Temperature 1 | 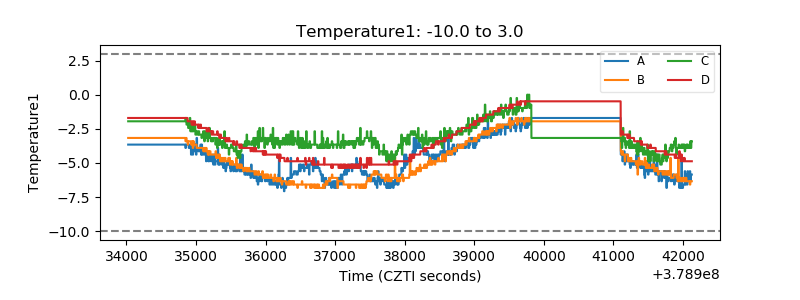 |
| Veto HV Monitor | 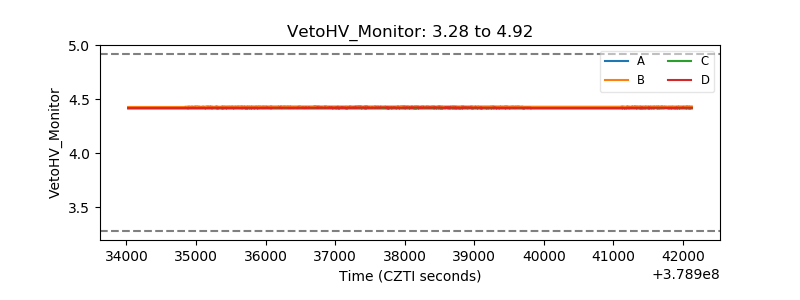 |
| Veto LLD | 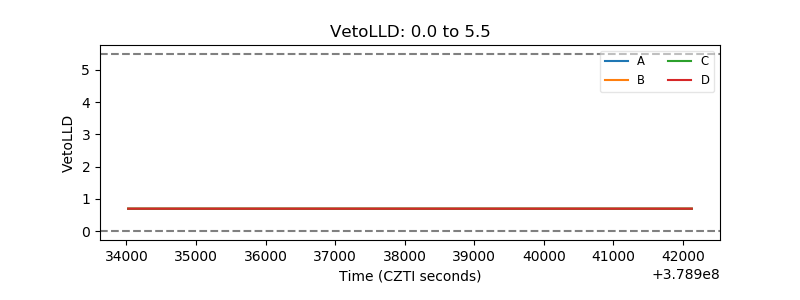 |
| Alpha Counter | 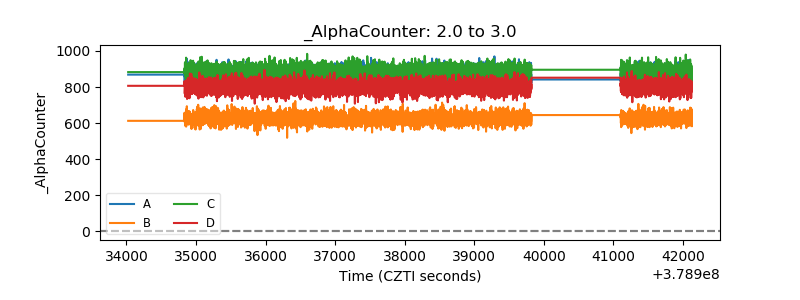 |
| _CPM_Rate | 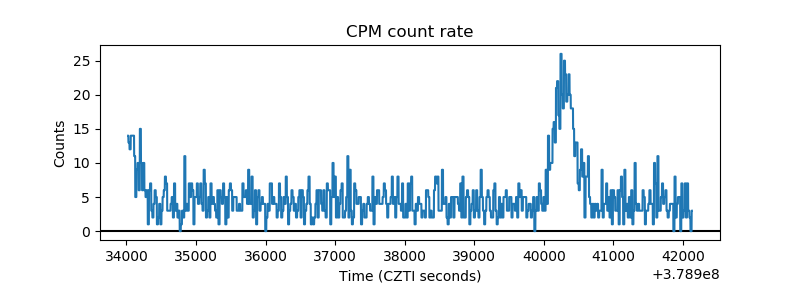 |
| CZT Counter | 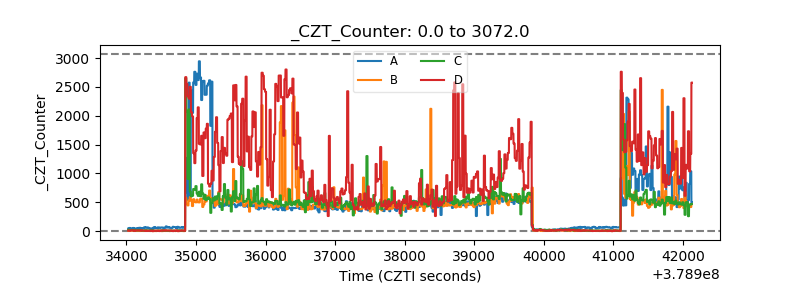 |
| +2.5 Volts monitor |  |
| +5 Volts monitor | 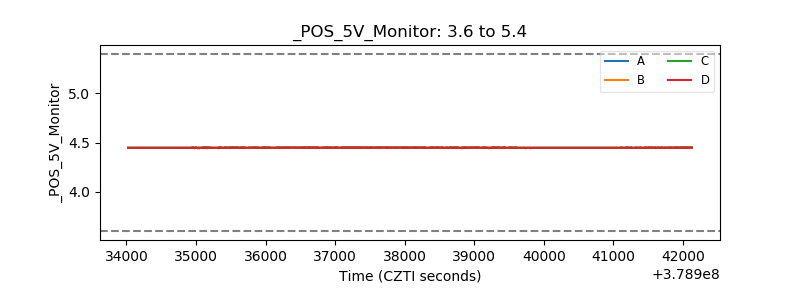 |
| _ROLL_ROT | 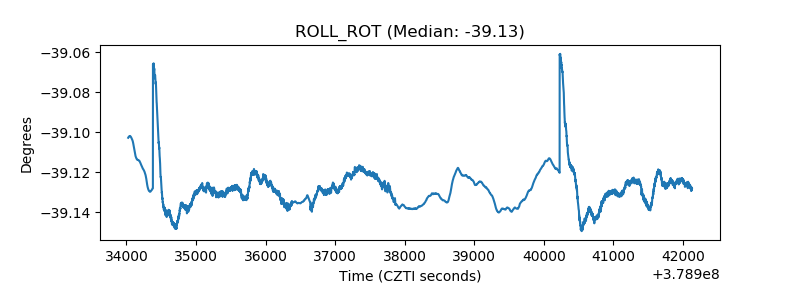 |
| _Roll_DEC | 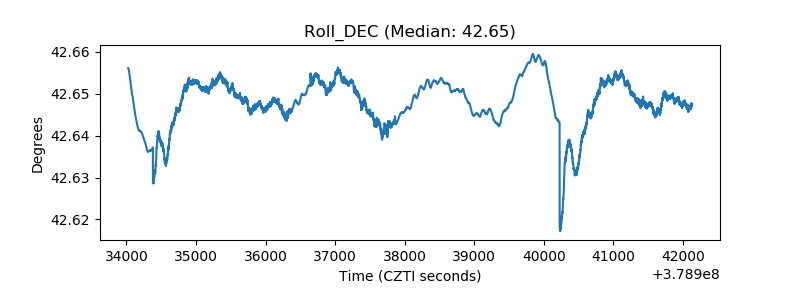 |
| _Roll_RA | 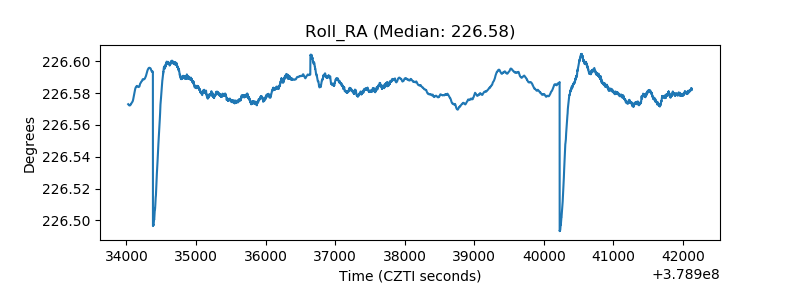 |
| Veto Counter | 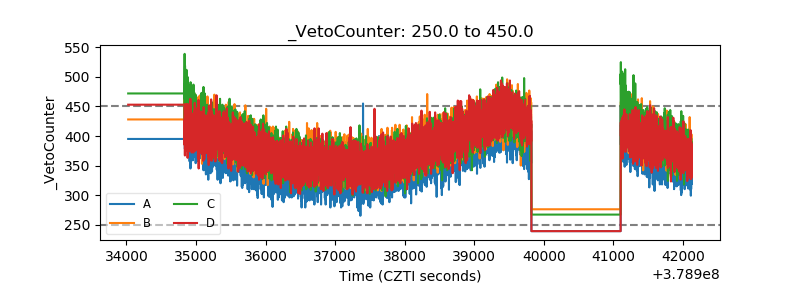 |