| Param | Original file | Final file |
|---|---|---|
| Filename | modeM0/AS1T04_090T01_9000004840_33895cztM0_level2.evt | modeM0/AS1T04_090T01_9000004840_33895cztM0_level2_quad_clean.evt |
| Size (bytes) | 1,651,415,040 | 230,837,760 |
| Size | 1.5 GB | 220.1 MB |
| Events in quadrant A | 15,622,059 | 1,466,454 |
| Events in quadrant B | 10,153,893 | 1,508,674 |
| Events in quadrant C | 8,784,879 | 1,509,289 |
| Events in quadrant D | 14,395,901 | 1,421,731 |
| Mode M9 | |||
|---|---|---|---|
| Quadrant | BADHDUFLAG | Total packets | Discarded packets |
| A | 0 | 55 | 0 |
| B | 0 | 55 | 0 |
| C | 0 | 55 | 0 |
| D | 0 | 55 | 0 |
| Mode M0 | |||
|---|---|---|---|
| Quadrant | BADHDUFLAG | Total packets | Discarded packets |
| A | 0 | 57934 | 5 |
| B | 0 | 40799 | 4 |
| C | 0 | 36013 | 4 |
| D | 0 | 53729 | 4 |
| Mode SS | |||
|---|---|---|---|
| Quadrant | BADHDUFLAG | Total packets | Discarded packets |
| A | 0 | 324 | 0 |
| B | 0 | 324 | 0 |
| C | 0 | 324 | 0 |
| D | 0 | 324 | 0 |
| Quadrant | Total seconds | Saturated seconds | Saturation percentage |
|---|---|---|---|
| A | 15724 | 1676 | 10.658865% |
| B | 15724 | 944 | 6.003561% |
| C | 15724 | 212 | 1.348257% |
| D | 15724 | 806 | 5.125922% |
Noise dominated data is calculated using 1-second bins in cleaned event files. If a bin has >2000 counts, and if more than 50% of those come from <1% of pixels, then it is considered to be noise-dominated and hence unusable.
| Quadrant | # 1 sec bins | Bins with >0 counts | Bins with >2000 counts | High rate bins dominated by noise | Noise dominated (total time) | Noise dominated (detector-on time) | Marked lightcurve |
|---|---|---|---|---|---|---|---|
| A | 21246 | 15728 | 1171 | 1171 | 5.51% | 7.45% | 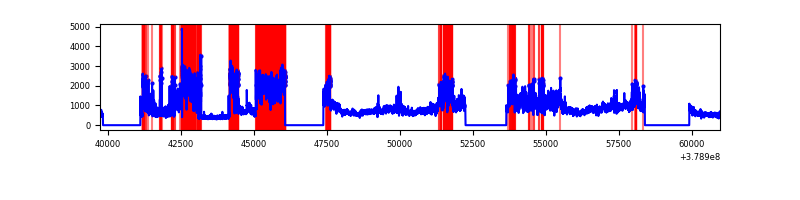 |
| B | 21246 | 15728 | 621 | 621 | 2.92% | 3.95% | 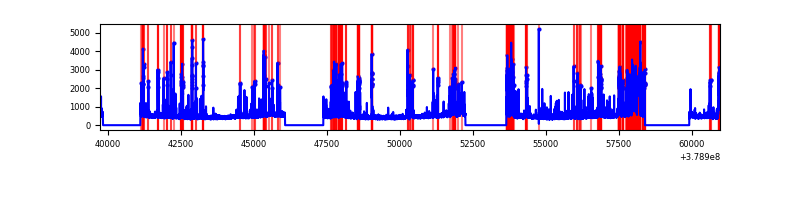 |
| C | 21246 | 15728 | 151 | 151 | 0.71% | 0.96% | 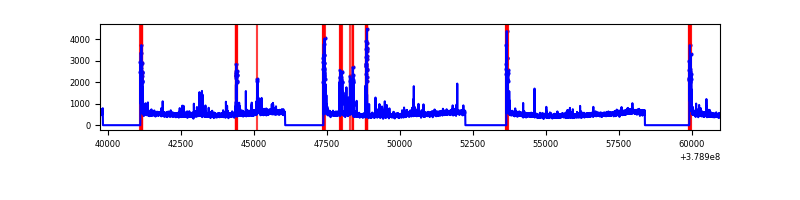 |
| D | 21246 | 15728 | 513 | 513 | 2.41% | 3.26% | 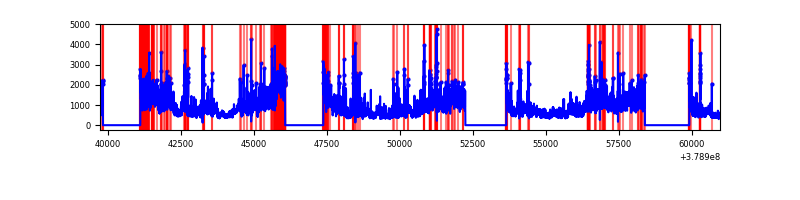 |
Top three noisy pixels from each quadrant. If the there are fewer than three noisy pixels in the level2.evt file, extra rows are filled as -1
| Pixel properties | Quadrant properties | ||||||
|---|---|---|---|---|---|---|---|
| Quadrant | DetID | PixID | Counts | Sigma | Mean | Median | Sigma |
| A | 15 | 169 | 8710319 | 25074.6 | 1756 | 1723 | 347.3 |
| A | 7 | 16 | 56526 | 157.79 | 1756 | 1723 | 347.3 |
| A | 13 | 6 | 53987 | 150.48 | 1756 | 1723 | 347.3 |
| B | 5 | 172 | 2575833 | 7716.66 | 1753 | 1705 | 333.6 |
| B | 0 | 156 | 135164 | 400.08 | 1753 | 1705 | 333.6 |
| B | 4 | 251 | 125880 | 372.25 | 1753 | 1705 | 333.6 |
| C | 0 | 10 | 722932 | 1809.34 | 1744 | 1756 | 398.6 |
| C | 15 | 214 | 674529 | 1687.91 | 1744 | 1756 | 398.6 |
| C | 3 | 233 | 271381 | 676.46 | 1744 | 1756 | 398.6 |
| D | 1 | 52 | 3741390 | 8775.3 | 1727 | 1675 | 426.2 |
| D | 8 | 195 | 2456042 | 5759.21 | 1727 | 1675 | 426.2 |
| D | 13 | 249 | 405116 | 946.68 | 1727 | 1675 | 426.2 |
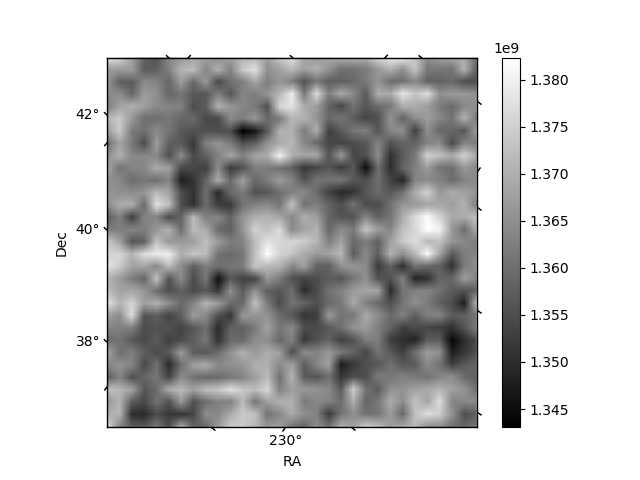
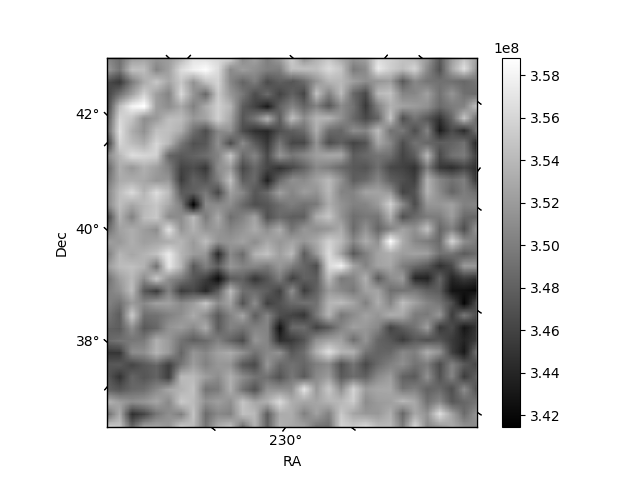
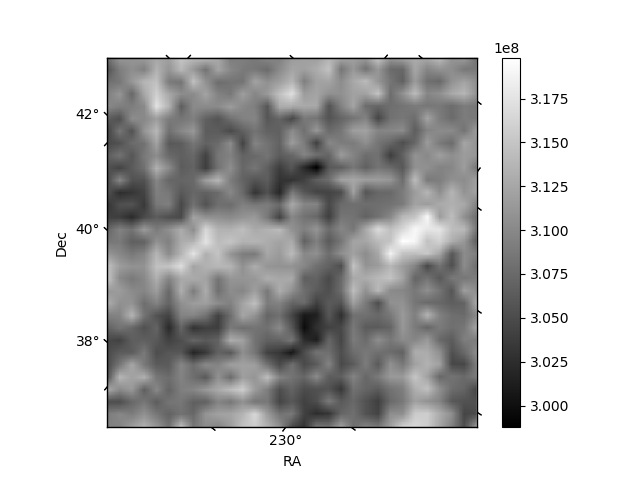
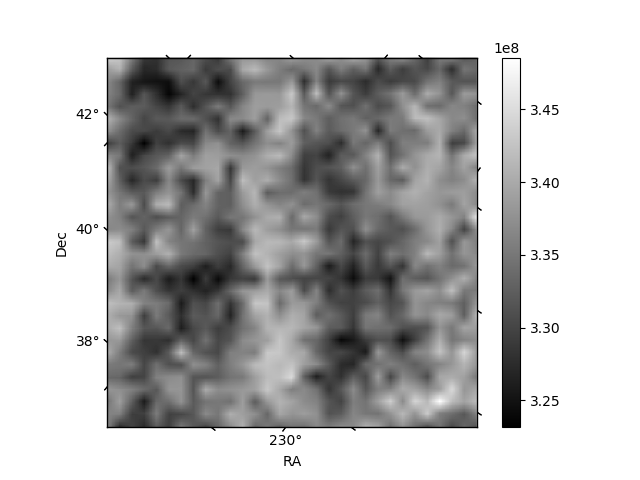
Histogram calculated using DETX and DETY for each event in the final _common_clean file
| Quadrant A | 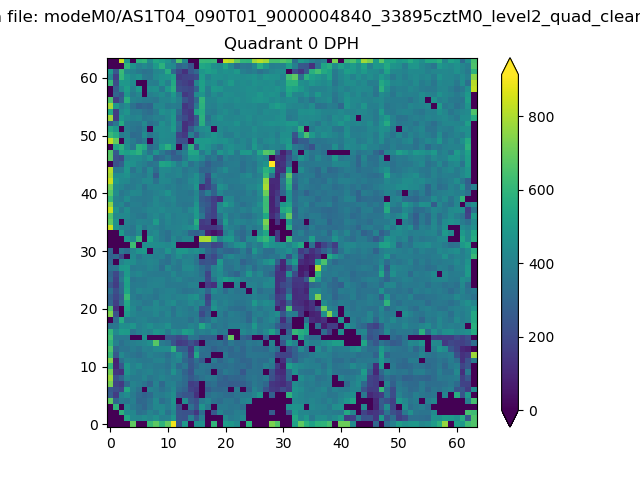 |
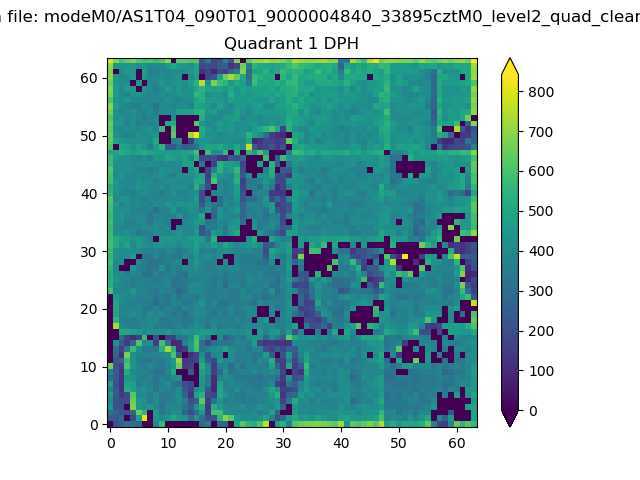 |
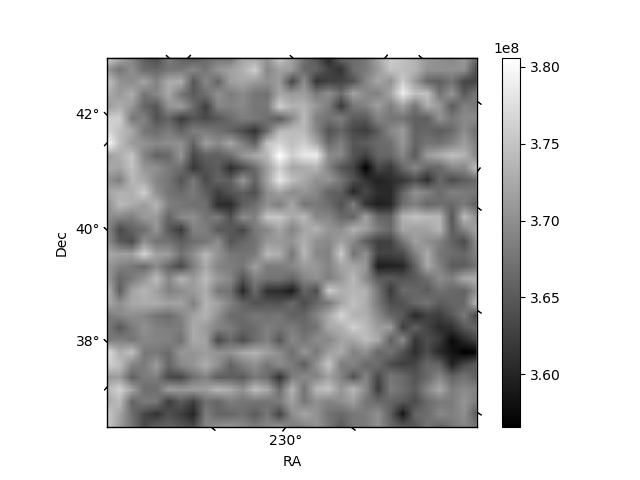
Quadrant B |
|---|---|---|---|
| Quadrant D | 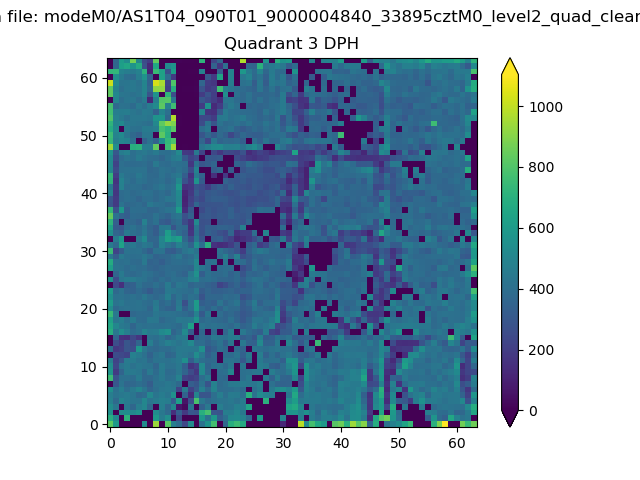 |
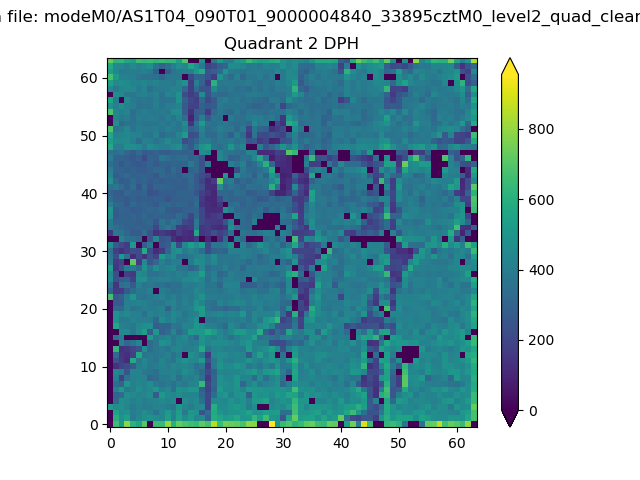 |
Quadrant C |
| Plot type | Count rate plots | Images |
|---|---|---|
| Comparison with Poisson distribution Blue bars denote a histogram of data divided into 1 sec bins. Red curve is a Poisson curve with rate = median count rate of data. |
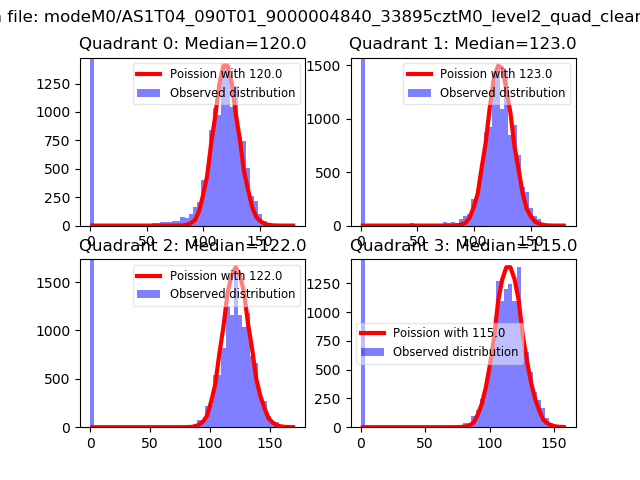 |
 |
| Quadrant-wise count rates Data is divided into 100 sec bins |
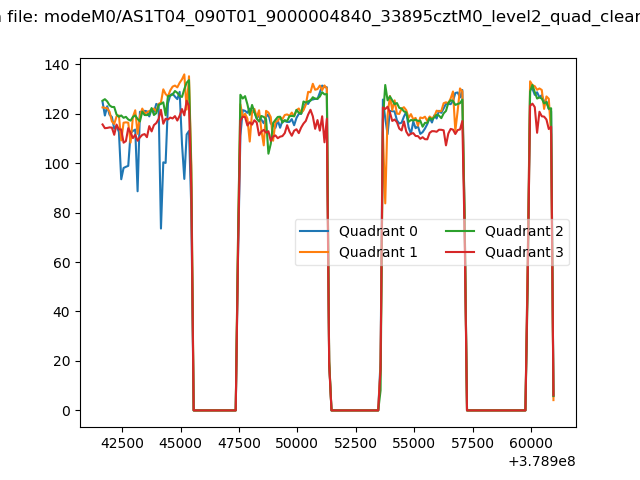 |
|
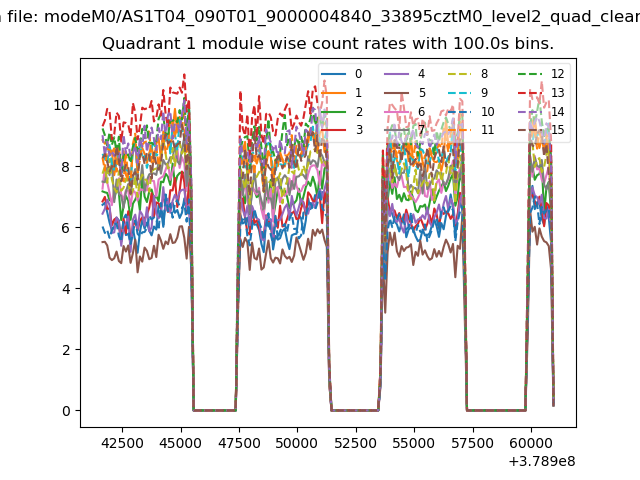
| Module-wise count rates for Quadrant A Data is divided into 100 sec bins |
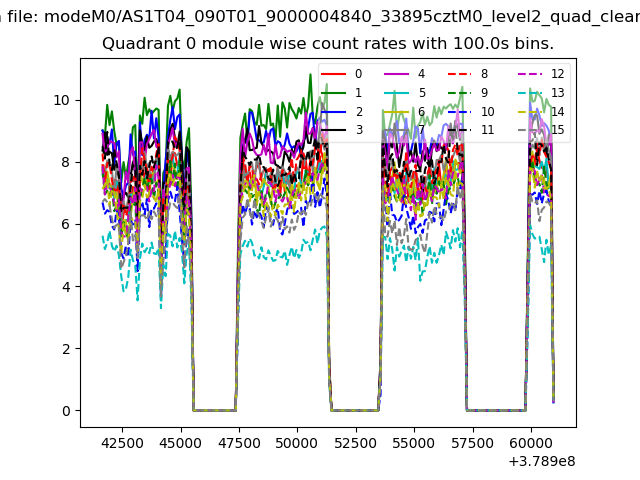 |
 |
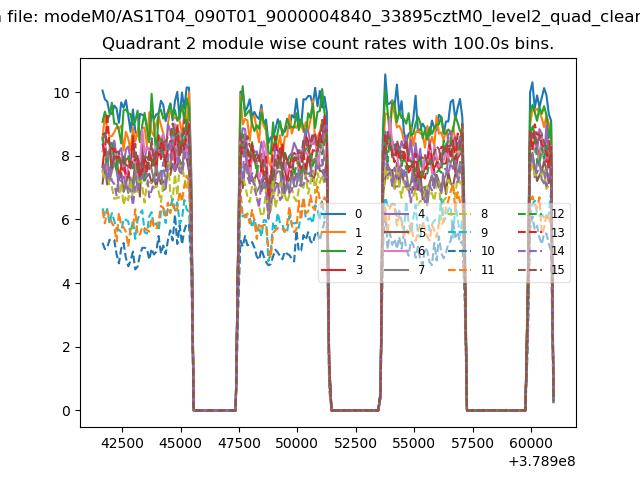
| Module-wise count rates for Quadrant B Data is divided into 100 sec bins |
 |
 |
| Module-wise count rates for Quadrant C Data is divided into 100 sec bins |
 |
 |
| Module-wise count rates for Quadrant D Data is divided into 100 sec bins |
 |
 |
| Parameter | Plot |
|---|---|
| CZT HV Monitor | 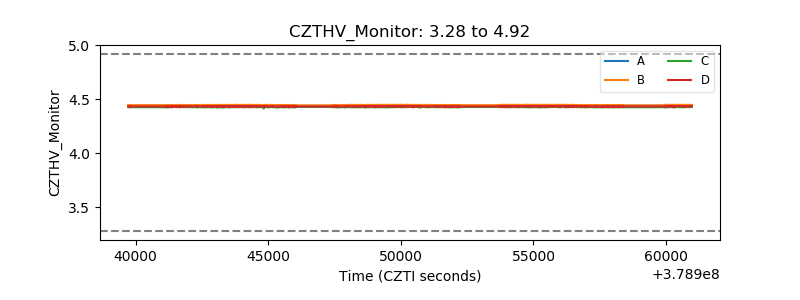 |
| D_VDD | 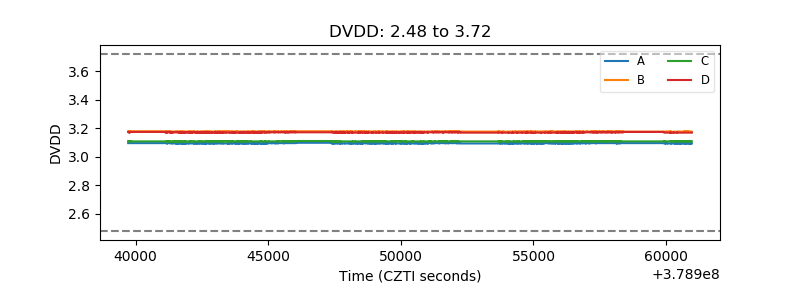 |
| Temperature 1 | 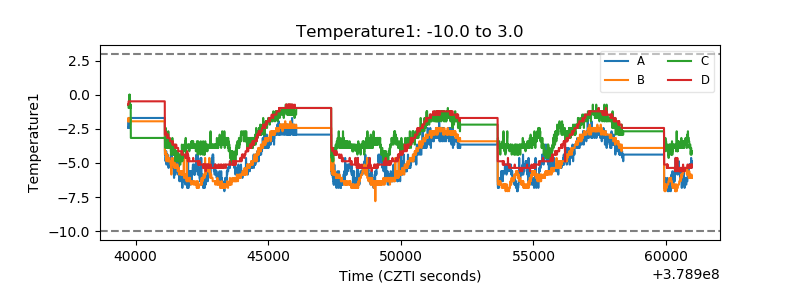 |
| Veto HV Monitor |  |
| Veto LLD | 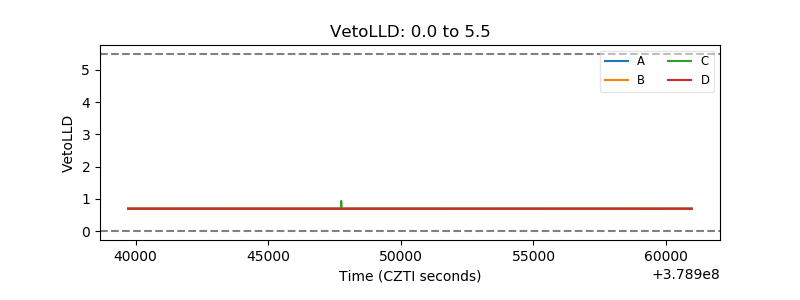 |
| Alpha Counter | 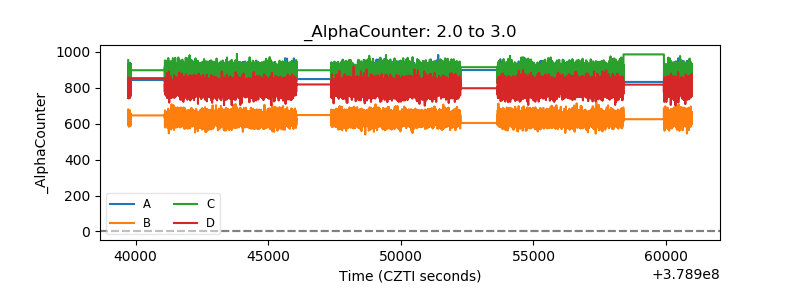 |
| _CPM_Rate | 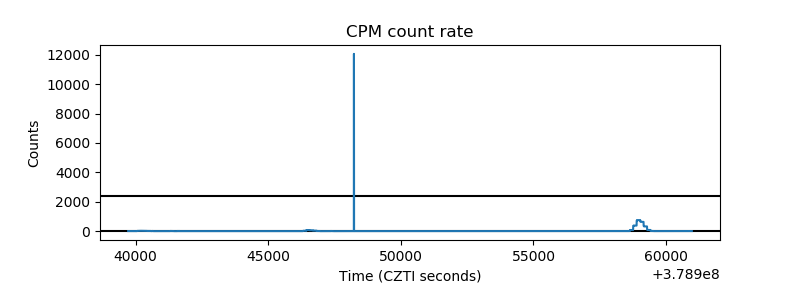 |
| CZT Counter | 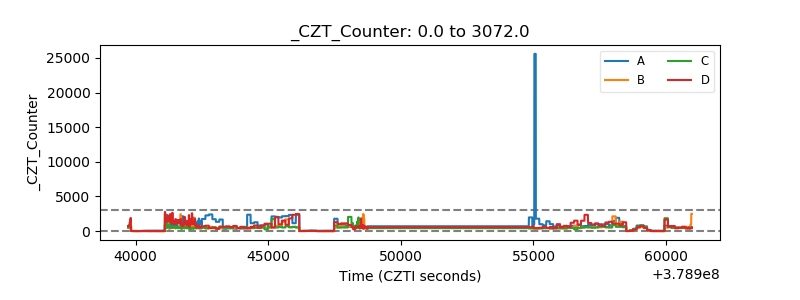 |
| +2.5 Volts monitor |  |
| +5 Volts monitor |  |
| _ROLL_ROT | 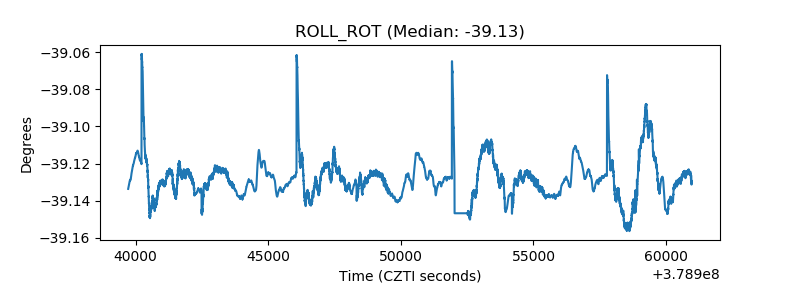 |
| _Roll_DEC | 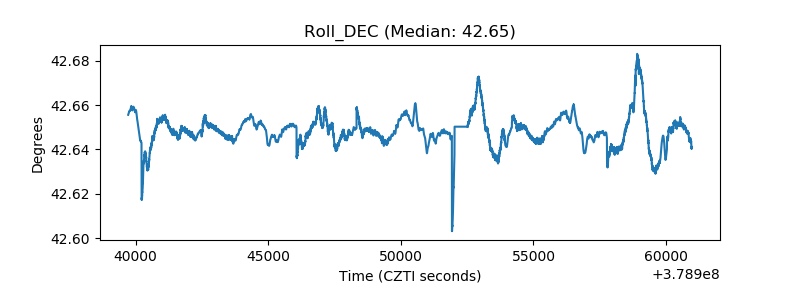 |
| _Roll_RA | 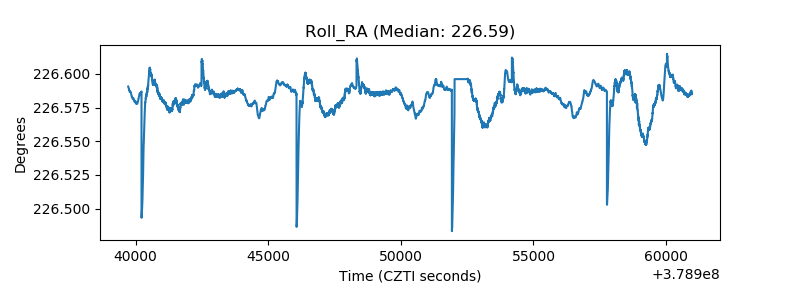 |
| Veto Counter |  |