| Param | Original file | Final file |
|---|---|---|
| Filename | modeM0/AS1T04_090T01_9000004840_33896cztM0_level2.evt | modeM0/AS1T04_090T01_9000004840_33896cztM0_level2_quad_clean.evt |
| Size (bytes) | 507,055,680 | 81,270,720 |
| Size | 483.6 MB | 77.5 MB |
| Events in quadrant A | 3,480,743 | 531,039 |
| Events in quadrant B | 3,344,480 | 536,517 |
| Events in quadrant C | 3,110,808 | 520,633 |
| Events in quadrant D | 5,034,066 | 474,426 |
| Mode M9 | |||
|---|---|---|---|
| Quadrant | BADHDUFLAG | Total packets | Discarded packets |
| A | 0 | 22 | 0 |
| B | 0 | 22 | 0 |
| C | 0 | 22 | 0 |
| D | 0 | 23 | 0 |
| Mode M0 | |||
|---|---|---|---|
| Quadrant | BADHDUFLAG | Total packets | Discarded packets |
| A | 0 | 14235 | 3 |
| B | 0 | 13711 | 2 |
| C | 0 | 12765 | 2 |
| D | 0 | 19024 | 2 |
| Mode SS | |||
|---|---|---|---|
| Quadrant | BADHDUFLAG | Total packets | Discarded packets |
| A | 0 | 118 | 0 |
| B | 0 | 118 | 0 |
| C | 0 | 118 | 0 |
| D | 0 | 118 | 0 |
| Quadrant | Total seconds | Saturated seconds | Saturation percentage |
|---|---|---|---|
| A | 5690 | 4 | 0.070299% |
| B | 5690 | 180 | 3.163445% |
| C | 5690 | 85 | 1.493849% |
| D | 5690 | 365 | 6.414763% |
Noise dominated data is calculated using 1-second bins in cleaned event files. If a bin has >2000 counts, and if more than 50% of those come from <1% of pixels, then it is considered to be noise-dominated and hence unusable.
| Quadrant | # 1 sec bins | Bins with >0 counts | Bins with >2000 counts | High rate bins dominated by noise | Noise dominated (total time) | Noise dominated (detector-on time) | Marked lightcurve |
|---|---|---|---|---|---|---|---|
| A | 7332 | 5691 | 0 | 0 | 0.00% | 0.00% | 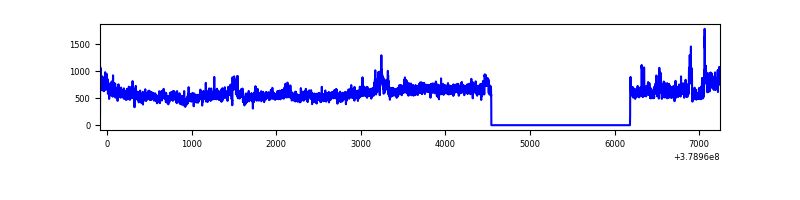 |
| B | 7332 | 5691 | 109 | 109 | 1.49% | 1.92% | 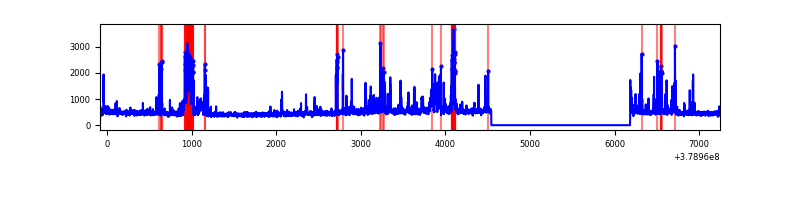 |
| C | 7332 | 5691 | 68 | 68 | 0.93% | 1.19% | 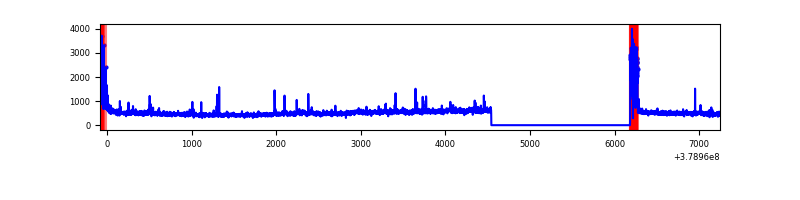 |
| D | 7331 | 5690 | 292 | 292 | 3.98% | 5.13% | 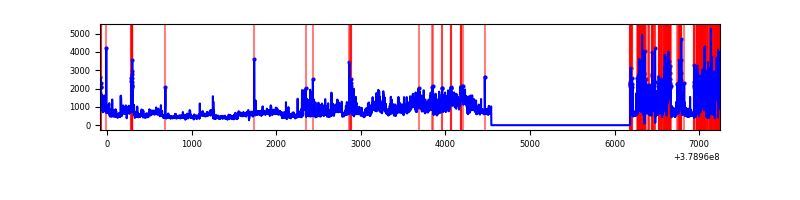 |
Top three noisy pixels from each quadrant. If the there are fewer than three noisy pixels in the level2.evt file, extra rows are filled as -1
| Pixel properties | Quadrant properties | ||||||
|---|---|---|---|---|---|---|---|
| Quadrant | DetID | PixID | Counts | Sigma | Mean | Median | Sigma |
| A | 15 | 169 | 932295 | 7179.49 | 654 | 642 | 129.8 |
| A | 13 | 6 | 12380 | 90.46 | 654 | 642 | 129.8 |
| A | 10 | 83 | 12095 | 88.26 | 654 | 642 | 129.8 |
| B | 5 | 172 | 392818 | 3187.22 | 644 | 626 | 123.1 |
| B | 4 | 251 | 180359 | 1460.64 | 644 | 626 | 123.1 |
| B | 0 | 156 | 60181 | 483.99 | 644 | 626 | 123.1 |
| C | 0 | 10 | 282031 | 1940.01 | 626 | 631 | 145.1 |
| C | 15 | 214 | 247986 | 1705.3 | 626 | 631 | 145.1 |
| C | 3 | 233 | 89476 | 612.51 | 626 | 631 | 145.1 |
| D | 12 | 235 | 851513 | 5637.48 | 613 | 595 | 150.9 |
| D | 1 | 52 | 835253 | 5529.76 | 613 | 595 | 150.9 |
| D | 8 | 195 | 594841 | 3936.99 | 613 | 595 | 150.9 |
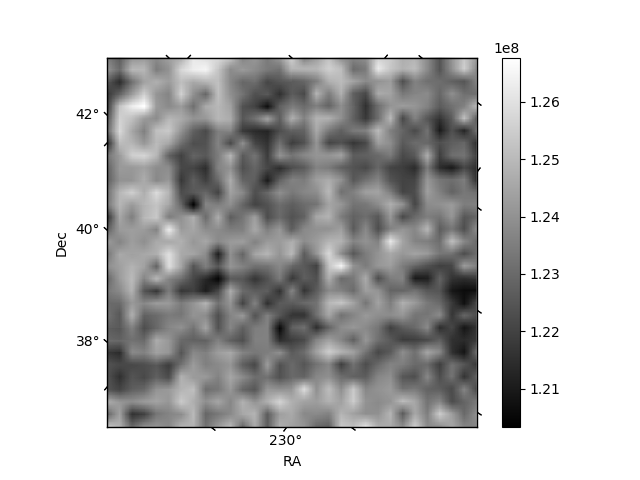
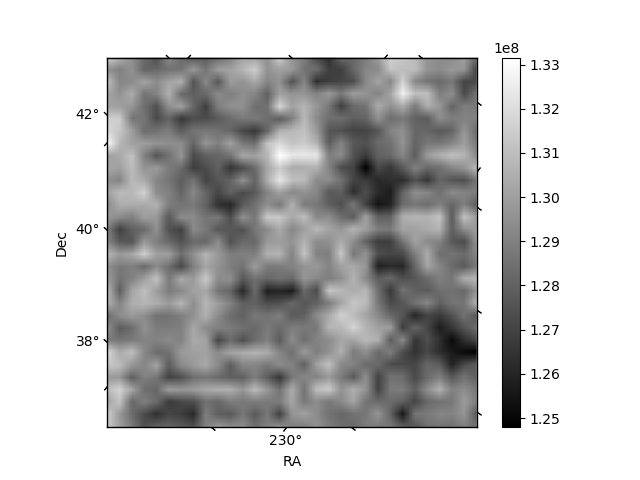
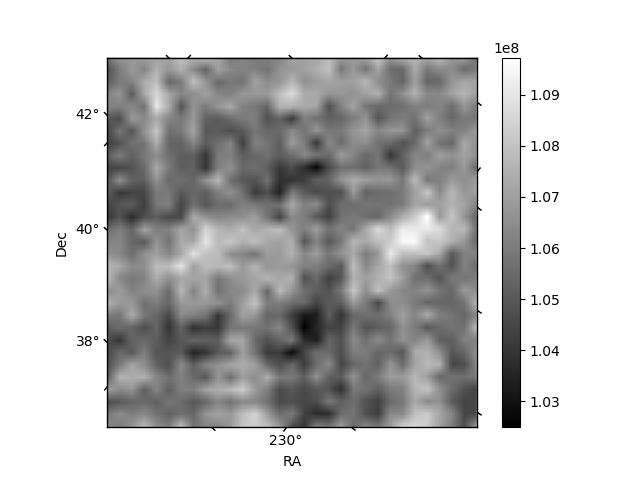
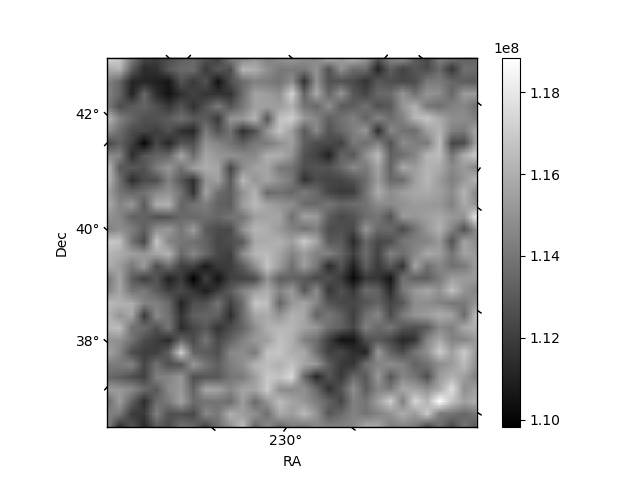
Histogram calculated using DETX and DETY for each event in the final _common_clean file
| Quadrant A | 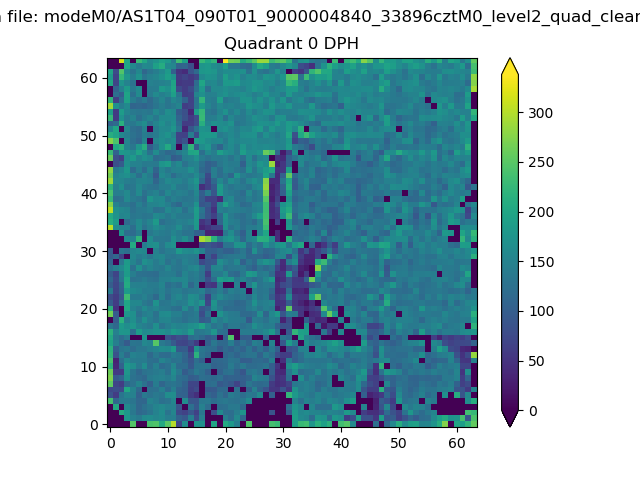 |
 |
Quadrant B |
|---|---|---|---|
| Quadrant D | 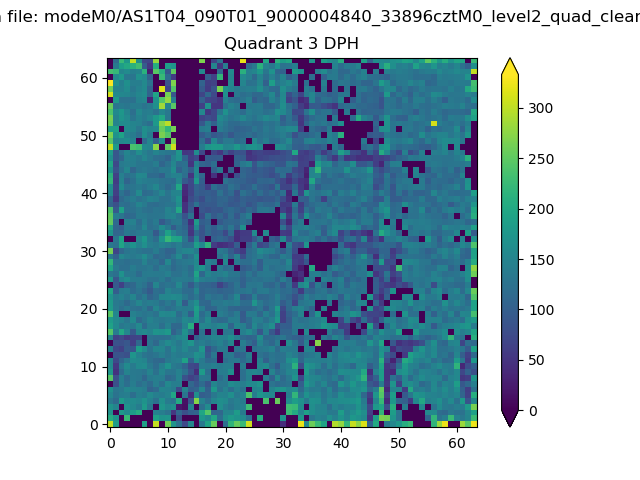 |
 |
Quadrant C |
| Plot type | Count rate plots | Images |
|---|---|---|
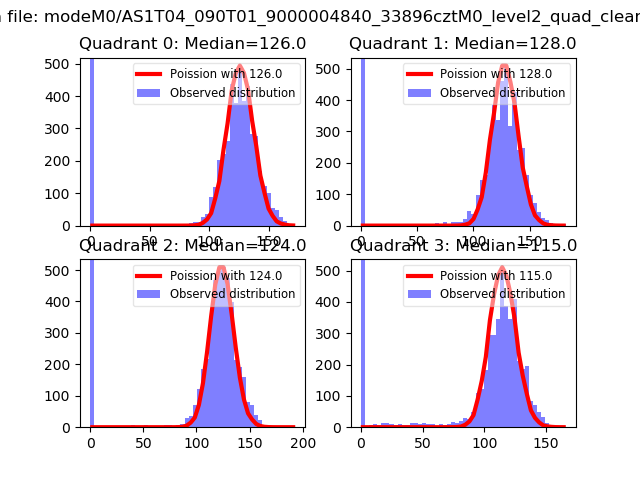
| Comparison with Poisson distribution Blue bars denote a histogram of data divided into 1 sec bins. Red curve is a Poisson curve with rate = median count rate of data. |
 |
 |
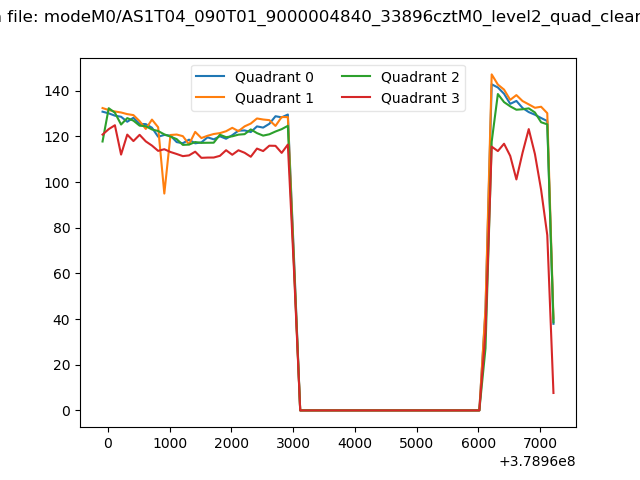
| Quadrant-wise count rates Data is divided into 100 sec bins |
 |
|
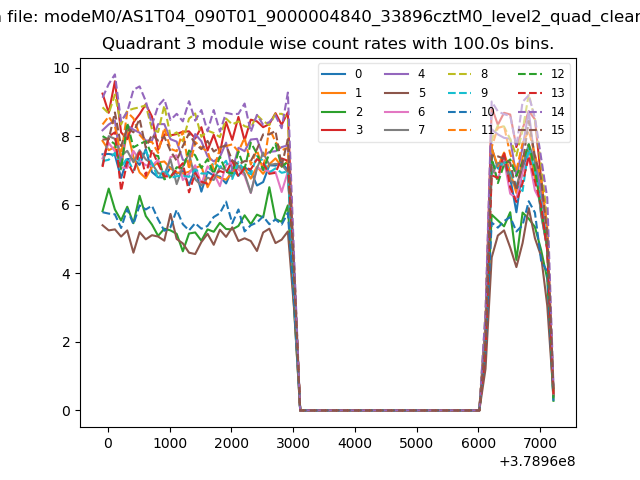
| Module-wise count rates for Quadrant A Data is divided into 100 sec bins |
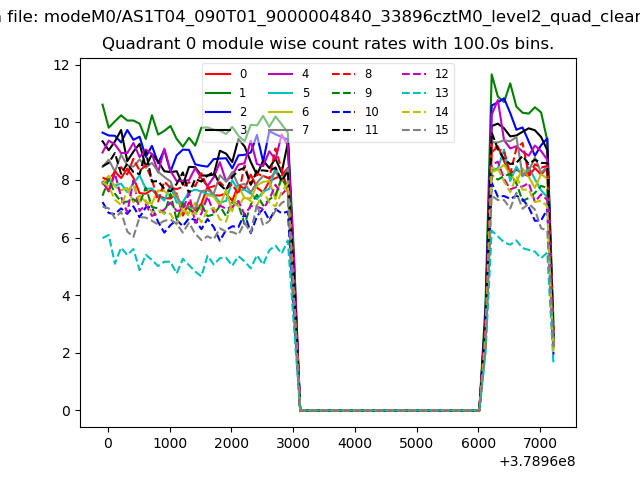 |
 |
| Module-wise count rates for Quadrant B Data is divided into 100 sec bins |
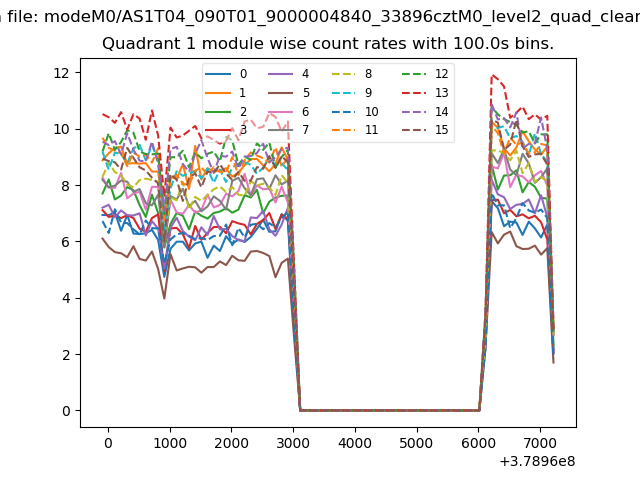 |
 |
| Module-wise count rates for Quadrant C Data is divided into 100 sec bins |
 |
 |
| Module-wise count rates for Quadrant D Data is divided into 100 sec bins |
 |
 |
| Parameter | Plot |
|---|---|
| CZT HV Monitor | 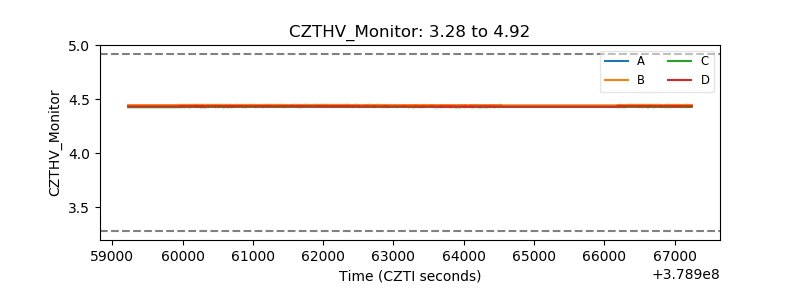 |
| D_VDD | 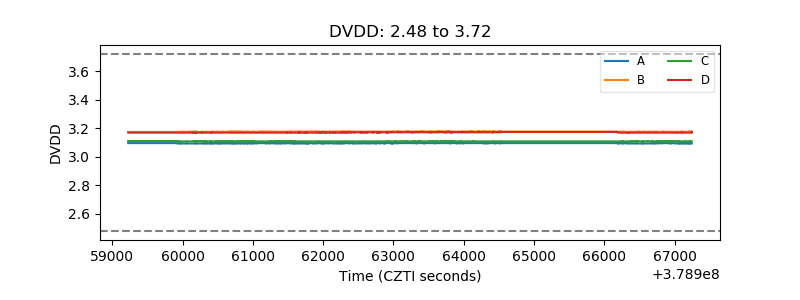 |
| Temperature 1 | 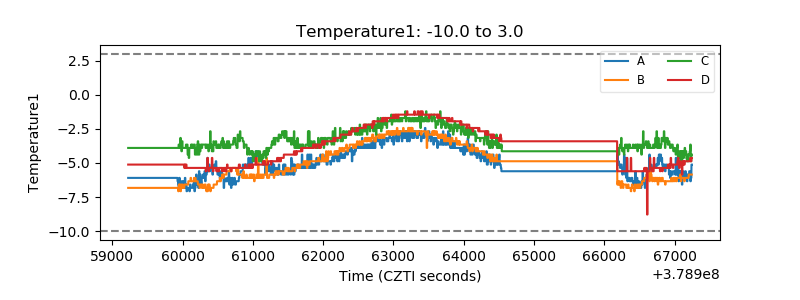 |
| Veto HV Monitor | 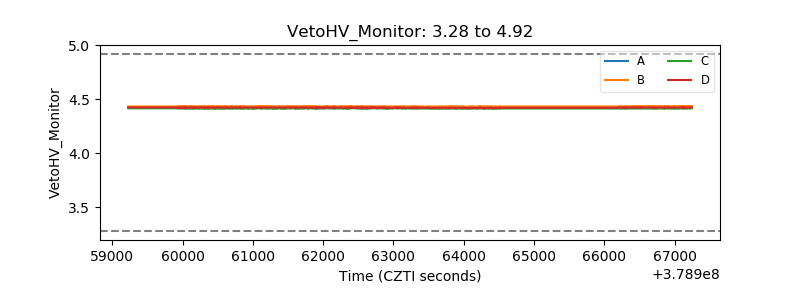 |
| Veto LLD |  |
| Alpha Counter | 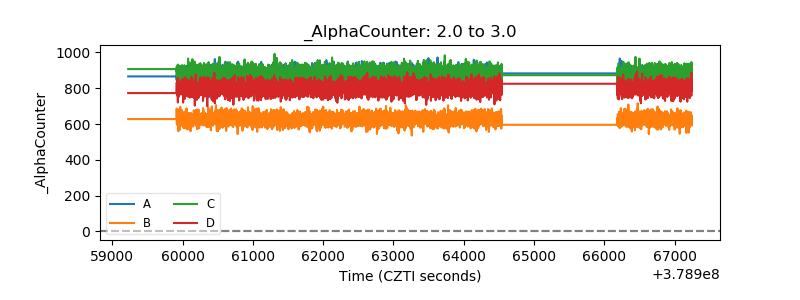 |
| _CPM_Rate | 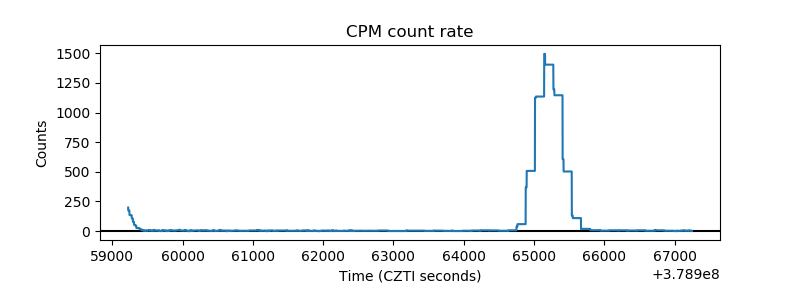 |
| CZT Counter |  |
| +2.5 Volts monitor |  |
| +5 Volts monitor |  |
| _ROLL_ROT | 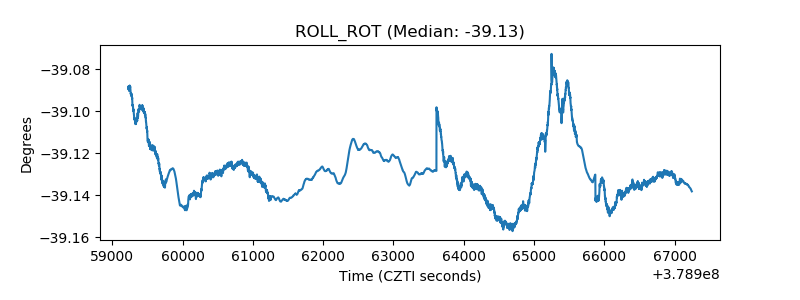 |
| _Roll_DEC | 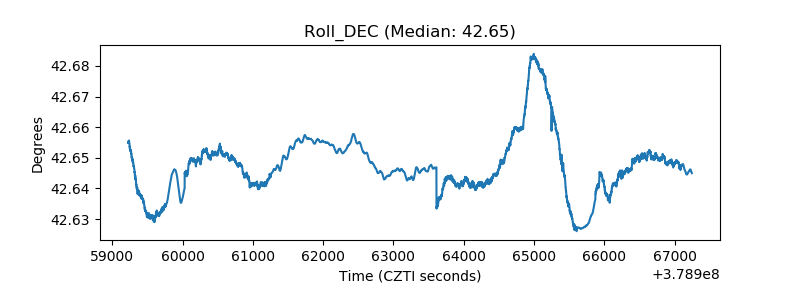 |
| _Roll_RA | 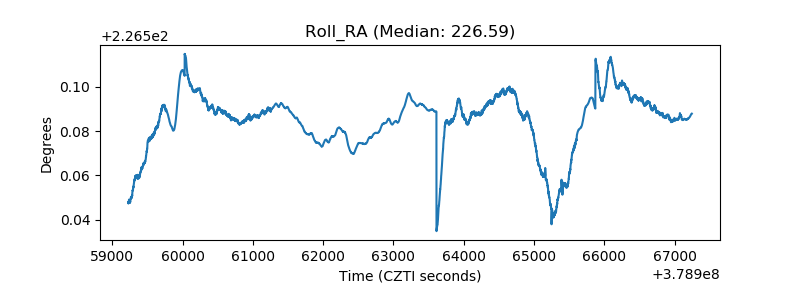 |
| Veto Counter | 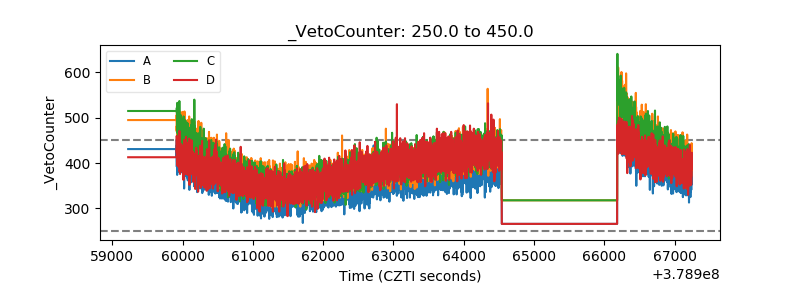 |