| Param | Original file | Final file |
|---|---|---|
| Filename | modeM0/AS1T04_090T01_9000004840_33898cztM0_level2.evt | modeM0/AS1T04_090T01_9000004840_33898cztM0_level2_quad_clean.evt |
| Size (bytes) | 501,364,800 | 70,323,840 |
| Size | 478.1 MB | 67.1 MB |
| Events in quadrant A | 3,474,415 | 459,666 |
| Events in quadrant B | 2,896,722 | 467,134 |
| Events in quadrant C | 2,813,609 | 450,156 |
| Events in quadrant D | 5,644,530 | 385,330 |
| Mode M9 | |||
|---|---|---|---|
| Quadrant | BADHDUFLAG | Total packets | Discarded packets |
| A | 0 | 18 | 0 |
| B | 0 | 18 | 0 |
| C | 0 | 18 | 0 |
| D | 0 | 18 | 0 |
| Mode M0 | |||
|---|---|---|---|
| Quadrant | BADHDUFLAG | Total packets | Discarded packets |
| A | 0 | 13929 | 2 |
| B | 0 | 11977 | 1 |
| C | 0 | 11416 | 1 |
| D | 0 | 20454 | 1 |
| Mode SS | |||
|---|---|---|---|
| Quadrant | BADHDUFLAG | Total packets | Discarded packets |
| A | 0 | 106 | 0 |
| B | 0 | 106 | 0 |
| C | 0 | 106 | 0 |
| D | 0 | 106 | 0 |
| Quadrant | Total seconds | Saturated seconds | Saturation percentage |
|---|---|---|---|
| A | 5238 | 19 | 0.362734% |
| B | 5238 | 121 | 2.310042% |
| C | 5238 | 32 | 0.610920% |
| D | 5238 | 581 | 11.092020% |
Noise dominated data is calculated using 1-second bins in cleaned event files. If a bin has >2000 counts, and if more than 50% of those come from <1% of pixels, then it is considered to be noise-dominated and hence unusable.
| Quadrant | # 1 sec bins | Bins with >0 counts | Bins with >2000 counts | High rate bins dominated by noise | Noise dominated (total time) | Noise dominated (detector-on time) | Marked lightcurve |
|---|---|---|---|---|---|---|---|
| A | 7001 | 5239 | 0 | 0 | 0.00% | 0.00% | 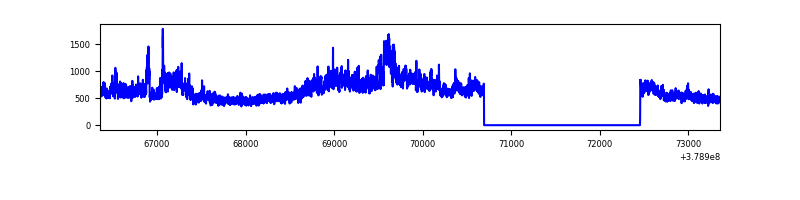 |
| B | 7001 | 5239 | 68 | 68 | 0.97% | 1.30% | 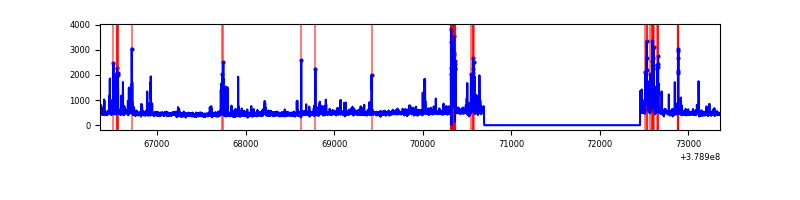 |
| C | 7001 | 5239 | 24 | 24 | 0.34% | 0.46% | 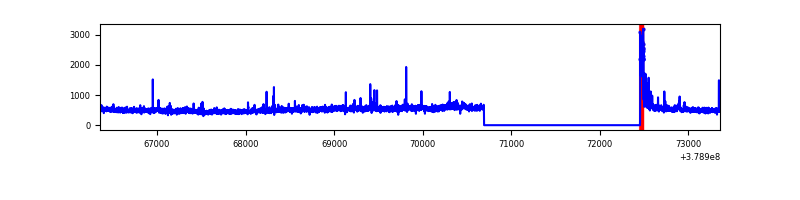 |
| D | 7001 | 5239 | 506 | 506 | 7.23% | 9.66% | 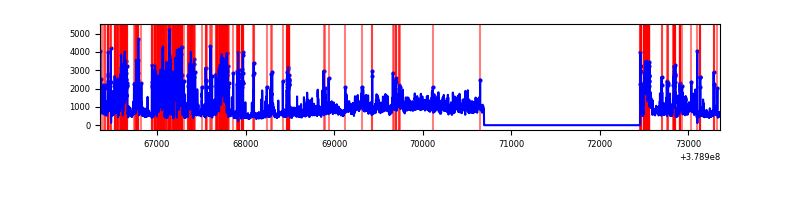 |
Top three noisy pixels from each quadrant. If the there are fewer than three noisy pixels in the level2.evt file, extra rows are filled as -1
| Pixel properties | Quadrant properties | ||||||
|---|---|---|---|---|---|---|---|
| Quadrant | DetID | PixID | Counts | Sigma | Mean | Median | Sigma |
| A | 15 | 169 | 1076647 | 8875.07 | 615 | 602 | 121.2 |
| A | 13 | 6 | 18809 | 150.17 | 615 | 602 | 121.2 |
| A | 10 | 83 | 7134 | 53.88 | 615 | 602 | 121.2 |
| B | 5 | 172 | 319608 | 2779.58 | 604 | 589 | 114.8 |
| B | 0 | 156 | 64076 | 553.16 | 604 | 589 | 114.8 |
| B | 4 | 232 | 48849 | 420.48 | 604 | 589 | 114.8 |
| C | 15 | 214 | 228110 | 1665.29 | 592 | 595 | 136.6 |
| C | 0 | 10 | 147019 | 1071.75 | 592 | 595 | 136.6 |
| C | 3 | 233 | 99850 | 726.49 | 592 | 595 | 136.6 |
| D | 12 | 235 | 1664776 | 11564.32 | 561 | 548 | 143.9 |
| D | 1 | 52 | 846685 | 5879.6 | 561 | 548 | 143.9 |
| D | 8 | 195 | 386072 | 2678.91 | 561 | 548 | 143.9 |
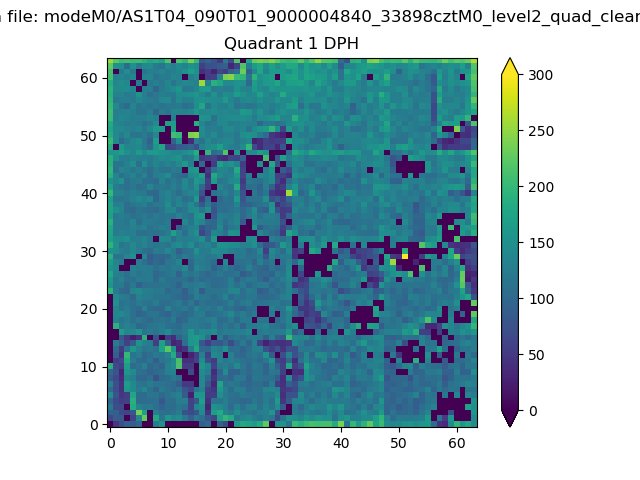
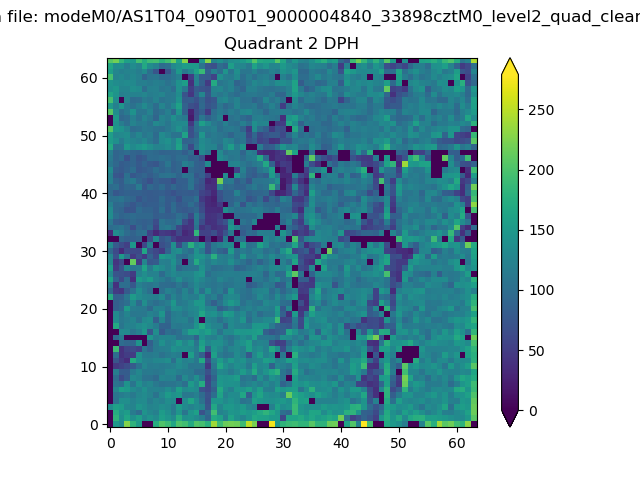
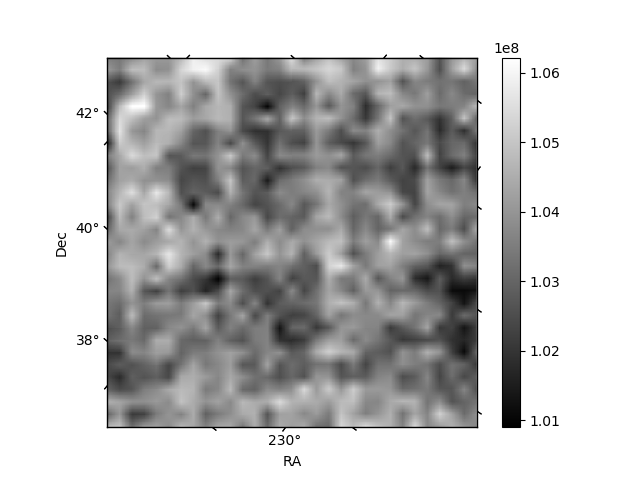
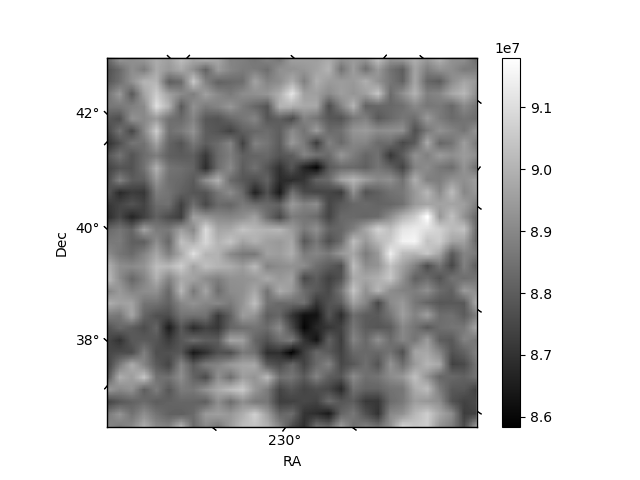
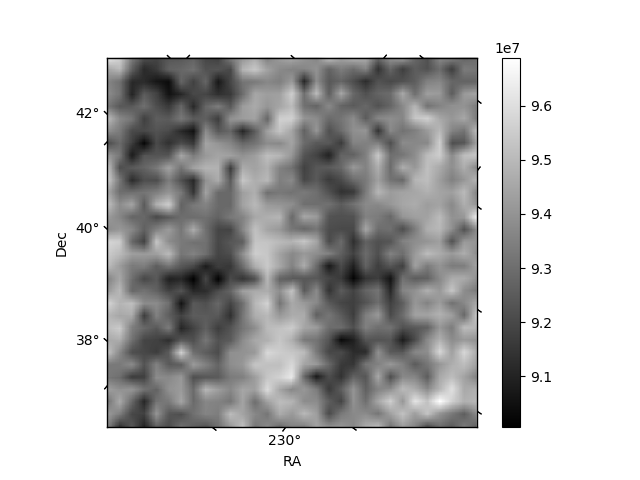
Histogram calculated using DETX and DETY for each event in the final _common_clean file
| Quadrant A |  |
 |
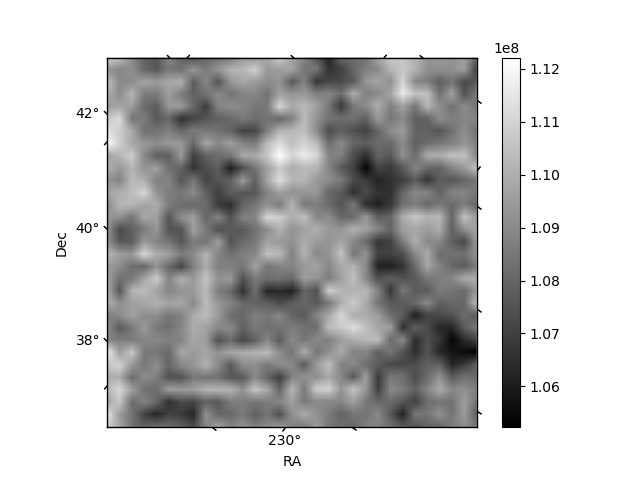
Quadrant B |
|---|---|---|---|
| Quadrant D |  |
 |
Quadrant C |
| Plot type | Count rate plots | Images |
|---|---|---|
| Comparison with Poisson distribution Blue bars denote a histogram of data divided into 1 sec bins. Red curve is a Poisson curve with rate = median count rate of data. |
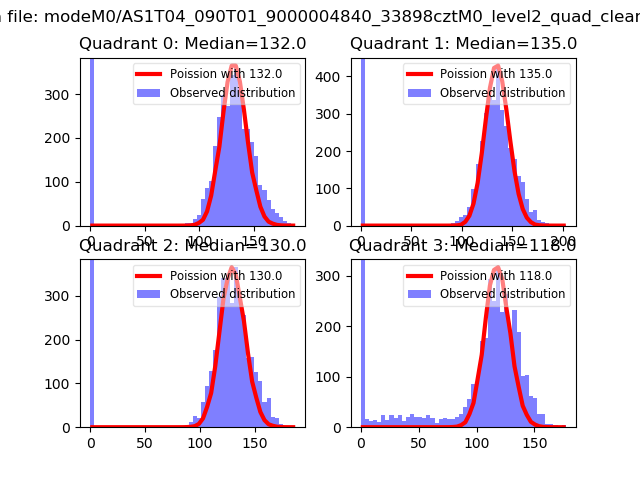 |
 |
| Quadrant-wise count rates Data is divided into 100 sec bins |
 |
|
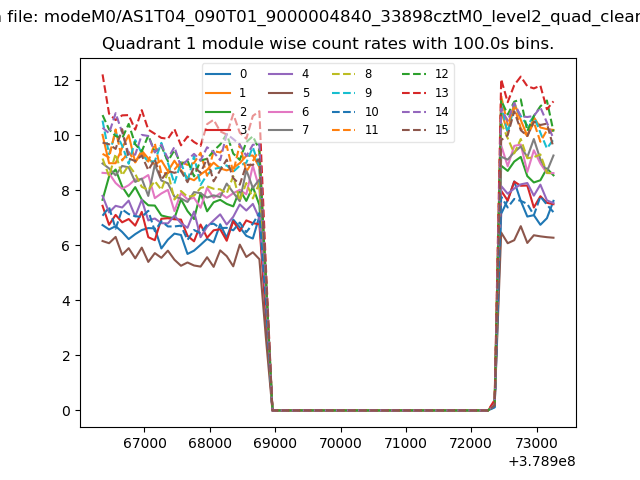
| Module-wise count rates for Quadrant A Data is divided into 100 sec bins |
 |
 |
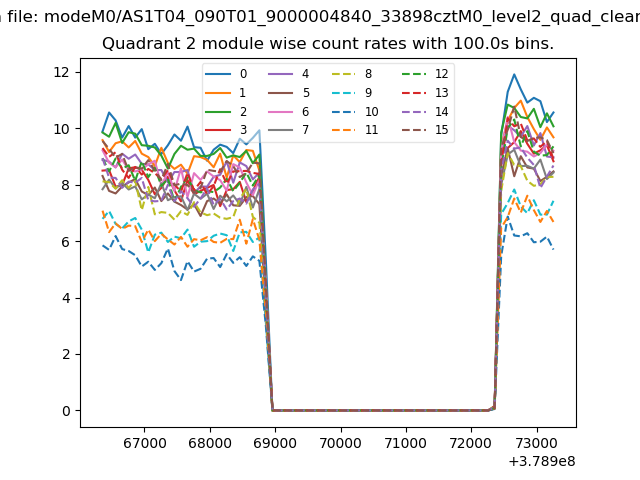
| Module-wise count rates for Quadrant B Data is divided into 100 sec bins |
 |
 |
| Module-wise count rates for Quadrant C Data is divided into 100 sec bins |
 |
 |
| Module-wise count rates for Quadrant D Data is divided into 100 sec bins |
 |
 |
| Parameter | Plot |
|---|---|
| CZT HV Monitor |  |
| D_VDD | 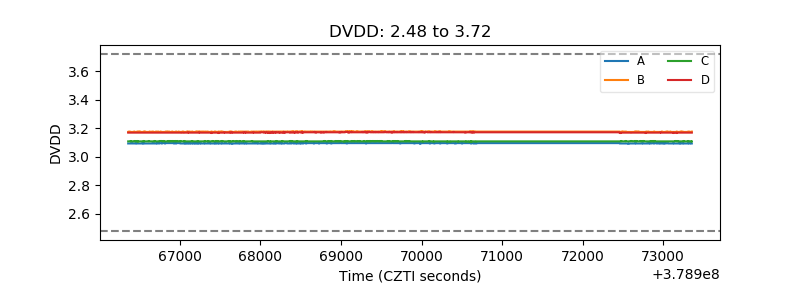 |
| Temperature 1 | 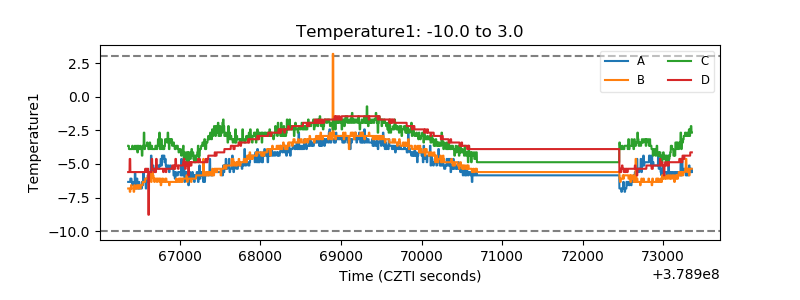 |
| Veto HV Monitor | 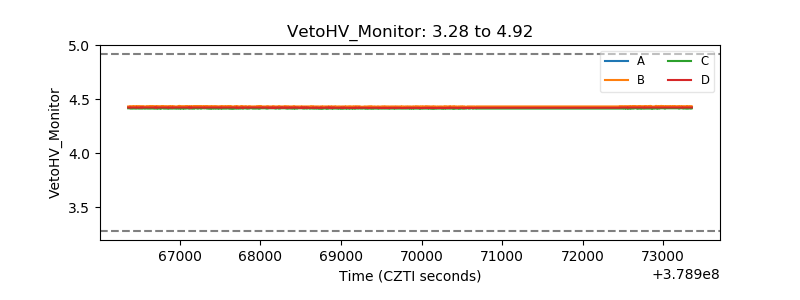 |
| Veto LLD | 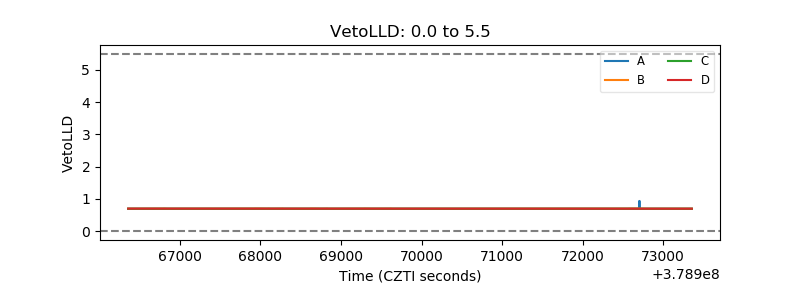 |
| Alpha Counter | 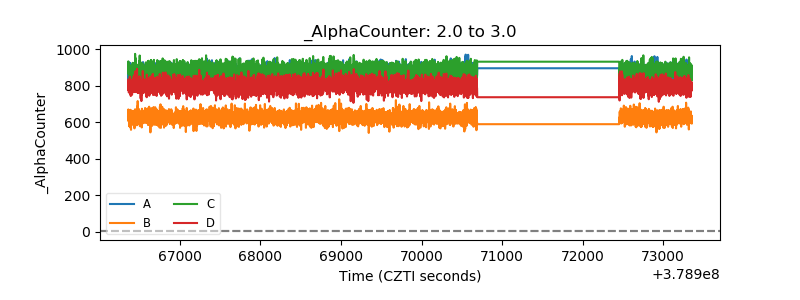 |
| _CPM_Rate | 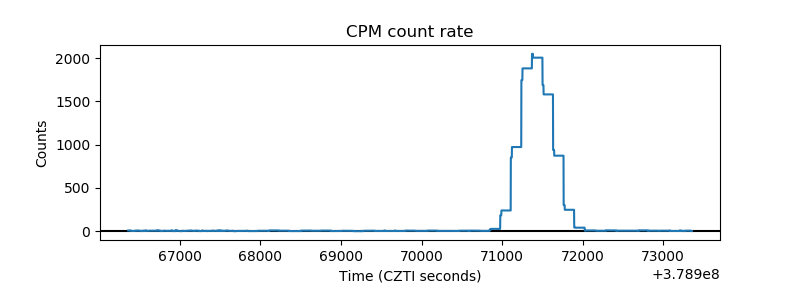 |
| CZT Counter | 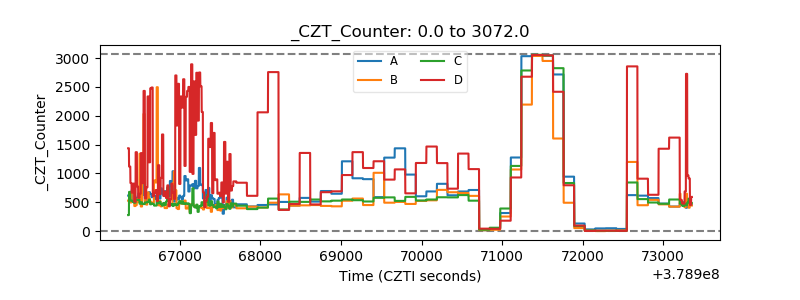 |
| +2.5 Volts monitor |  |
| +5 Volts monitor |  |
| _ROLL_ROT | 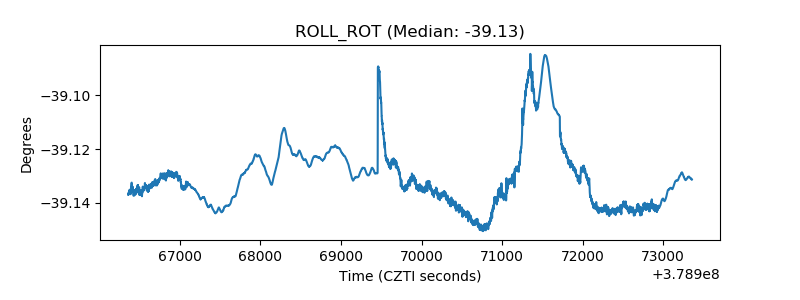 |
| _Roll_DEC | 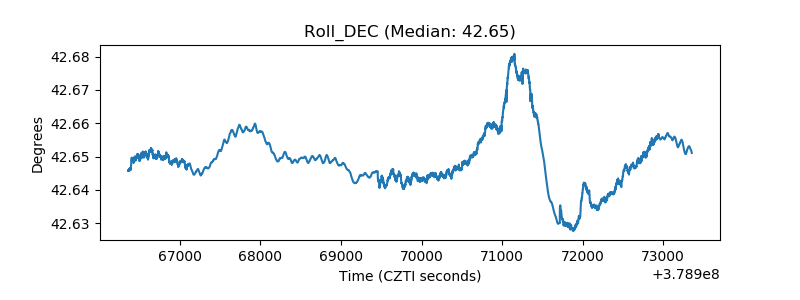 |
| _Roll_RA | 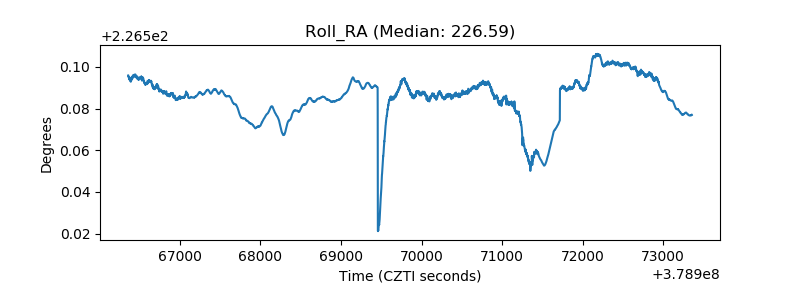 |
| Veto Counter | 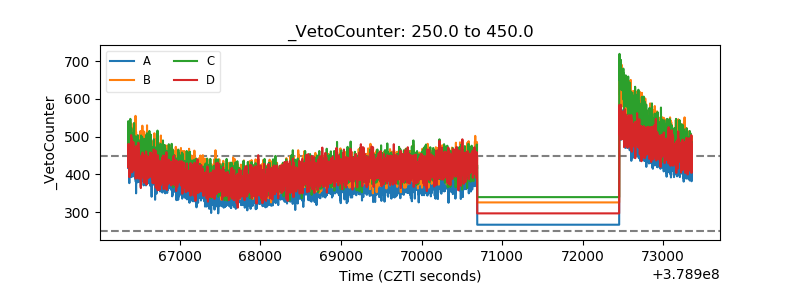 |