| Param | Original file | Final file |
|---|---|---|
| Filename | modeM0/AS1T04_090T01_9000004840_33899cztM0_level2.evt | modeM0/AS1T04_090T01_9000004840_33899cztM0_level2_quad_clean.evt |
| Size (bytes) | 518,535,360 | 71,602,560 |
| Size | 494.5 MB | 68.3 MB |
| Events in quadrant A | 4,539,742 | 446,827 |
| Events in quadrant B | 2,961,856 | 480,009 |
| Events in quadrant C | 2,984,173 | 459,075 |
| Events in quadrant D | 4,863,749 | 415,036 |
| Mode M9 | |||
|---|---|---|---|
| Quadrant | BADHDUFLAG | Total packets | Discarded packets |
| A | 0 | 26 | 0 |
| B | 0 | 26 | 0 |
| C | 0 | 26 | 0 |
| D | 0 | 27 | 0 |
| Mode M0 | |||
|---|---|---|---|
| Quadrant | BADHDUFLAG | Total packets | Discarded packets |
| A | 0 | 16857 | 2 |
| B | 0 | 11949 | 1 |
| C | 0 | 11764 | 1 |
| D | 0 | 18276 | 1 |
| Mode SS | |||
|---|---|---|---|
| Quadrant | BADHDUFLAG | Total packets | Discarded packets |
| A | 0 | 104 | 0 |
| B | 0 | 104 | 0 |
| C | 0 | 104 | 0 |
| D | 0 | 104 | 0 |
| Quadrant | Total seconds | Saturated seconds | Saturation percentage |
|---|---|---|---|
| A | 5247 | 467 | 8.900324% |
| B | 5247 | 102 | 1.943968% |
| C | 5247 | 81 | 1.543739% |
| D | 5247 | 239 | 4.554984% |
Noise dominated data is calculated using 1-second bins in cleaned event files. If a bin has >2000 counts, and if more than 50% of those come from <1% of pixels, then it is considered to be noise-dominated and hence unusable.
| Quadrant | # 1 sec bins | Bins with >0 counts | Bins with >2000 counts | High rate bins dominated by noise | Noise dominated (total time) | Noise dominated (detector-on time) | Marked lightcurve |
|---|---|---|---|---|---|---|---|
| A | 7160 | 5248 | 376 | 376 | 5.25% | 7.16% | 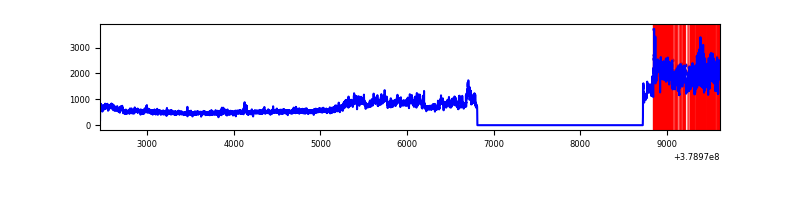 |
| B | 7160 | 5248 | 66 | 66 | 0.92% | 1.26% | 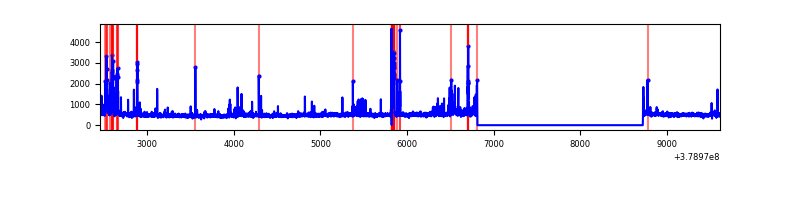 |
| C | 7160 | 5248 | 66 | 66 | 0.92% | 1.26% | 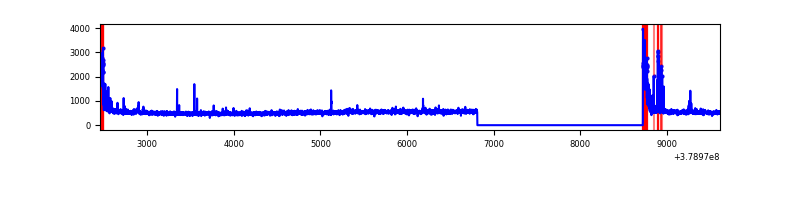 |
| D | 7160 | 5248 | 207 | 207 | 2.89% | 3.94% | 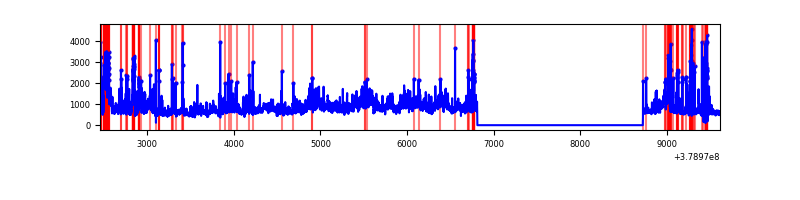 |
Top three noisy pixels from each quadrant. If the there are fewer than three noisy pixels in the level2.evt file, extra rows are filled as -1
| Pixel properties | Quadrant properties | ||||||
|---|---|---|---|---|---|---|---|
| Quadrant | DetID | PixID | Counts | Sigma | Mean | Median | Sigma |
| A | 15 | 169 | 2095860 | 17025.08 | 627 | 615 | 123.1 |
| A | 10 | 83 | 11401 | 87.64 | 627 | 615 | 123.1 |
| A | 13 | 6 | 9810 | 74.71 | 627 | 615 | 123.1 |
| B | 5 | 172 | 310579 | 2631.72 | 630 | 615 | 117.8 |
| B | 5 | 255 | 54846 | 460.44 | 630 | 615 | 117.8 |
| B | 3 | 112 | 36893 | 308.01 | 630 | 615 | 117.8 |
| C | 0 | 10 | 269512 | 1912.74 | 615 | 620 | 140.6 |
| C | 15 | 214 | 230651 | 1636.31 | 615 | 620 | 140.6 |
| C | 3 | 233 | 60526 | 426.14 | 615 | 620 | 140.6 |
| D | 12 | 235 | 919803 | 6243.98 | 606 | 588 | 147.2 |
| D | 1 | 52 | 757373 | 5140.64 | 606 | 588 | 147.2 |
| D | 8 | 195 | 559365 | 3795.62 | 606 | 588 | 147.2 |
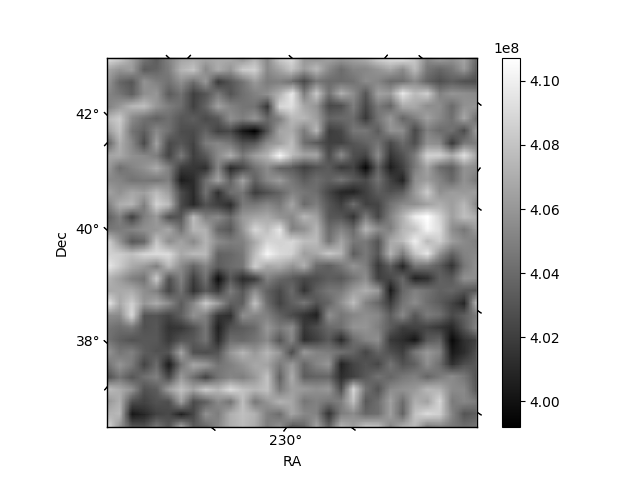
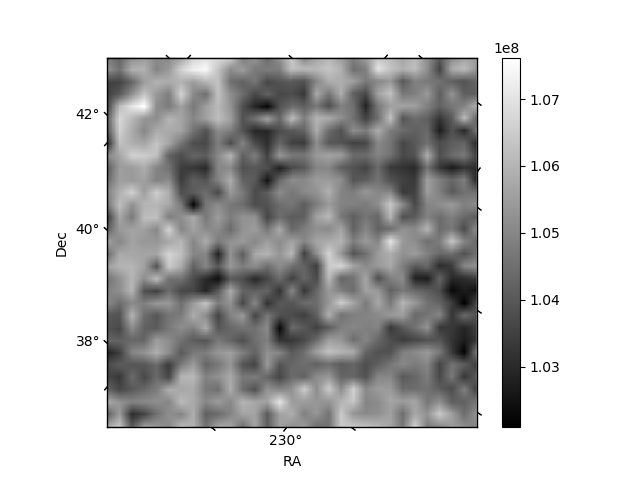
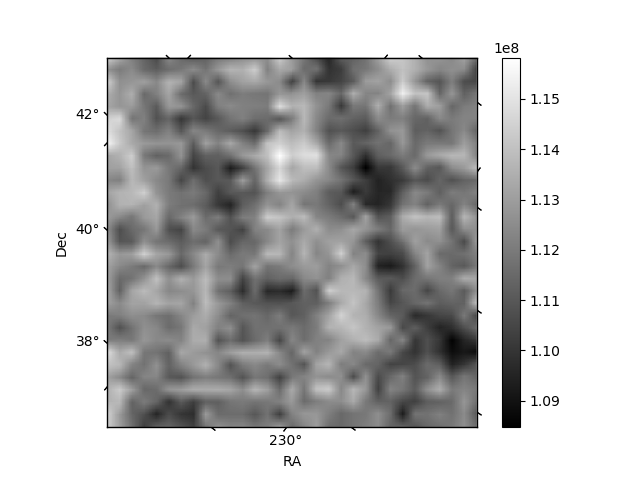
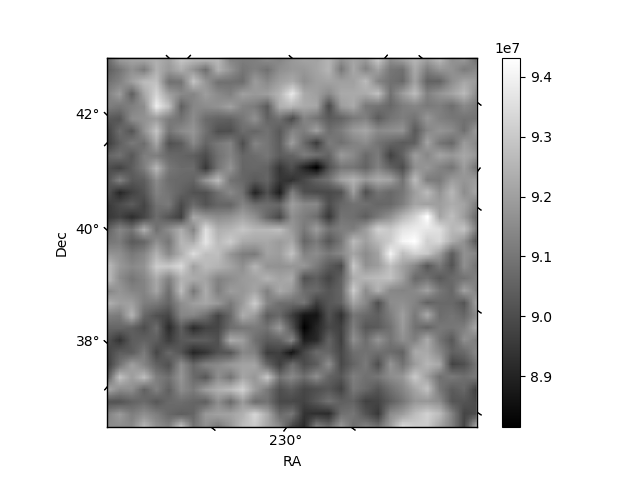
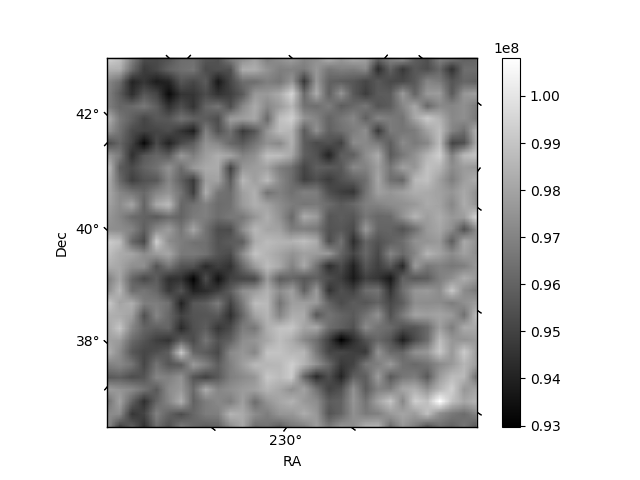
Histogram calculated using DETX and DETY for each event in the final _common_clean file
| Quadrant A | 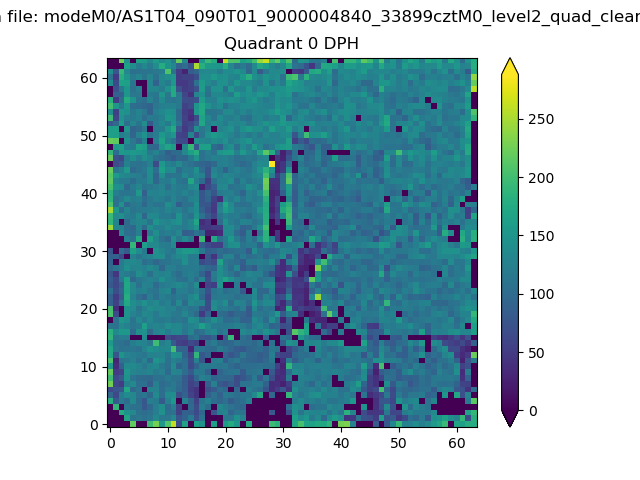 |
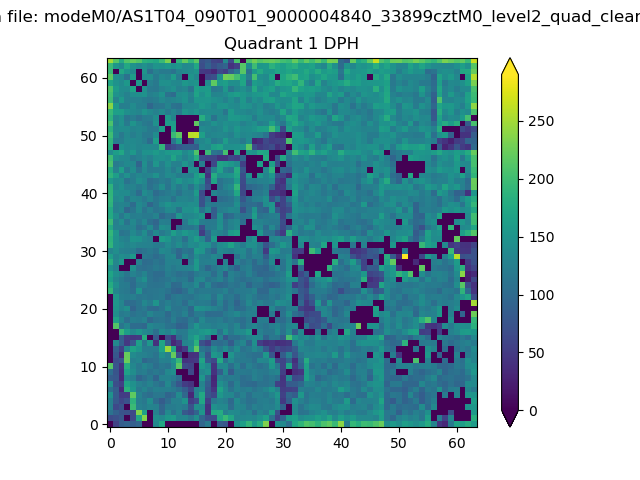 |
Quadrant B |
|---|---|---|---|
| Quadrant D | 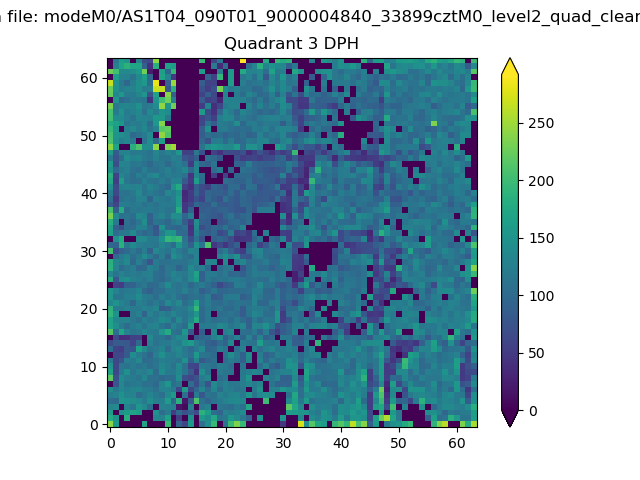 |
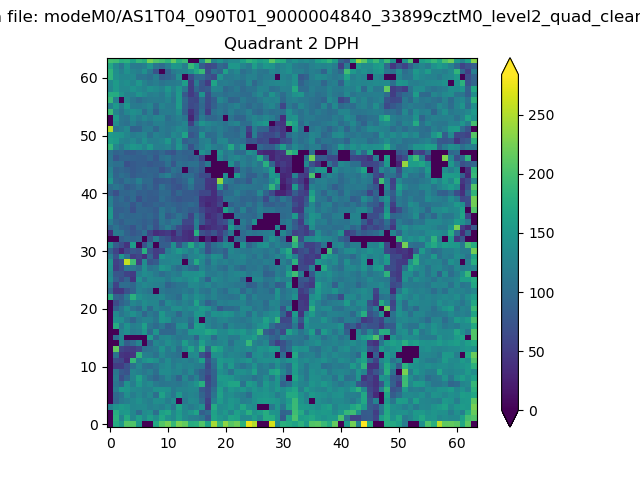 |
Quadrant C |
| Plot type | Count rate plots | Images |
|---|---|---|
| Comparison with Poisson distribution Blue bars denote a histogram of data divided into 1 sec bins. Red curve is a Poisson curve with rate = median count rate of data. |
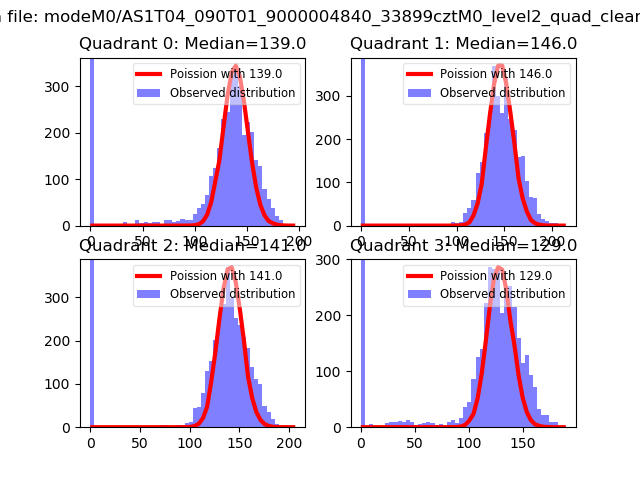 |
 |
| Quadrant-wise count rates Data is divided into 100 sec bins |
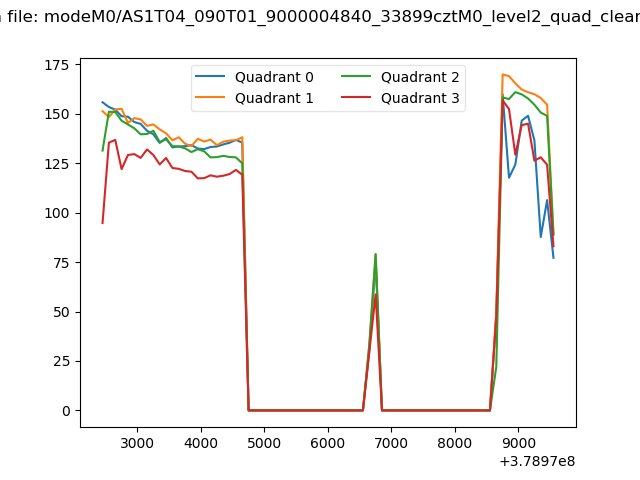 |
|
| Module-wise count rates for Quadrant A Data is divided into 100 sec bins |
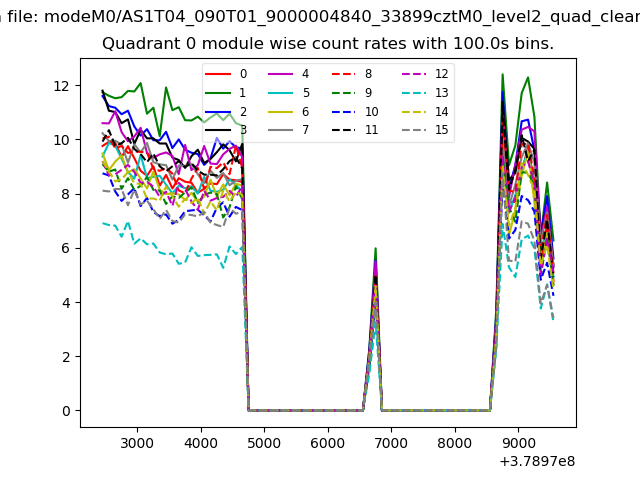 |
 |
| Module-wise count rates for Quadrant B Data is divided into 100 sec bins |
 |
 |
| Module-wise count rates for Quadrant C Data is divided into 100 sec bins |
 |
 |
| Module-wise count rates for Quadrant D Data is divided into 100 sec bins |
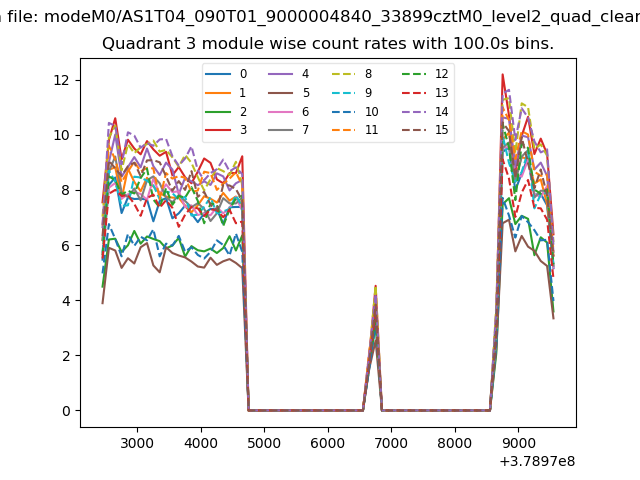 |
 |
| Parameter | Plot |
|---|---|
| CZT HV Monitor | 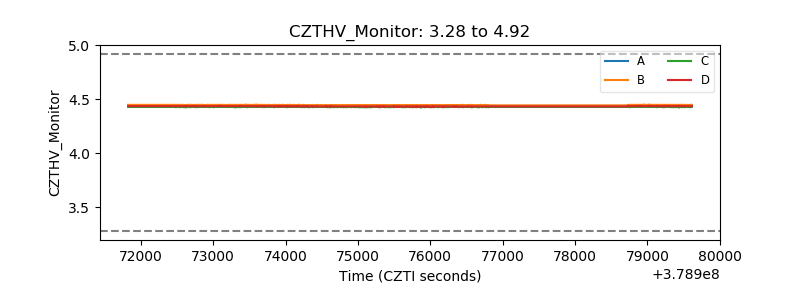 |
| D_VDD | 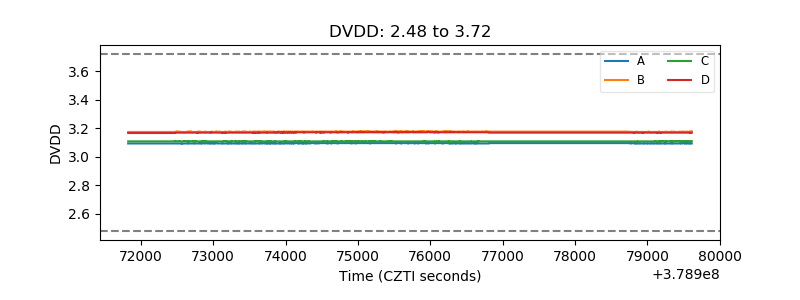 |
| Temperature 1 | 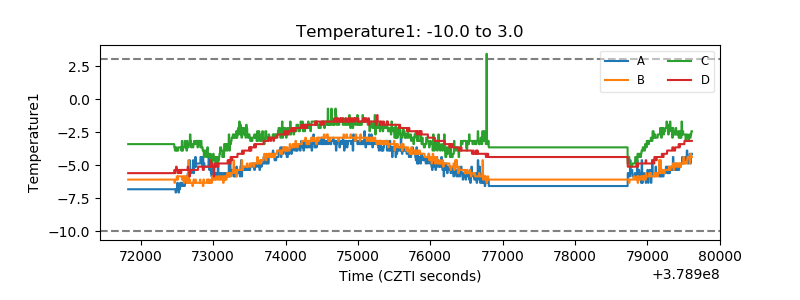 |
| Veto HV Monitor | 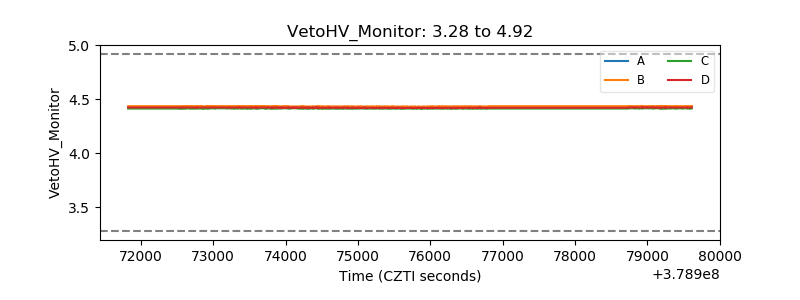 |
| Veto LLD | 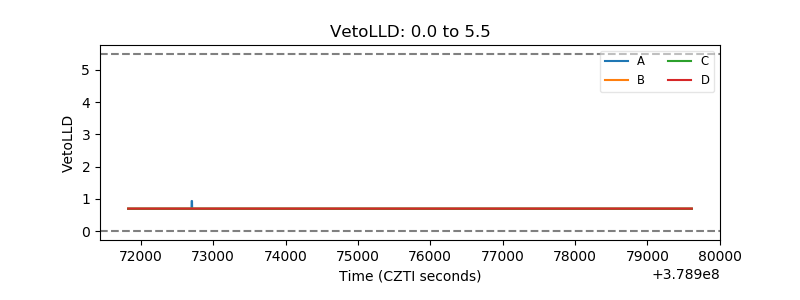 |
| Alpha Counter |  |
| _CPM_Rate |  |
| CZT Counter | 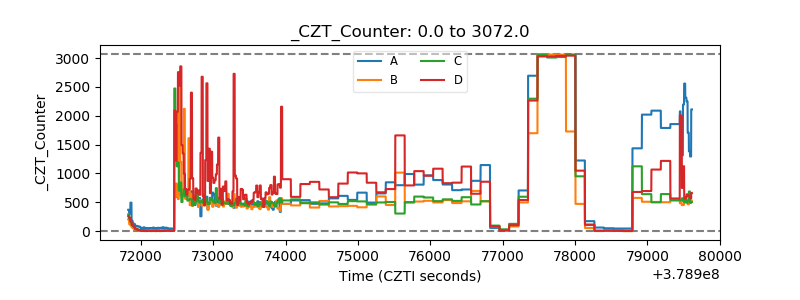 |
| +2.5 Volts monitor |  |
| +5 Volts monitor |  |
| _ROLL_ROT | 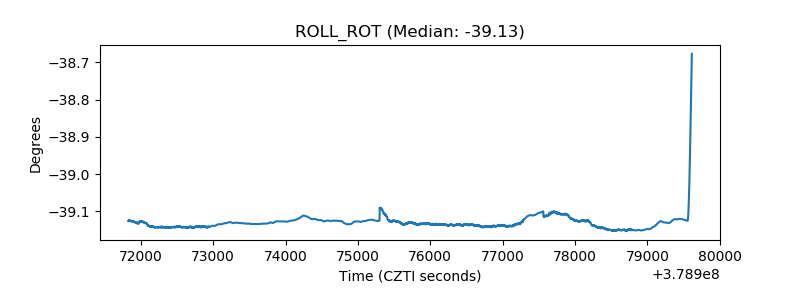 |
| _Roll_DEC | 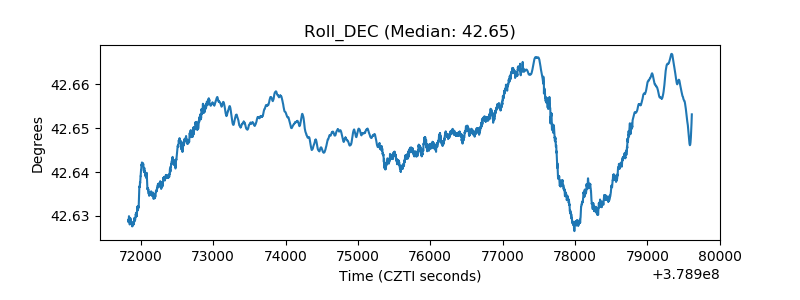 |
| _Roll_RA |  |
| Veto Counter | 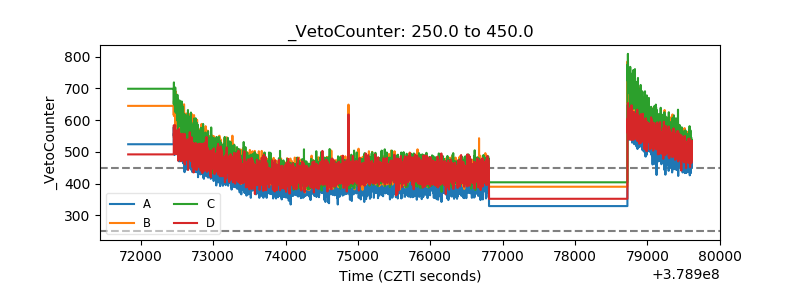 |