| Param | Original file | Final file |
|---|---|---|
| Filename | modeM0/AS1T04_090T01_9000004840_33901cztM0_level2.evt | modeM0/AS1T04_090T01_9000004840_33901cztM0_level2_quad_clean.evt |
| Size (bytes) | 477,241,920 | 70,796,160 |
| Size | 455.1 MB | 67.5 MB |
| Events in quadrant A | 2,661,225 | 461,148 |
| Events in quadrant B | 3,153,869 | 462,931 |
| Events in quadrant C | 3,131,600 | 447,515 |
| Events in quadrant D | 5,168,799 | 422,811 |
| Mode M9 | |||
|---|---|---|---|
| Quadrant | BADHDUFLAG | Total packets | Discarded packets |
| A | 0 | 21 | 0 |
| B | 0 | 21 | 0 |
| C | 0 | 21 | 0 |
| D | 0 | 21 | 0 |
| Mode M0 | |||
|---|---|---|---|
| Quadrant | BADHDUFLAG | Total packets | Discarded packets |
| A | 0 | 10596 | 3 |
| B | 0 | 12313 | 2 |
| C | 0 | 12106 | 2 |
| D | 0 | 18749 | 2 |
| Mode SS | |||
|---|---|---|---|
| Quadrant | BADHDUFLAG | Total packets | Discarded packets |
| A | 0 | 102 | 0 |
| B | 0 | 102 | 0 |
| C | 0 | 102 | 0 |
| D | 0 | 102 | 0 |
| Quadrant | Total seconds | Saturated seconds | Saturation percentage |
|---|---|---|---|
| A | 4981 | 79 | 1.586027% |
| B | 4981 | 134 | 2.690223% |
| C | 4981 | 118 | 2.369002% |
| D | 4981 | 656 | 13.170046% |
Noise dominated data is calculated using 1-second bins in cleaned event files. If a bin has >2000 counts, and if more than 50% of those come from <1% of pixels, then it is considered to be noise-dominated and hence unusable.
| Quadrant | # 1 sec bins | Bins with >0 counts | Bins with >2000 counts | High rate bins dominated by noise | Noise dominated (total time) | Noise dominated (detector-on time) | Marked lightcurve |
|---|---|---|---|---|---|---|---|
| A | 7073 | 4982 | 60 | 60 | 0.85% | 1.20% | 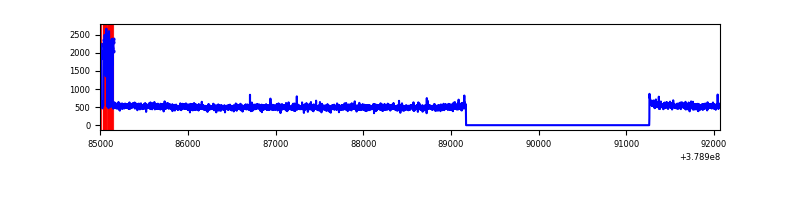 |
| B | 7073 | 4982 | 73 | 73 | 1.03% | 1.47% | 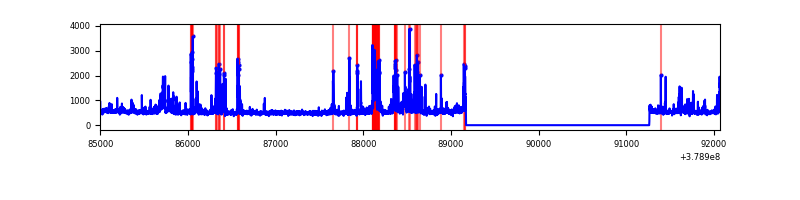 |
| C | 7073 | 4982 | 88 | 88 | 1.24% | 1.77% | 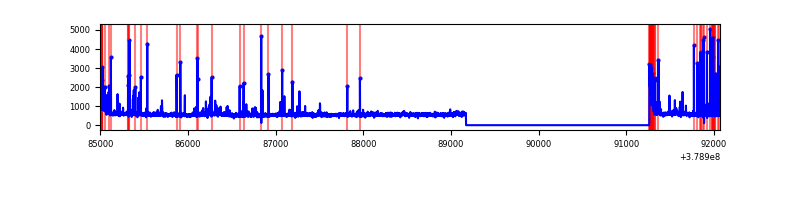 |
| D | 7073 | 4982 | 551 | 551 | 7.79% | 11.06% | 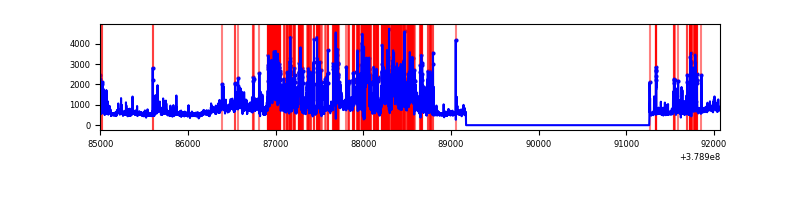 |
Top three noisy pixels from each quadrant. If the there are fewer than three noisy pixels in the level2.evt file, extra rows are filled as -1
| Pixel properties | Quadrant properties | ||||||
|---|---|---|---|---|---|---|---|
| Quadrant | DetID | PixID | Counts | Sigma | Mean | Median | Sigma |
| A | 15 | 169 | 165403 | 1293.57 | 642 | 629 | 127.4 |
| A | 10 | 83 | 11053 | 81.83 | 642 | 629 | 127.4 |
| A | 13 | 254 | 6949 | 49.62 | 642 | 629 | 127.4 |
| B | 5 | 172 | 441815 | 3759.43 | 627 | 614 | 117.4 |
| B | 15 | 222 | 105978 | 897.8 | 627 | 614 | 117.4 |
| B | 4 | 232 | 28607 | 238.53 | 627 | 614 | 117.4 |
| C | 0 | 10 | 438999 | 3119.76 | 615 | 621 | 140.5 |
| C | 15 | 214 | 218913 | 1553.5 | 615 | 621 | 140.5 |
| C | 14 | 67 | 24174 | 167.62 | 615 | 621 | 140.5 |
| D | 12 | 235 | 1451589 | 10098.28 | 593 | 577 | 143.7 |
| D | 8 | 195 | 477394 | 3318.39 | 593 | 577 | 143.7 |
| D | 1 | 52 | 268234 | 1862.75 | 593 | 577 | 143.7 |
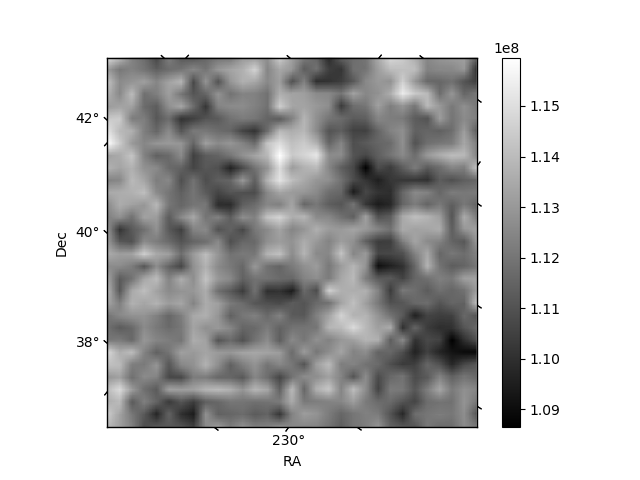
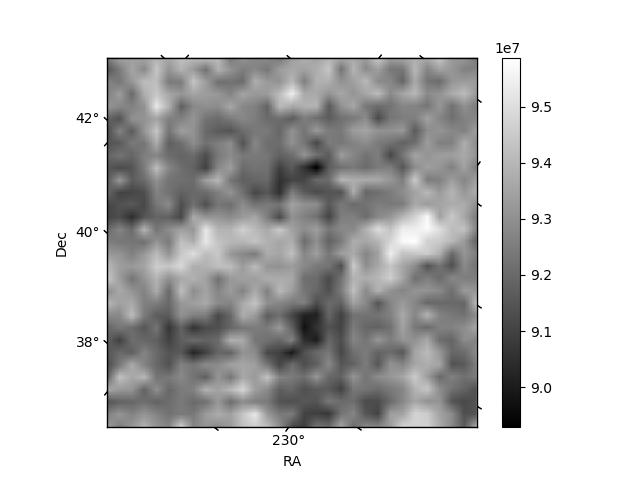
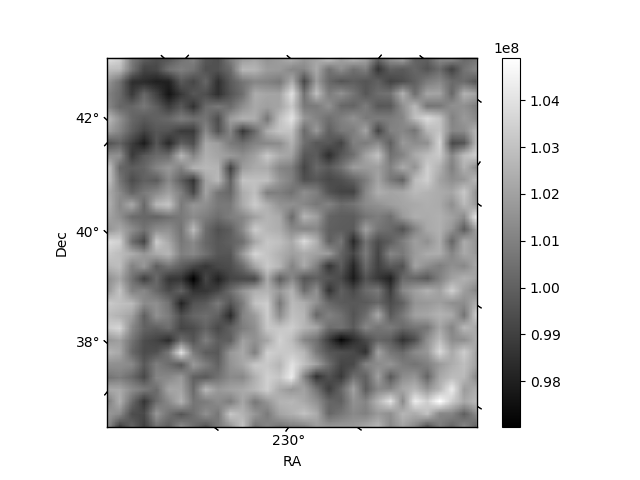
Histogram calculated using DETX and DETY for each event in the final _common_clean file
| Quadrant A | 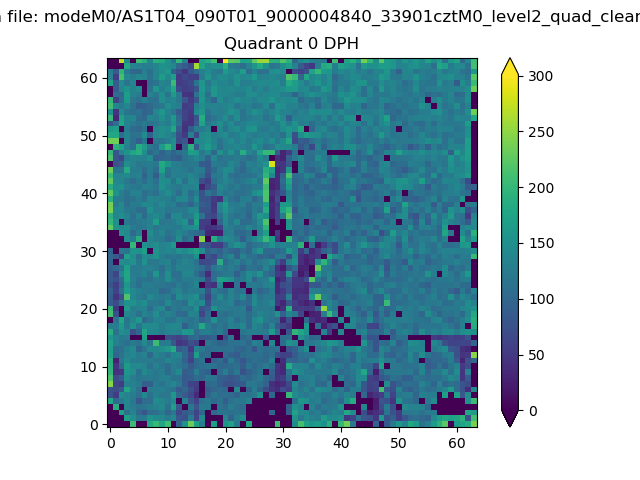 |
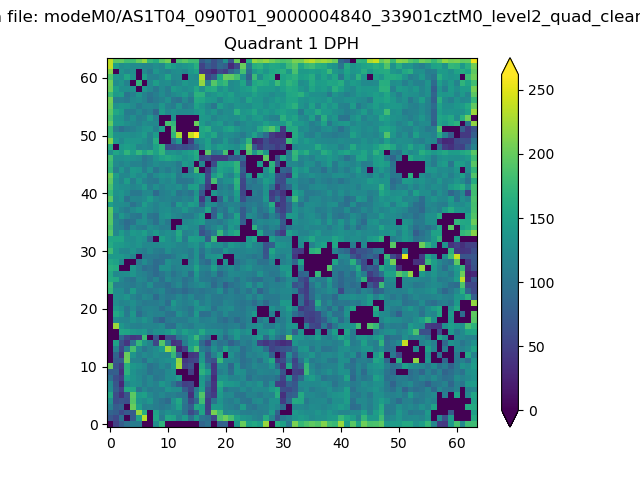 |
Quadrant B |
|---|---|---|---|
| Quadrant D |  |
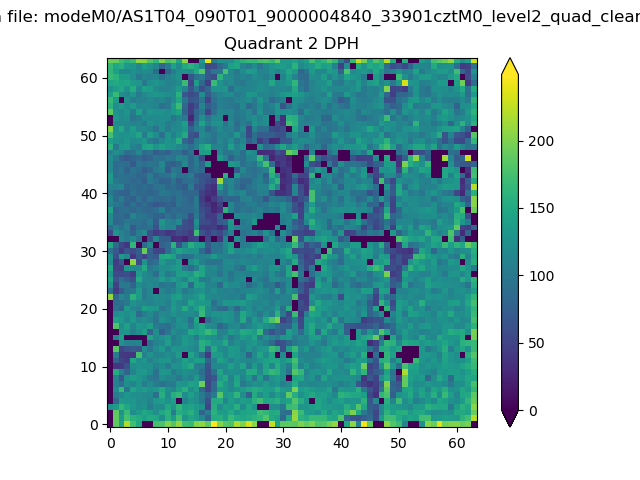 |
Quadrant C |
| Plot type | Count rate plots | Images |
|---|---|---|
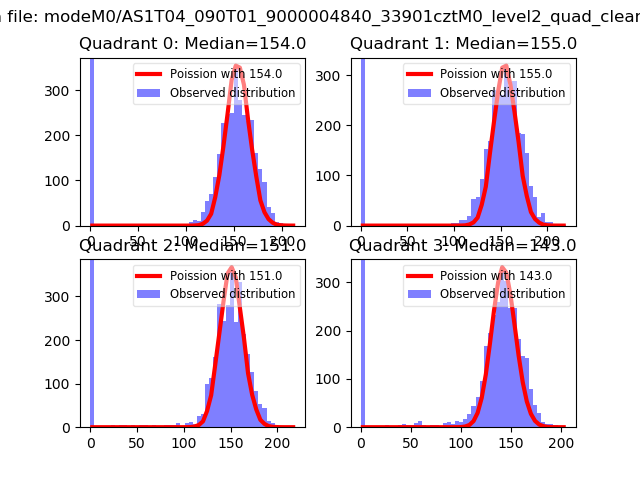
| Comparison with Poisson distribution Blue bars denote a histogram of data divided into 1 sec bins. Red curve is a Poisson curve with rate = median count rate of data. |
 |
 |
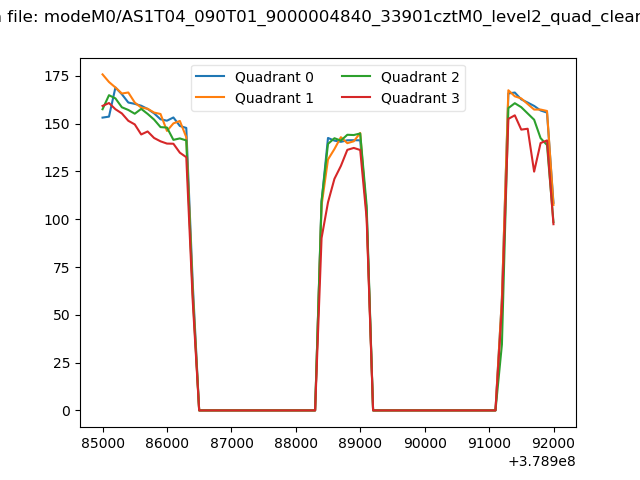
| Quadrant-wise count rates Data is divided into 100 sec bins |
 |
|
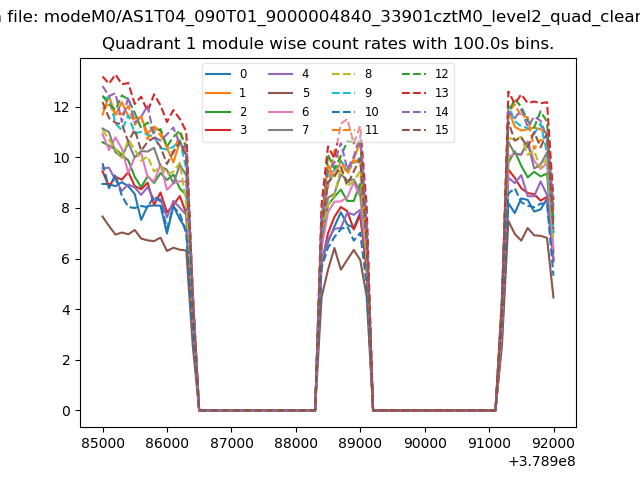
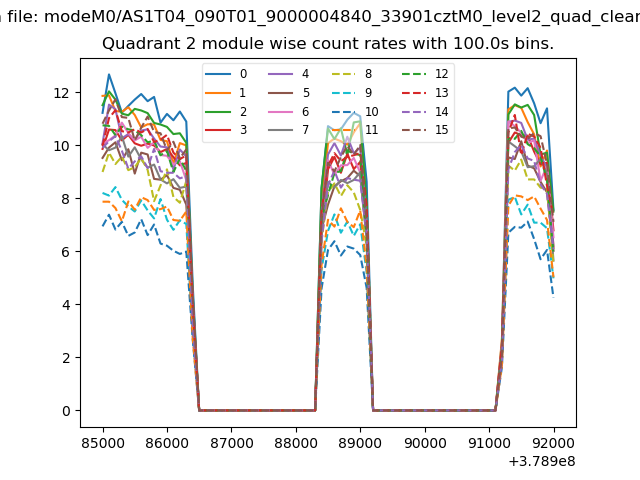
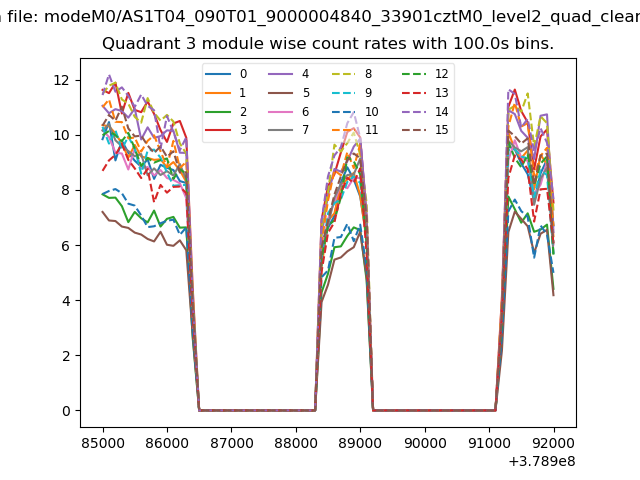
| Module-wise count rates for Quadrant A Data is divided into 100 sec bins |
 |
 |
| Module-wise count rates for Quadrant B Data is divided into 100 sec bins |
 |
 |
| Module-wise count rates for Quadrant C Data is divided into 100 sec bins |
 |
 |
| Module-wise count rates for Quadrant D Data is divided into 100 sec bins |
 |
 |
| Parameter | Plot |
|---|---|
| CZT HV Monitor | 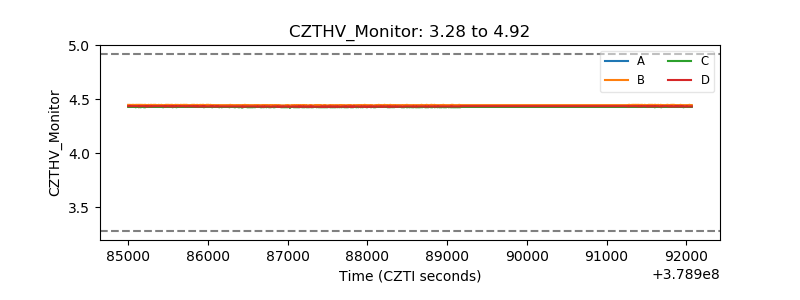 |
| D_VDD | 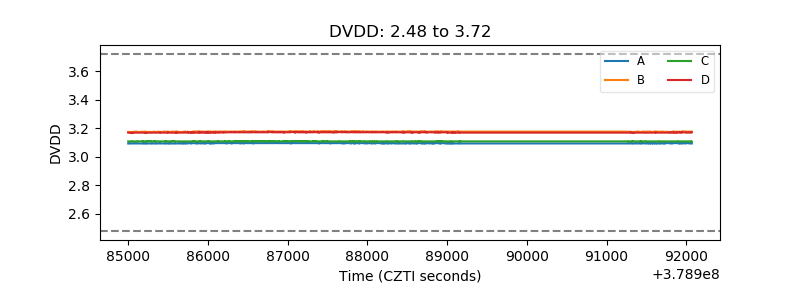 |
| Temperature 1 | 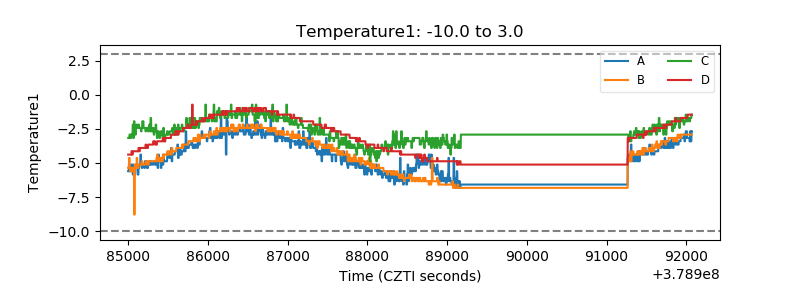 |
| Veto HV Monitor | 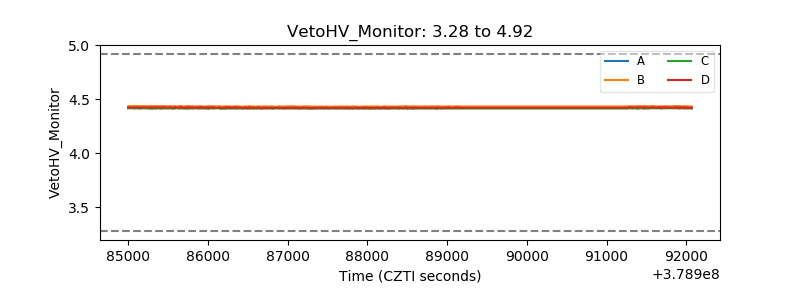 |
| Veto LLD | 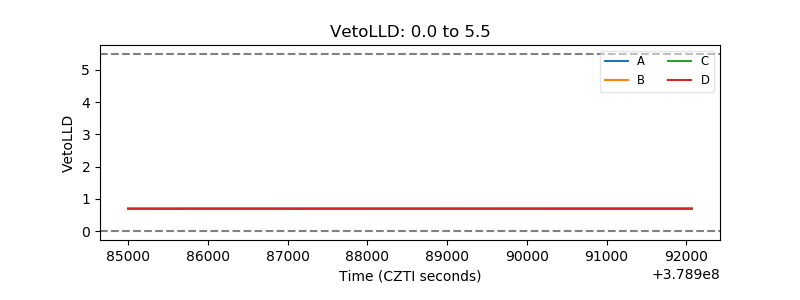 |
| Alpha Counter | 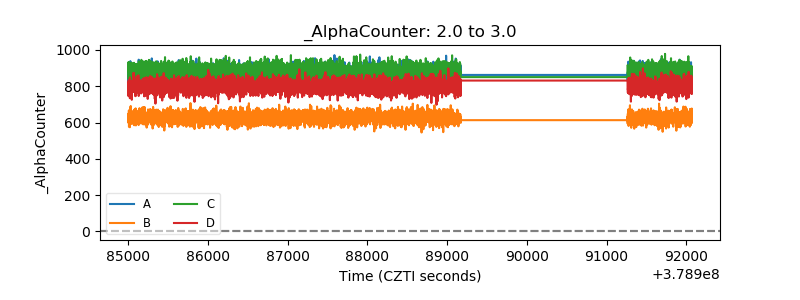 |
| _CPM_Rate | 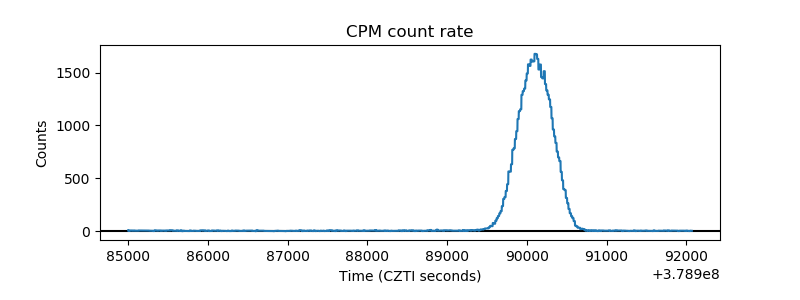 |
| CZT Counter | 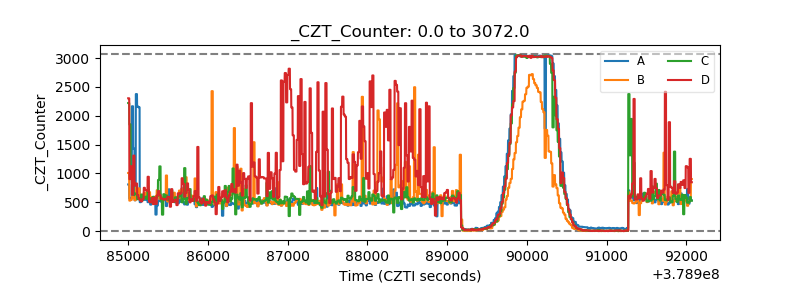 |
| +2.5 Volts monitor |  |
| +5 Volts monitor |  |
| _ROLL_ROT | 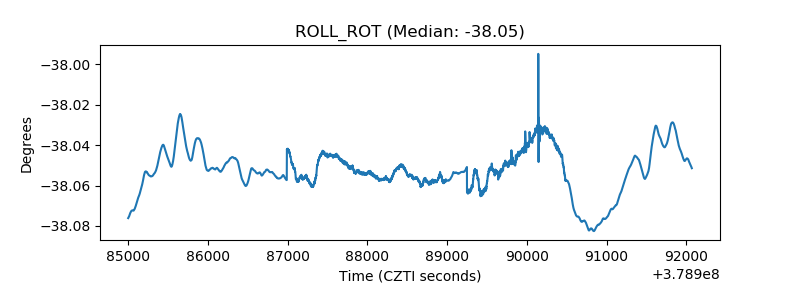 |
| _Roll_DEC | 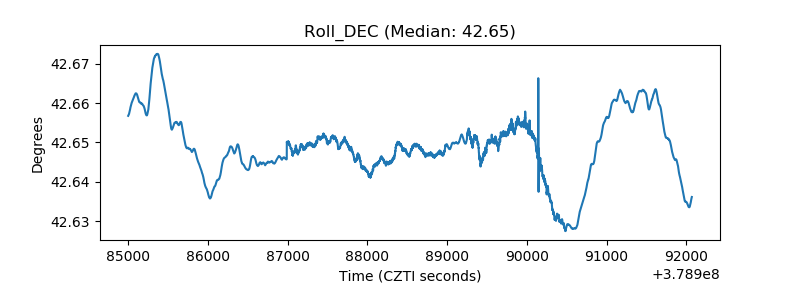 |
| _Roll_RA | 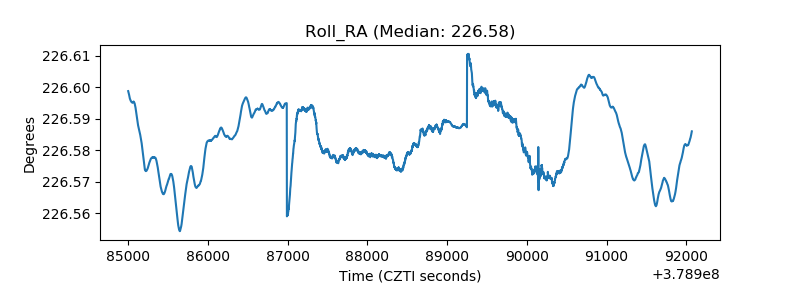 |
| Veto Counter | 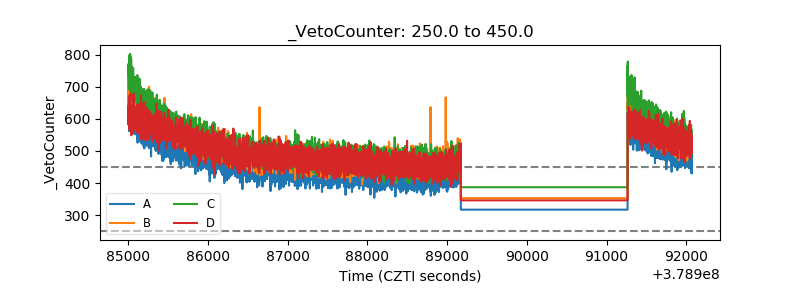 |