| Param | Original file | Final file |
|---|---|---|
| Filename | modeM0/AS1T04_090T01_9000004840_33902cztM0_level2.evt | modeM0/AS1T04_090T01_9000004840_33902cztM0_level2_quad_clean.evt |
| Size (bytes) | 463,749,120 | 63,745,920 |
| Size | 442.3 MB | 60.8 MB |
| Events in quadrant A | 2,758,101 | 409,564 |
| Events in quadrant B | 3,325,346 | 405,914 |
| Events in quadrant C | 3,018,286 | 395,166 |
| Events in quadrant D | 4,613,995 | 378,964 |
| Mode M9 | |||
|---|---|---|---|
| Quadrant | BADHDUFLAG | Total packets | Discarded packets |
| A | 0 | 23 | 0 |
| B | 0 | 23 | 0 |
| C | 0 | 23 | 0 |
| D | 0 | 24 | 0 |
| Mode M0 | |||
|---|---|---|---|
| Quadrant | BADHDUFLAG | Total packets | Discarded packets |
| A | 0 | 10968 | 3 |
| B | 0 | 12720 | 2 |
| C | 0 | 11684 | 2 |
| D | 0 | 17052 | 2 |
| Mode SS | |||
|---|---|---|---|
| Quadrant | BADHDUFLAG | Total packets | Discarded packets |
| A | 0 | 98 | 0 |
| B | 0 | 98 | 0 |
| C | 0 | 98 | 0 |
| D | 0 | 98 | 0 |
| Quadrant | Total seconds | Saturated seconds | Saturation percentage |
|---|---|---|---|
| A | 4856 | 87 | 1.791598% |
| B | 4856 | 336 | 6.919275% |
| C | 4856 | 130 | 2.677100% |
| D | 4856 | 277 | 5.704283% |
Noise dominated data is calculated using 1-second bins in cleaned event files. If a bin has >2000 counts, and if more than 50% of those come from <1% of pixels, then it is considered to be noise-dominated and hence unusable.
| Quadrant | # 1 sec bins | Bins with >0 counts | Bins with >2000 counts | High rate bins dominated by noise | Noise dominated (total time) | Noise dominated (detector-on time) | Marked lightcurve |
|---|---|---|---|---|---|---|---|
| A | 6978 | 4856 | 46 | 46 | 0.66% | 0.95% | 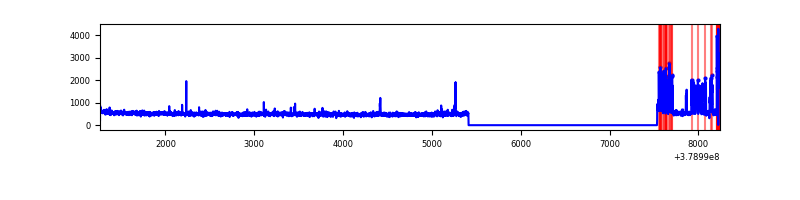 |
| B | 6979 | 4857 | 232 | 232 | 3.32% | 4.78% | 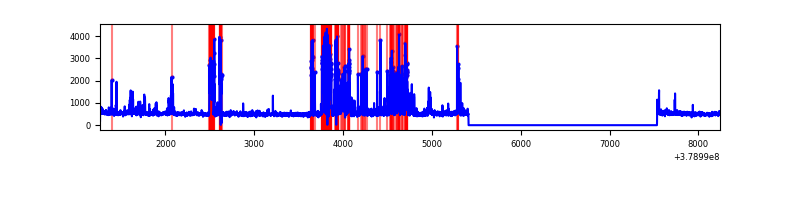 |
| C | 6979 | 4857 | 93 | 93 | 1.33% | 1.91% | 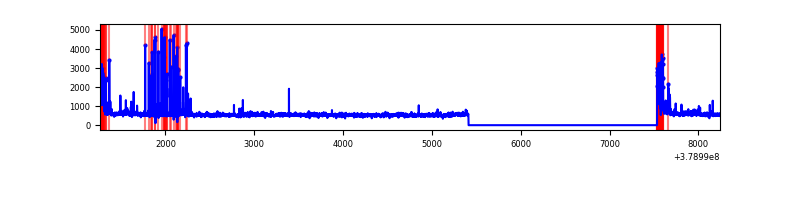 |
| D | 6979 | 4857 | 263 | 263 | 3.77% | 5.41% |  |
Top three noisy pixels from each quadrant. If the there are fewer than three noisy pixels in the level2.evt file, extra rows are filled as -1
| Pixel properties | Quadrant properties | ||||||
|---|---|---|---|---|---|---|---|
| Quadrant | DetID | PixID | Counts | Sigma | Mean | Median | Sigma |
| A | 15 | 169 | 358765 | 2949.5 | 614 | 603 | 121.4 |
| A | 13 | 6 | 12989 | 102.0 | 614 | 603 | 121.4 |
| A | 10 | 83 | 11556 | 90.2 | 614 | 603 | 121.4 |
| B | 5 | 172 | 942589 | 8587.64 | 583 | 568 | 109.7 |
| B | 4 | 232 | 27272 | 243.44 | 583 | 568 | 109.7 |
| B | 4 | 170 | 14844 | 130.14 | 583 | 568 | 109.7 |
| C | 0 | 10 | 431696 | 3190.1 | 589 | 595 | 135.1 |
| C | 15 | 214 | 210874 | 1556.04 | 589 | 595 | 135.1 |
| C | 14 | 67 | 42669 | 311.34 | 589 | 595 | 135.1 |
| D | 8 | 195 | 787776 | 5447.35 | 592 | 576 | 144.5 |
| D | 1 | 52 | 457649 | 3162.9 | 592 | 576 | 144.5 |
| D | 13 | 249 | 363274 | 2509.83 | 592 | 576 | 144.5 |
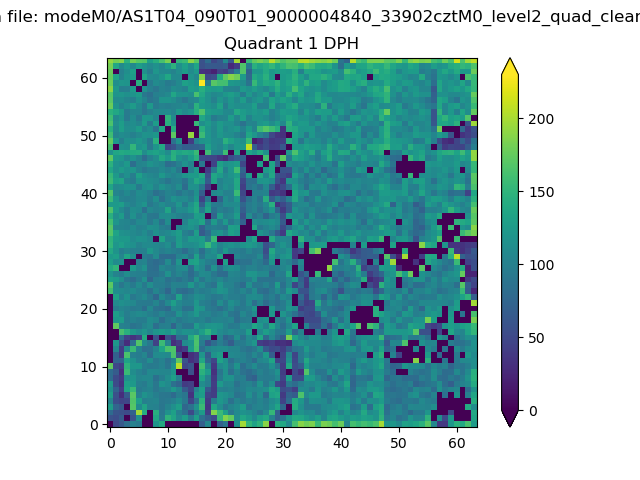
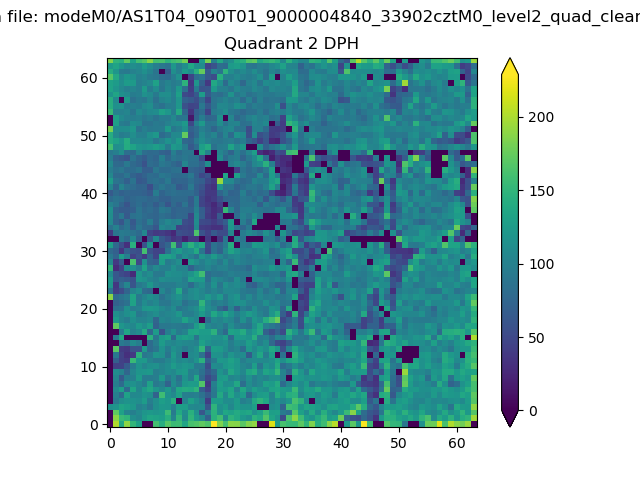
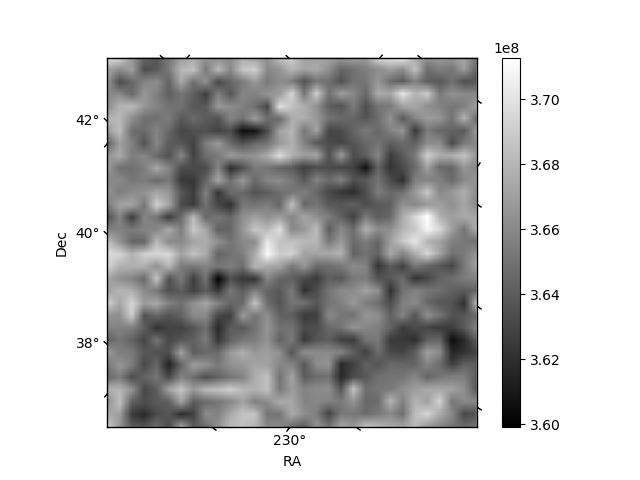
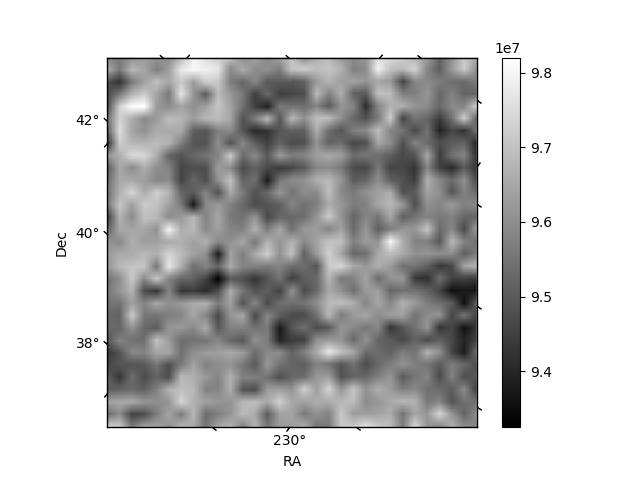
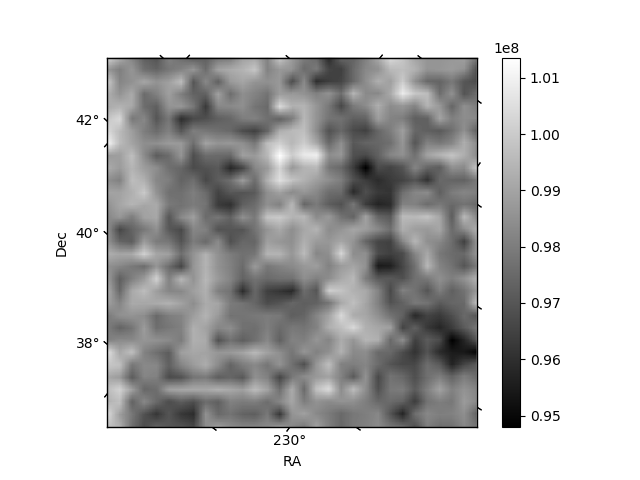
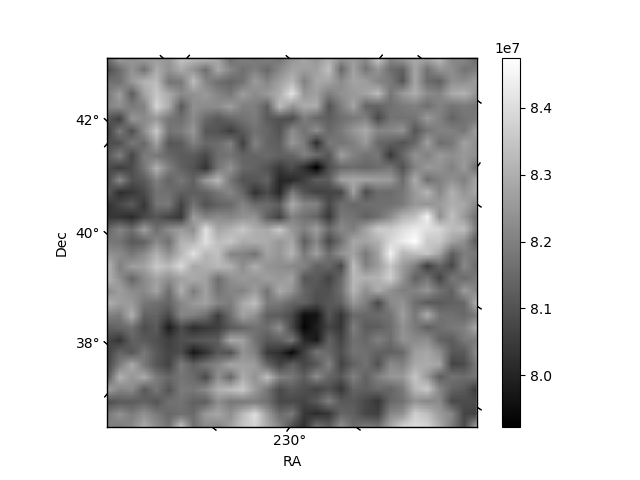
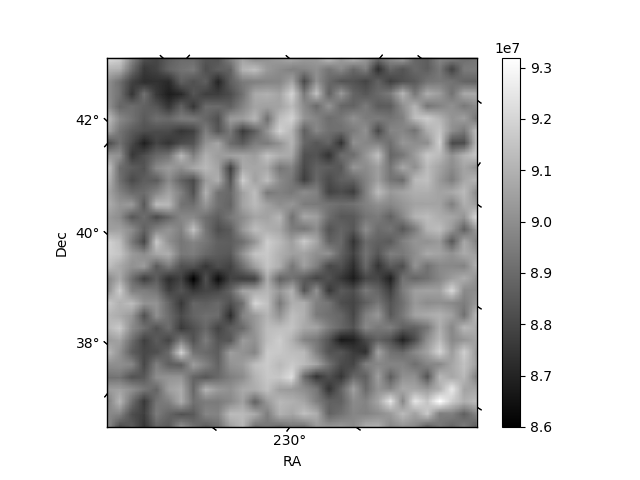
Histogram calculated using DETX and DETY for each event in the final _common_clean file
| Quadrant A | 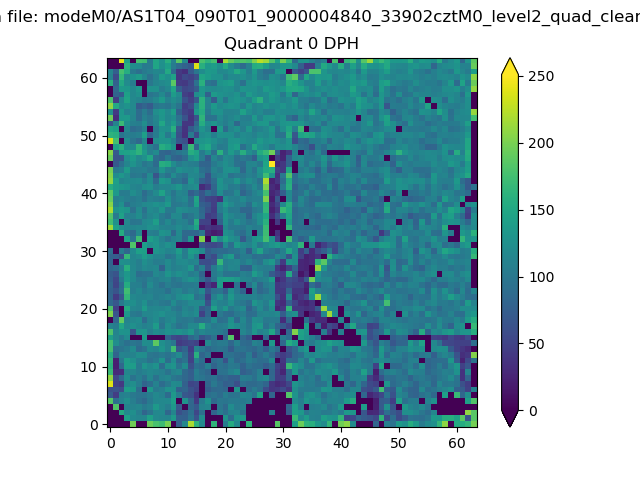 |
 |
Quadrant B |
|---|---|---|---|
| Quadrant D | 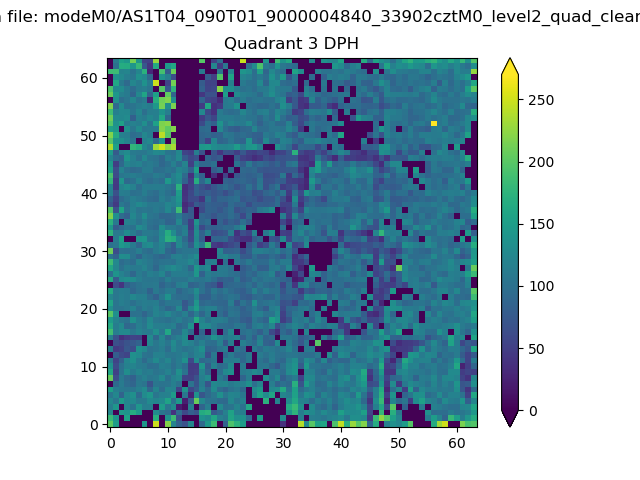 |
 |
Quadrant C |
| Plot type | Count rate plots | Images |
|---|---|---|
| Comparison with Poisson distribution Blue bars denote a histogram of data divided into 1 sec bins. Red curve is a Poisson curve with rate = median count rate of data. |
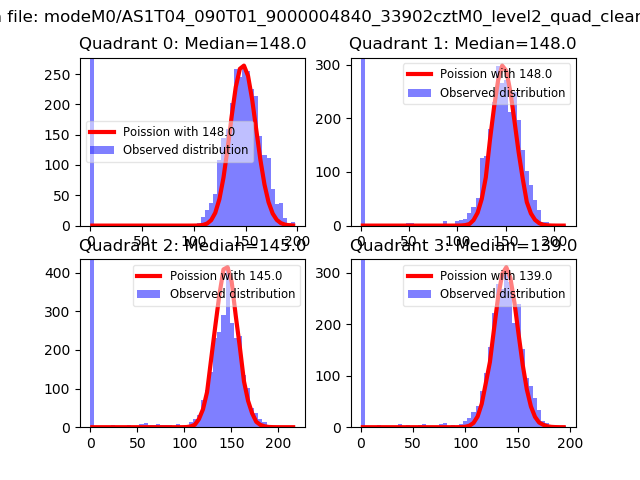 |
 |
| Quadrant-wise count rates Data is divided into 100 sec bins |
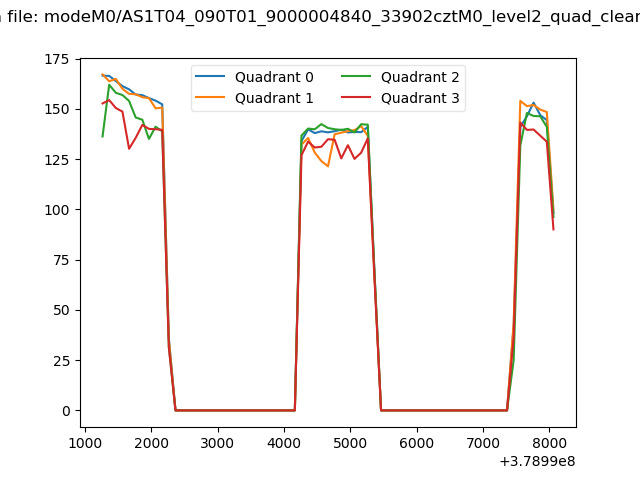 |
|
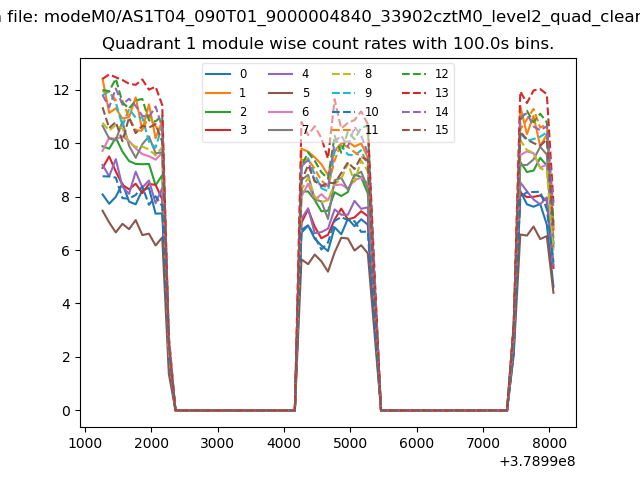
| Module-wise count rates for Quadrant A Data is divided into 100 sec bins |
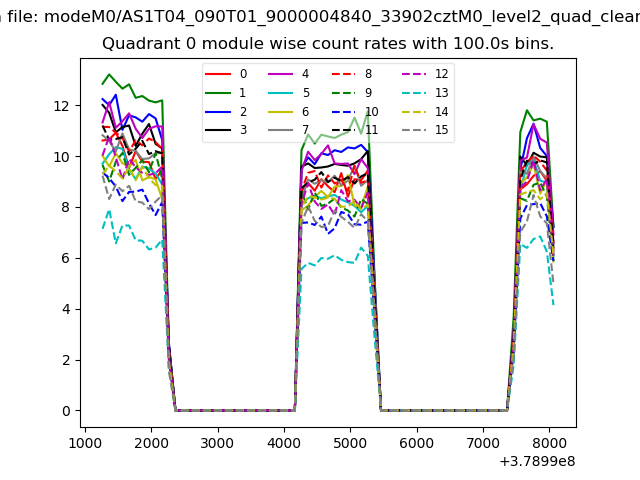 |
 |
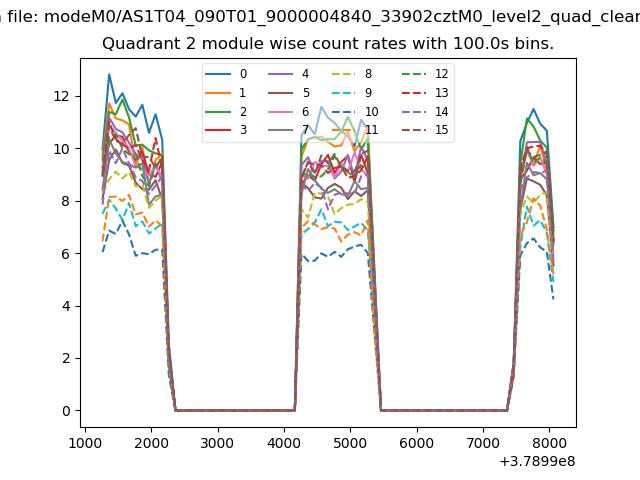
| Module-wise count rates for Quadrant B Data is divided into 100 sec bins |
 |
 |
| Module-wise count rates for Quadrant C Data is divided into 100 sec bins |
 |
 |
| Module-wise count rates for Quadrant D Data is divided into 100 sec bins |
 |
 |
| Parameter | Plot |
|---|---|
| CZT HV Monitor |  |
| D_VDD | 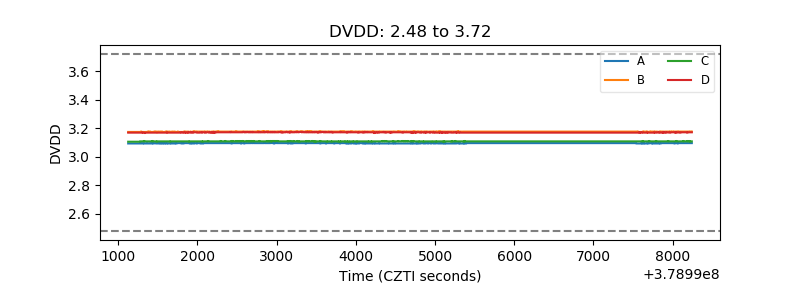 |
| Temperature 1 | 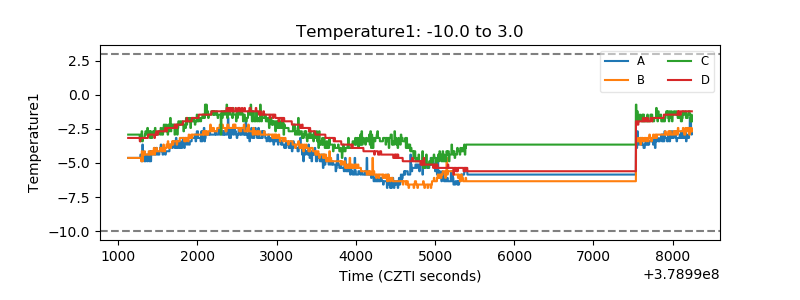 |
| Veto HV Monitor | 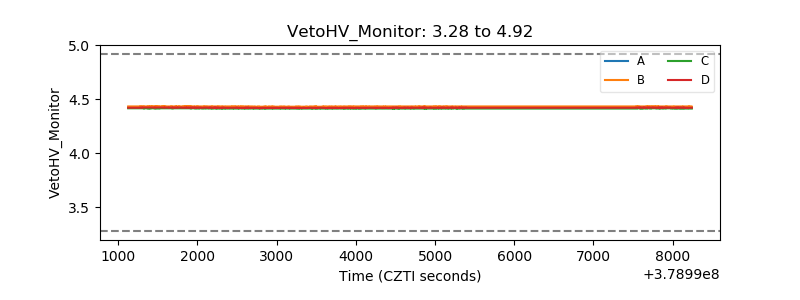 |
| Veto LLD | 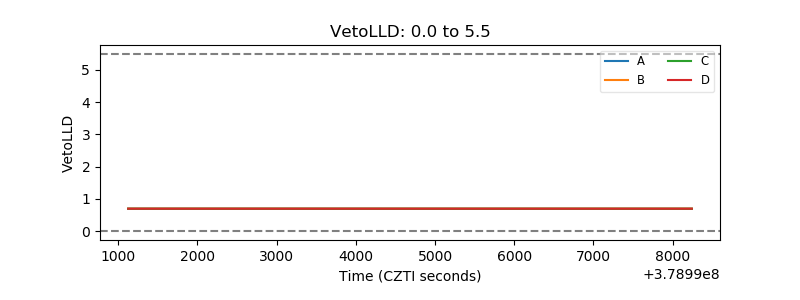 |
| Alpha Counter | 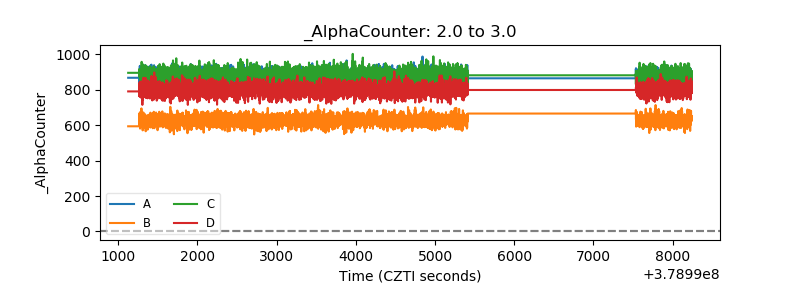 |
| _CPM_Rate | 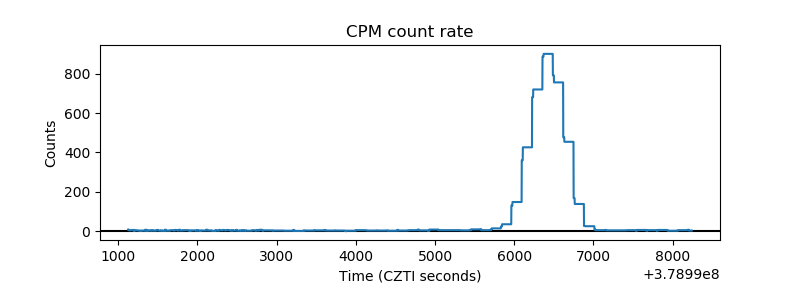 |
| CZT Counter | 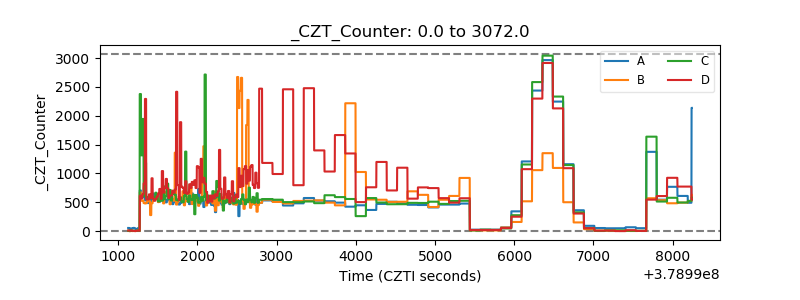 |
| +2.5 Volts monitor |  |
| +5 Volts monitor |  |
| _ROLL_ROT |  |
| _Roll_DEC | 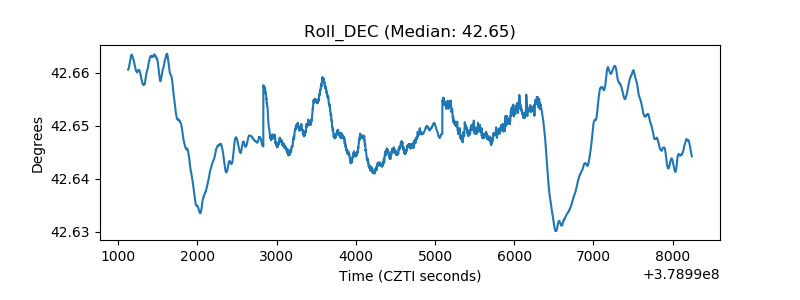 |
| _Roll_RA | 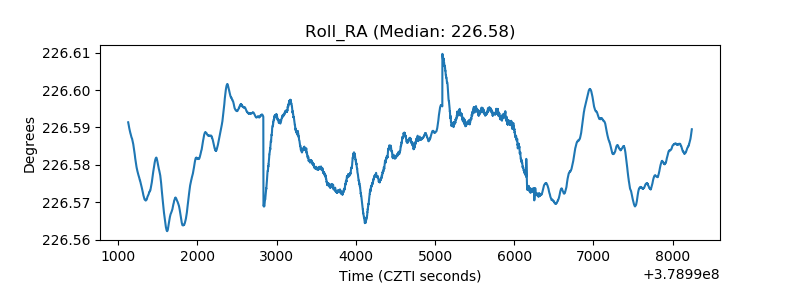 |
| Veto Counter | 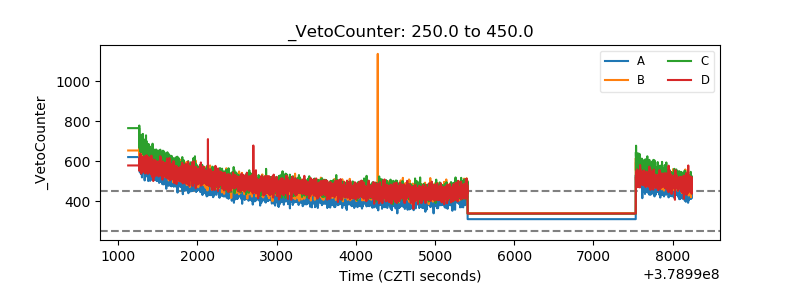 |