| Param | Original file | Final file |
|---|---|---|
| Filename | modeM0/AS1T04_090T01_9000004840_33904cztM0_level2.evt | modeM0/AS1T04_090T01_9000004840_33904cztM0_level2_quad_clean.evt |
| Size (bytes) | 540,682,560 | 53,752,320 |
| Size | 515.6 MB | 51.3 MB |
| Events in quadrant A | 3,275,051 | 322,941 |
| Events in quadrant B | 3,637,694 | 317,488 |
| Events in quadrant C | 3,205,867 | 314,565 |
| Events in quadrant D | 5,898,546 | 302,276 |
| Mode M9 | |||
|---|---|---|---|
| Quadrant | BADHDUFLAG | Total packets | Discarded packets |
| A | 0 | 21 | 0 |
| B | 0 | 21 | 0 |
| C | 0 | 21 | 0 |
| D | 0 | 22 | 0 |
| Mode M0 | |||
|---|---|---|---|
| Quadrant | BADHDUFLAG | Total packets | Discarded packets |
| A | 0 | 13229 | 3 |
| B | 0 | 14158 | 2 |
| C | 0 | 12529 | 2 |
| D | 0 | 21213 | 2 |
| Mode SS | |||
|---|---|---|---|
| Quadrant | BADHDUFLAG | Total packets | Discarded packets |
| A | 0 | 108 | 0 |
| B | 0 | 108 | 0 |
| C | 0 | 108 | 0 |
| D | 0 | 108 | 0 |
| Quadrant | Total seconds | Saturated seconds | Saturation percentage |
|---|---|---|---|
| A | 5282 | 228 | 4.316547% |
| B | 5282 | 307 | 5.812192% |
| C | 5282 | 153 | 2.896630% |
| D | 5282 | 509 | 9.636501% |
Noise dominated data is calculated using 1-second bins in cleaned event files. If a bin has >2000 counts, and if more than 50% of those come from <1% of pixels, then it is considered to be noise-dominated and hence unusable.
| Quadrant | # 1 sec bins | Bins with >0 counts | Bins with >2000 counts | High rate bins dominated by noise | Noise dominated (total time) | Noise dominated (detector-on time) | Marked lightcurve |
|---|---|---|---|---|---|---|---|
| A | 7105 | 5283 | 178 | 178 | 2.51% | 3.37% | 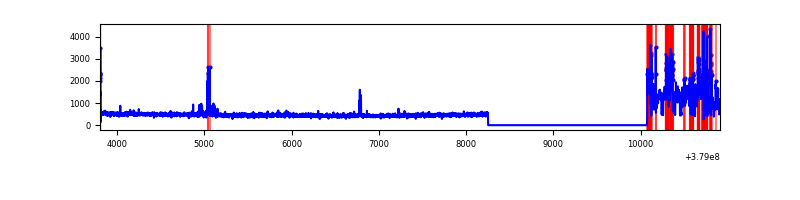 |
| B | 7105 | 5283 | 179 | 179 | 2.52% | 3.39% | 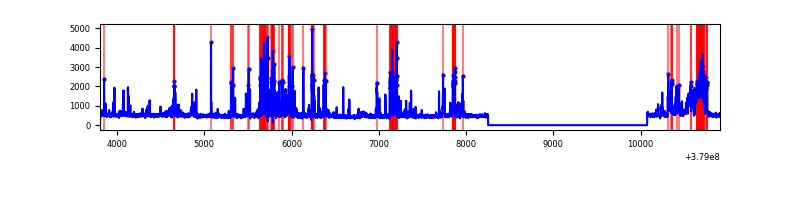 |
| C | 7105 | 5283 | 100 | 100 | 1.41% | 1.89% | 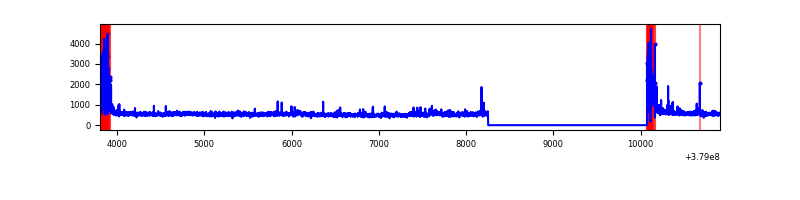 |
| D | 7105 | 5283 | 450 | 450 | 6.33% | 8.52% | 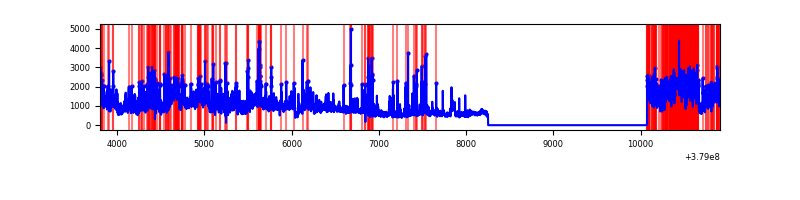 |
Top three noisy pixels from each quadrant. If the there are fewer than three noisy pixels in the level2.evt file, extra rows are filled as -1
| Pixel properties | Quadrant properties | ||||||
|---|---|---|---|---|---|---|---|
| Quadrant | DetID | PixID | Counts | Sigma | Mean | Median | Sigma |
| A | 15 | 169 | 845341 | 6964.71 | 610 | 597 | 121.3 |
| A | 7 | 16 | 49855 | 406.12 | 610 | 597 | 121.3 |
| A | 13 | 6 | 11827 | 92.59 | 610 | 597 | 121.3 |
| B | 5 | 172 | 1109974 | 9592.72 | 606 | 590 | 115.6 |
| B | 4 | 170 | 30558 | 259.13 | 606 | 590 | 115.6 |
| B | 4 | 251 | 29842 | 252.94 | 606 | 590 | 115.6 |
| C | 0 | 10 | 456873 | 3318.59 | 597 | 601 | 137.5 |
| C | 15 | 214 | 228394 | 1656.8 | 597 | 601 | 137.5 |
| C | 3 | 233 | 135623 | 982.05 | 597 | 601 | 137.5 |
| D | 1 | 52 | 2165977 | 14902.91 | 589 | 572 | 145.3 |
| D | 8 | 195 | 751562 | 5168.52 | 589 | 572 | 145.3 |
| D | 13 | 249 | 233624 | 1603.93 | 589 | 572 | 145.3 |
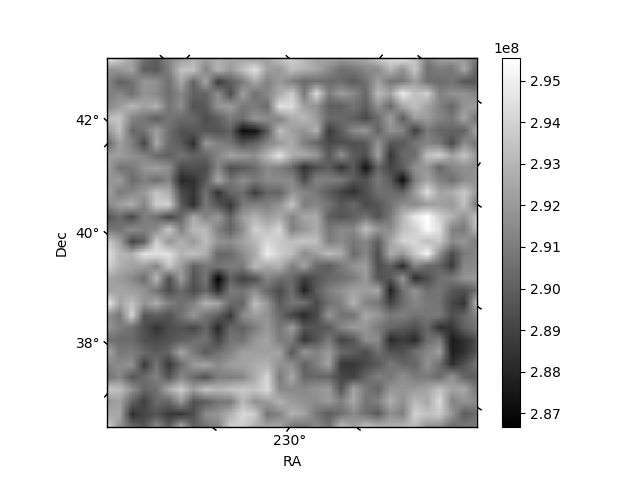
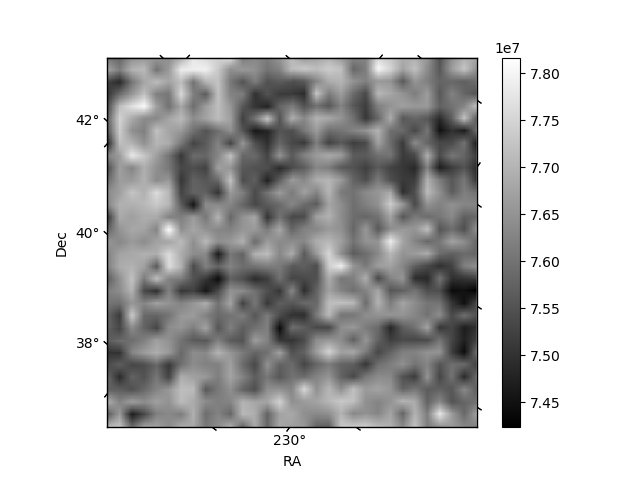
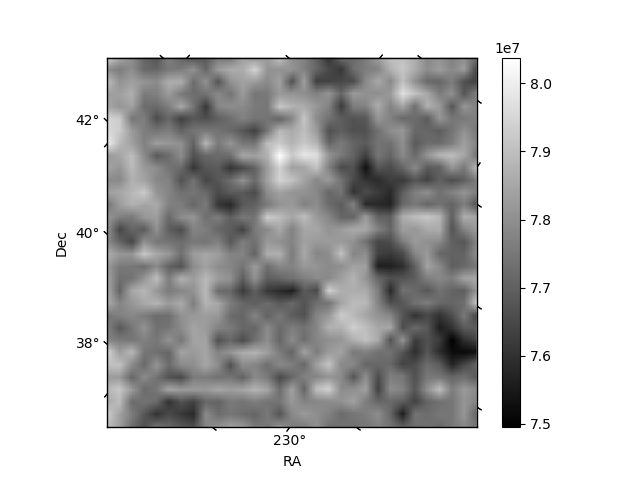
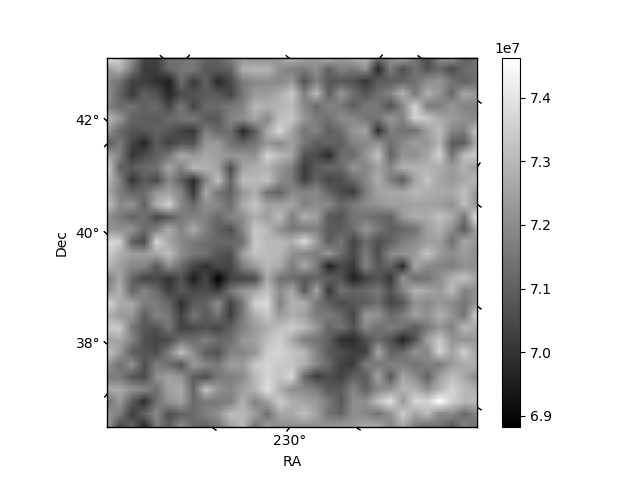
Histogram calculated using DETX and DETY for each event in the final _common_clean file
| Quadrant A | 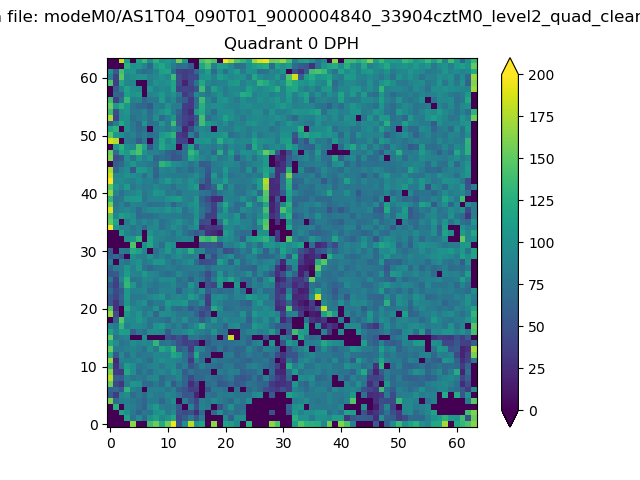 |
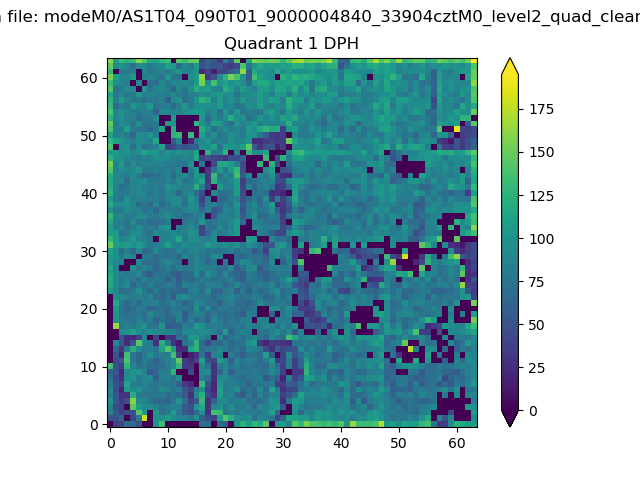 |
Quadrant B |
|---|---|---|---|
| Quadrant D |  |
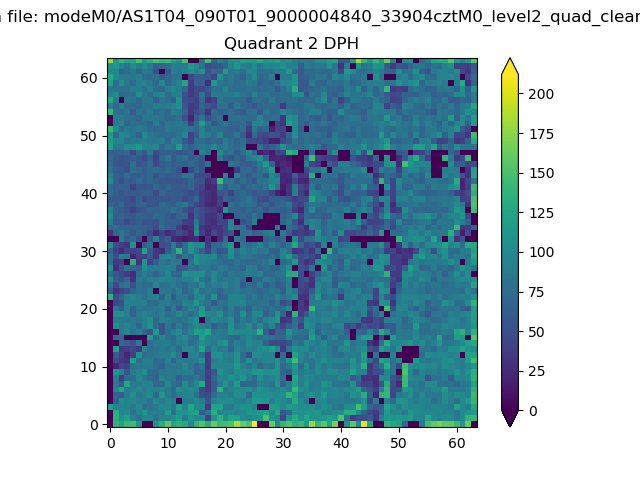 |
Quadrant C |
| Plot type | Count rate plots | Images |
|---|---|---|
| Comparison with Poisson distribution Blue bars denote a histogram of data divided into 1 sec bins. Red curve is a Poisson curve with rate = median count rate of data. |
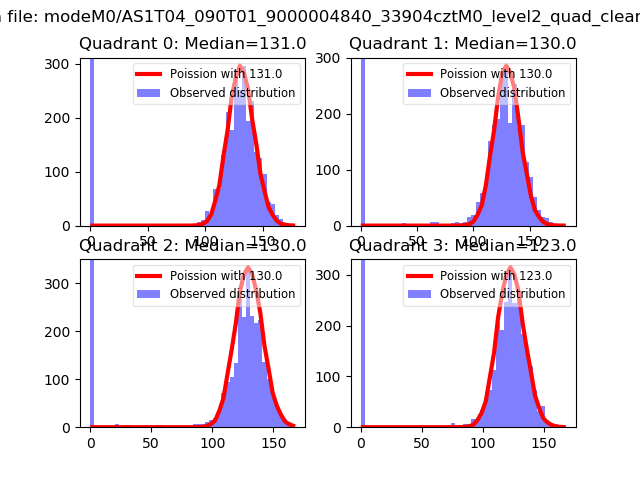 |
 |
| Quadrant-wise count rates Data is divided into 100 sec bins |
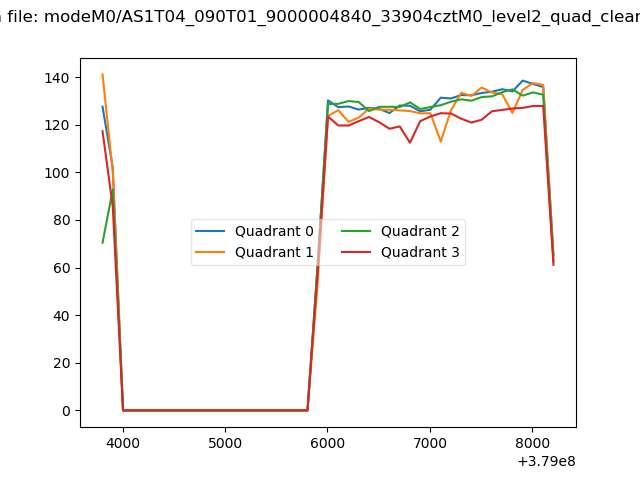 |
|
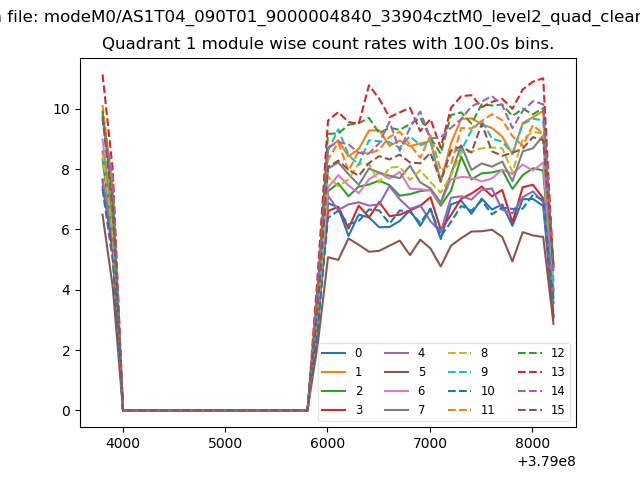
| Module-wise count rates for Quadrant A Data is divided into 100 sec bins |
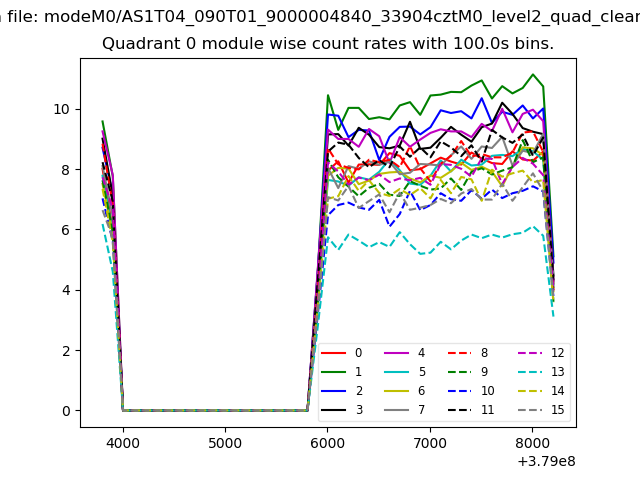 |
 |
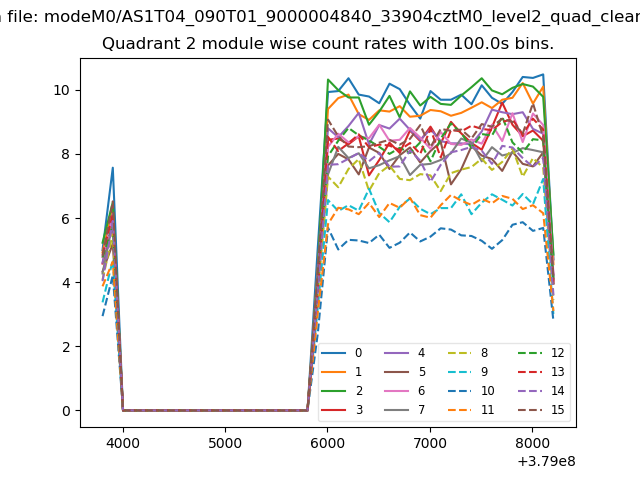
| Module-wise count rates for Quadrant B Data is divided into 100 sec bins |
 |
 |
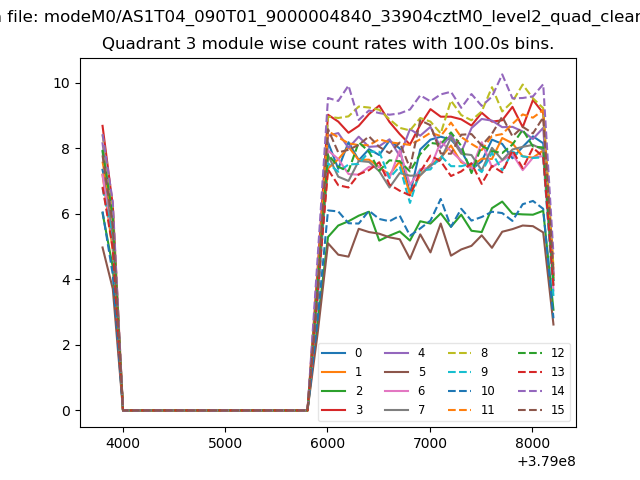
| Module-wise count rates for Quadrant C Data is divided into 100 sec bins |
 |
 |
| Module-wise count rates for Quadrant D Data is divided into 100 sec bins |
 |
 |
| Parameter | Plot |
|---|---|
| CZT HV Monitor | 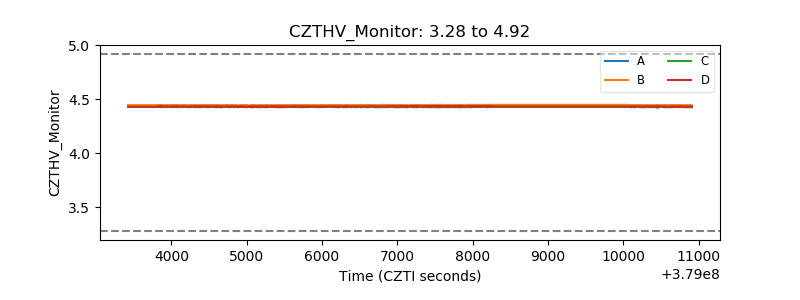 |
| D_VDD | 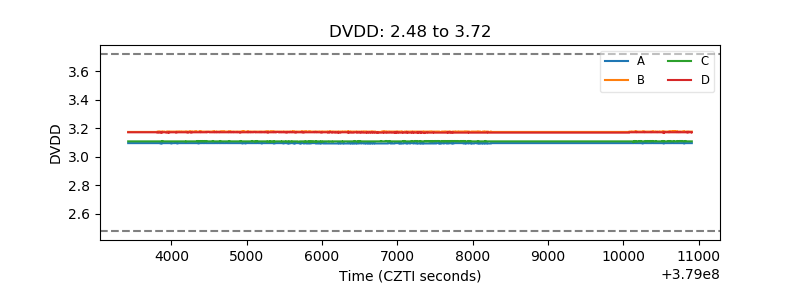 |
| Temperature 1 | 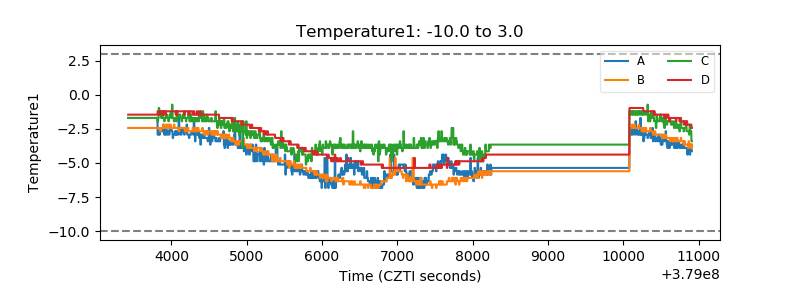 |
| Veto HV Monitor | 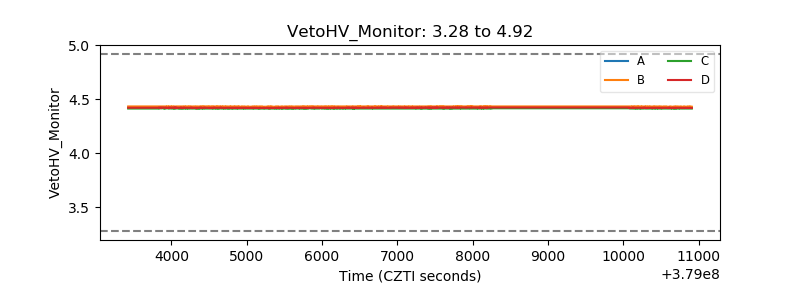 |
| Veto LLD | 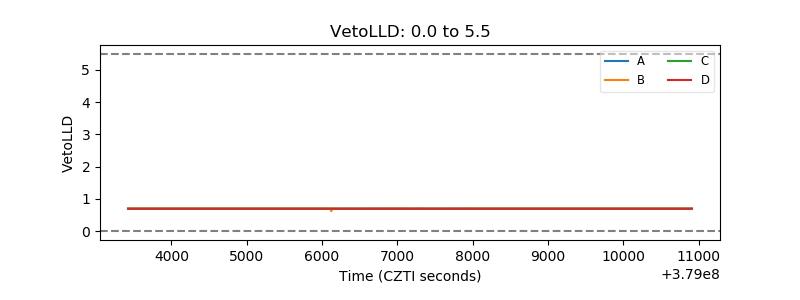 |
| Alpha Counter | 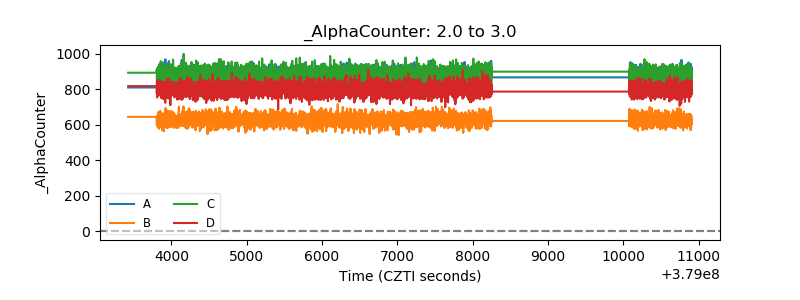 |
| _CPM_Rate | 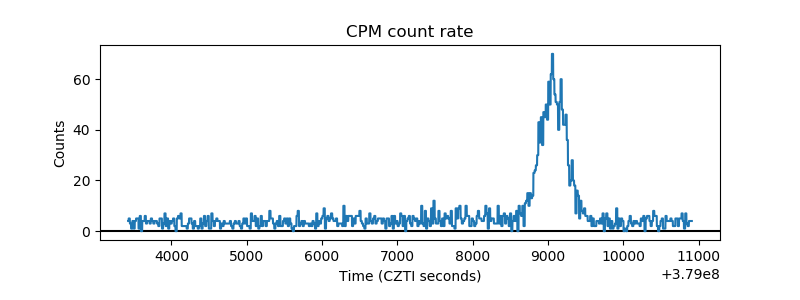 |
| CZT Counter | 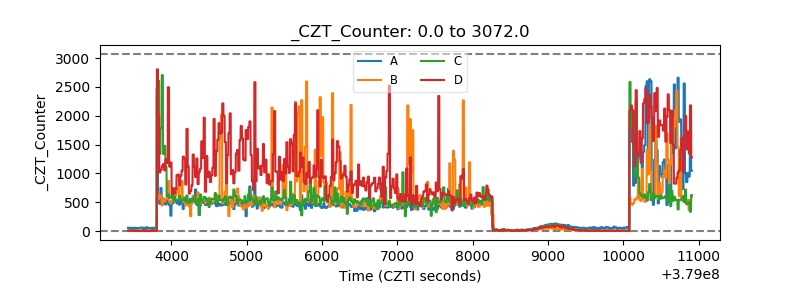 |
| +2.5 Volts monitor |  |
| +5 Volts monitor |  |
| _ROLL_ROT |  |
| _Roll_DEC | 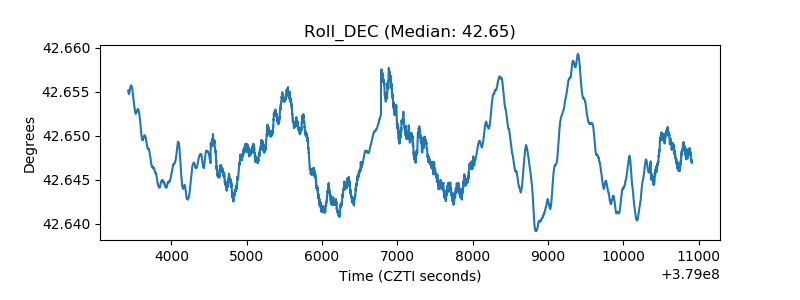 |
| _Roll_RA | 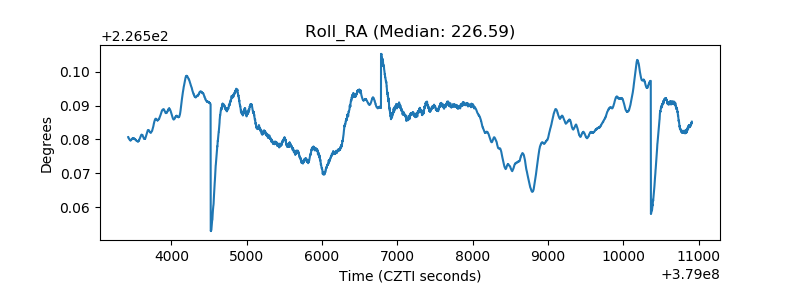 |
| Veto Counter |  |