| Param | Original file | Final file |
|---|---|---|
| Filename | modeM0/AS1T04_090T01_9000004840_33905cztM0_level2.evt | modeM0/AS1T04_090T01_9000004840_33905cztM0_level2_quad_clean.evt |
| Size (bytes) | 765,766,080 | 56,445,120 |
| Size | 730.3 MB | 53.8 MB |
| Events in quadrant A | 9,135,232 | 194,951 |
| Events in quadrant B | 3,747,990 | 381,162 |
| Events in quadrant C | 3,311,015 | 386,108 |
| Events in quadrant D | 6,625,632 | 360,258 |
| Mode M9 | |||
|---|---|---|---|
| Quadrant | BADHDUFLAG | Total packets | Discarded packets |
| A | 0 | 20 | 0 |
| B | 0 | 20 | 0 |
| C | 0 | 20 | 0 |
| D | 0 | 21 | 0 |
| Mode M0 | |||
|---|---|---|---|
| Quadrant | BADHDUFLAG | Total packets | Discarded packets |
| A | 0 | 30673 | 3 |
| B | 0 | 14710 | 2 |
| C | 0 | 12986 | 2 |
| D | 0 | 23521 | 2 |
| Mode SS | |||
|---|---|---|---|
| Quadrant | BADHDUFLAG | Total packets | Discarded packets |
| A | 0 | 112 | 0 |
| B | 0 | 112 | 0 |
| C | 0 | 112 | 0 |
| D | 0 | 112 | 0 |
| Quadrant | Total seconds | Saturated seconds | Saturation percentage |
|---|---|---|---|
| A | 5508 | 2630 | 47.748729% |
| B | 5508 | 329 | 5.973130% |
| C | 5508 | 133 | 2.414670% |
| D | 5508 | 972 | 17.647059% |
Noise dominated data is calculated using 1-second bins in cleaned event files. If a bin has >2000 counts, and if more than 50% of those come from <1% of pixels, then it is considered to be noise-dominated and hence unusable.
| Quadrant | # 1 sec bins | Bins with >0 counts | Bins with >2000 counts | High rate bins dominated by noise | Noise dominated (total time) | Noise dominated (detector-on time) | Marked lightcurve |
|---|---|---|---|---|---|---|---|
| A | 7000 | 5507 | 2293 | 2293 | 32.76% | 41.64% | 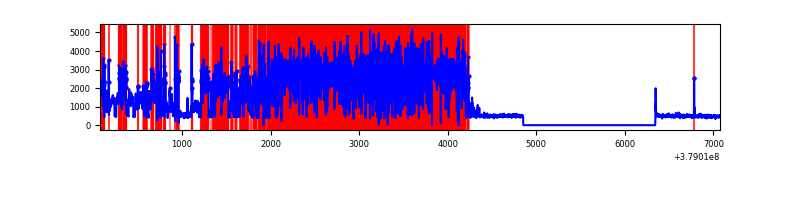 |
| B | 7000 | 5509 | 221 | 221 | 3.16% | 4.01% | 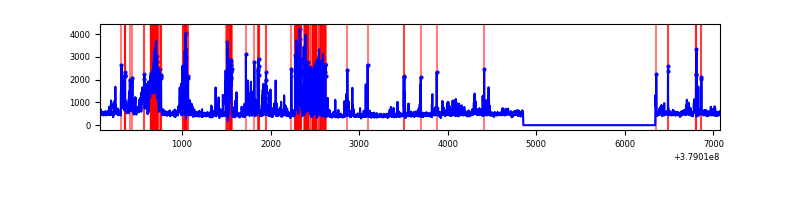 |
| C | 7000 | 5509 | 85 | 85 | 1.21% | 1.54% | 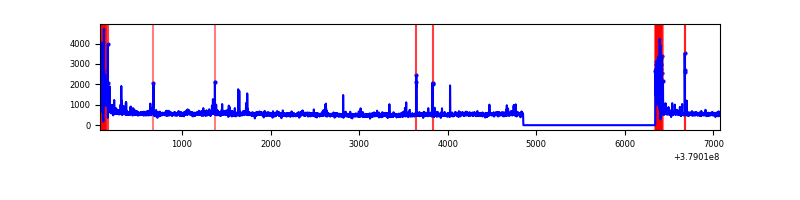 |
| D | 7000 | 5509 | 880 | 880 | 12.57% | 15.97% | 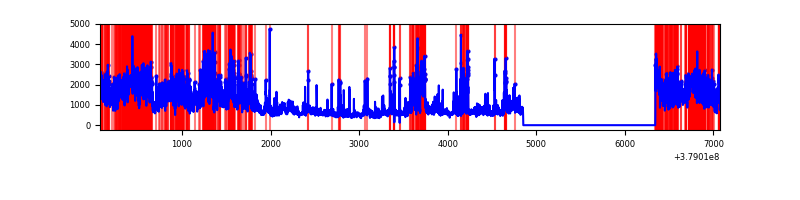 |
Top three noisy pixels from each quadrant. If the there are fewer than three noisy pixels in the level2.evt file, extra rows are filled as -1
| Pixel properties | Quadrant properties | ||||||
|---|---|---|---|---|---|---|---|
| Quadrant | DetID | PixID | Counts | Sigma | Mean | Median | Sigma |
| A | 15 | 169 | 7298020 | 77944.64 | 468 | 459 | 93.6 |
| A | 10 | 83 | 11545 | 118.41 | 468 | 459 | 93.6 |
| A | 13 | 6 | 8040 | 80.97 | 468 | 459 | 93.6 |
| B | 5 | 172 | 1103515 | 9193.58 | 621 | 605 | 120.0 |
| B | 4 | 81 | 70360 | 581.46 | 621 | 605 | 120.0 |
| B | 4 | 170 | 27714 | 225.97 | 621 | 605 | 120.0 |
| C | 0 | 10 | 343532 | 2402.19 | 616 | 620 | 142.7 |
| C | 15 | 214 | 238296 | 1664.99 | 616 | 620 | 142.7 |
| C | 3 | 233 | 204994 | 1431.7 | 616 | 620 | 142.7 |
| D | 1 | 52 | 2533248 | 15906.04 | 584 | 573 | 159.2 |
| D | 8 | 195 | 502667 | 3153.32 | 584 | 573 | 159.2 |
| D | 12 | 233 | 483599 | 3033.56 | 584 | 573 | 159.2 |
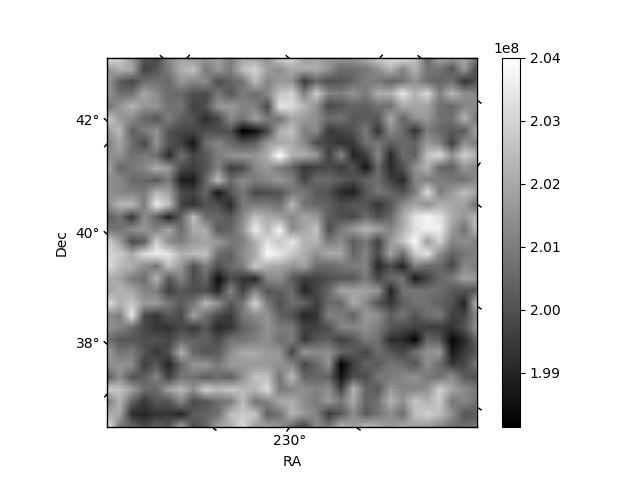
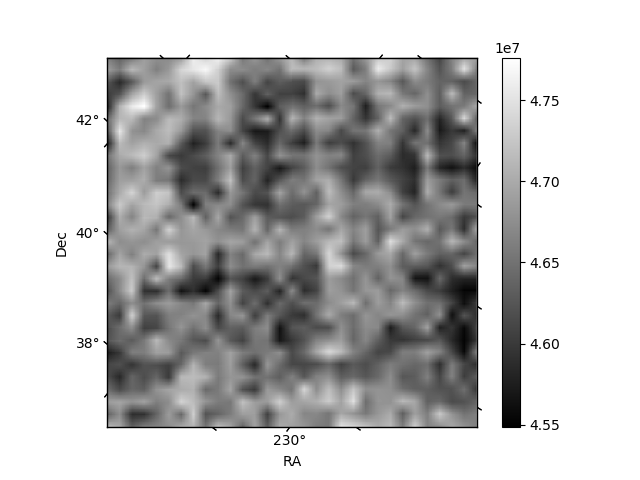
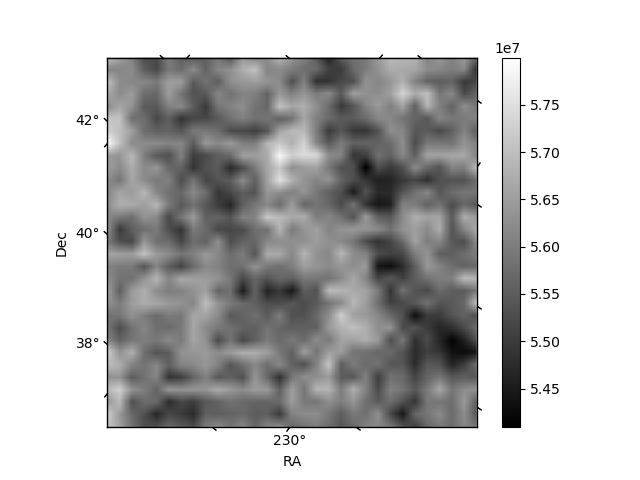
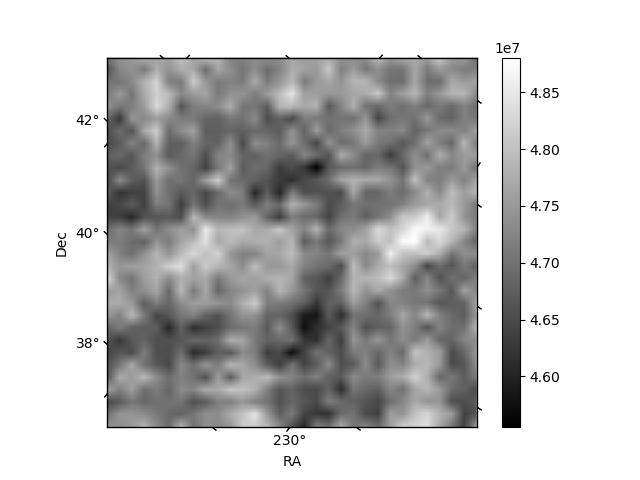
Histogram calculated using DETX and DETY for each event in the final _common_clean file
| Quadrant A | 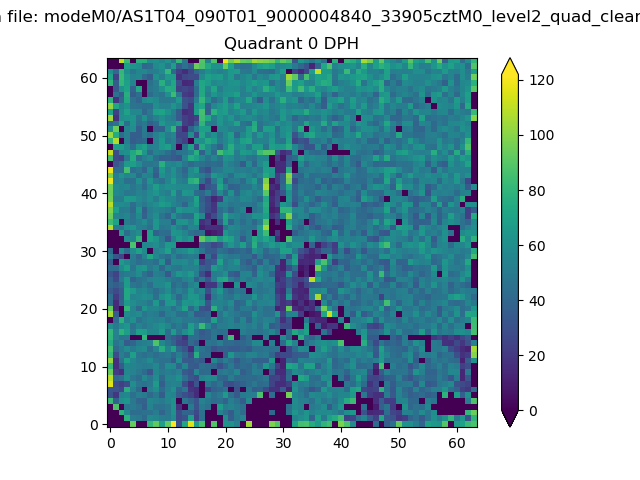 |
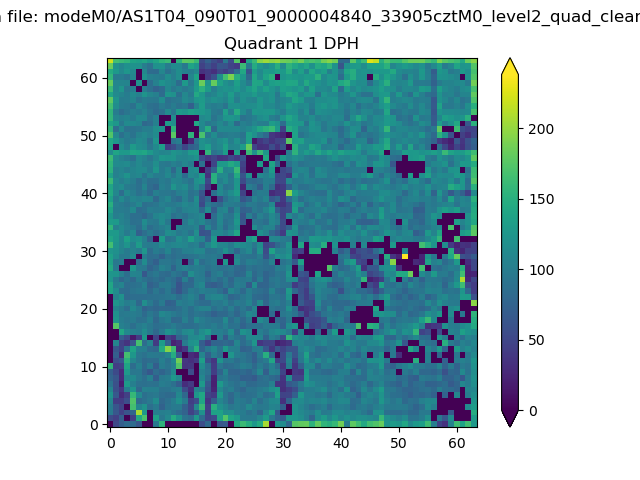 |
Quadrant B |
|---|---|---|---|
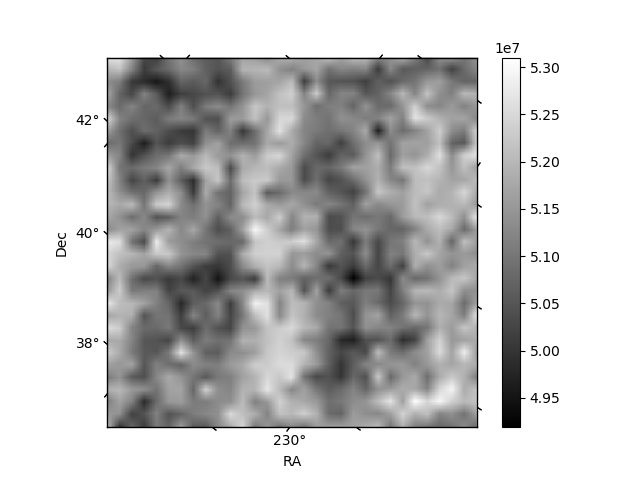
| Quadrant D | 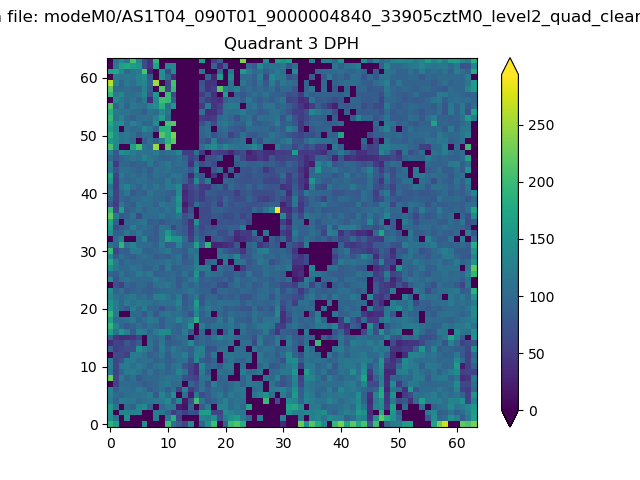 |
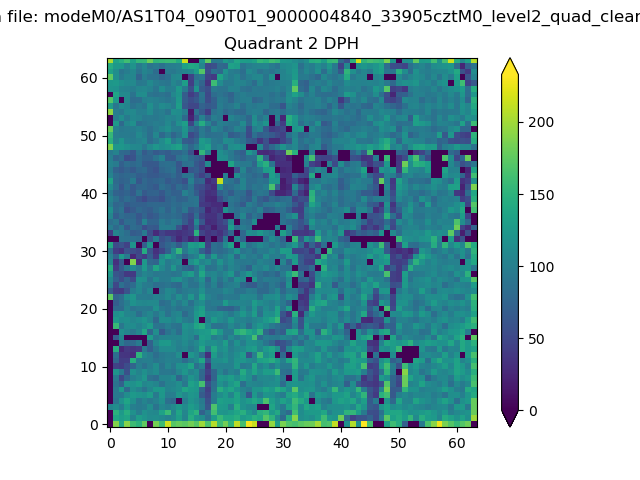 |
Quadrant C |
| Plot type | Count rate plots | Images |
|---|---|---|
| Comparison with Poisson distribution Blue bars denote a histogram of data divided into 1 sec bins. Red curve is a Poisson curve with rate = median count rate of data. |
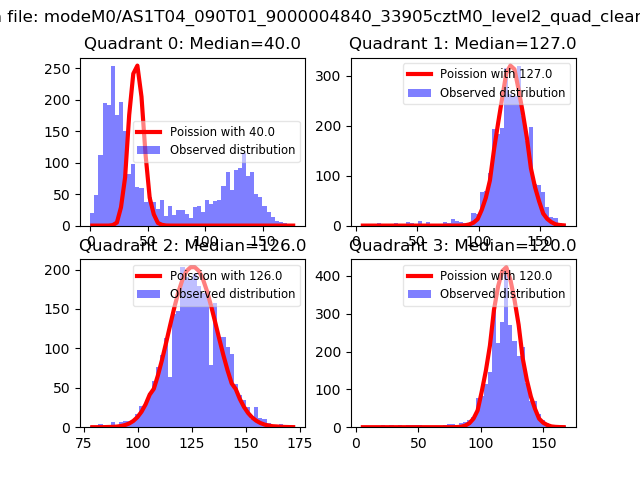 |
 |
| Quadrant-wise count rates Data is divided into 100 sec bins |
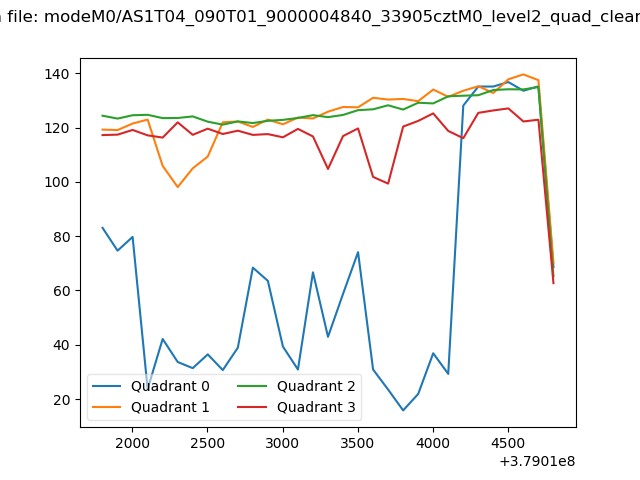 |
|
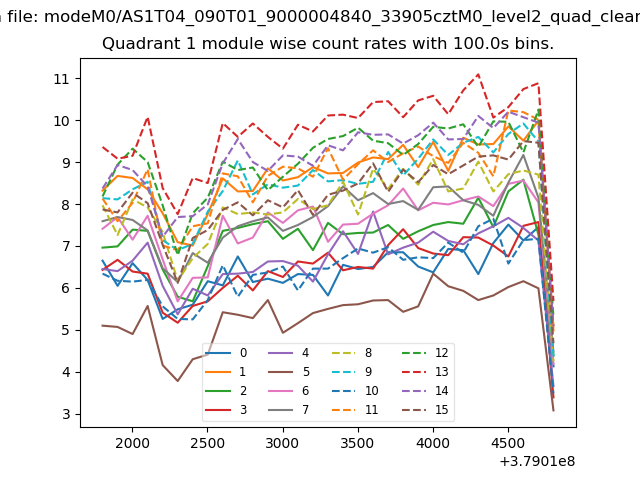
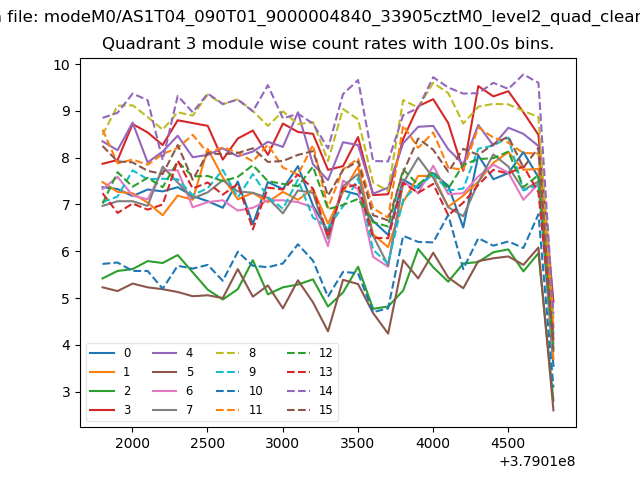
| Module-wise count rates for Quadrant A Data is divided into 100 sec bins |
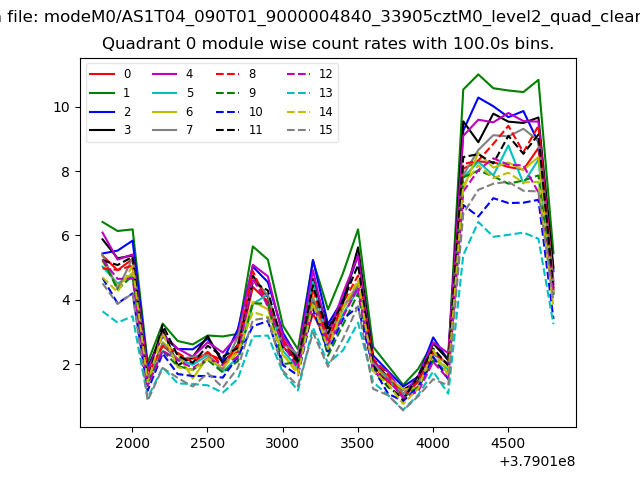 |
 |
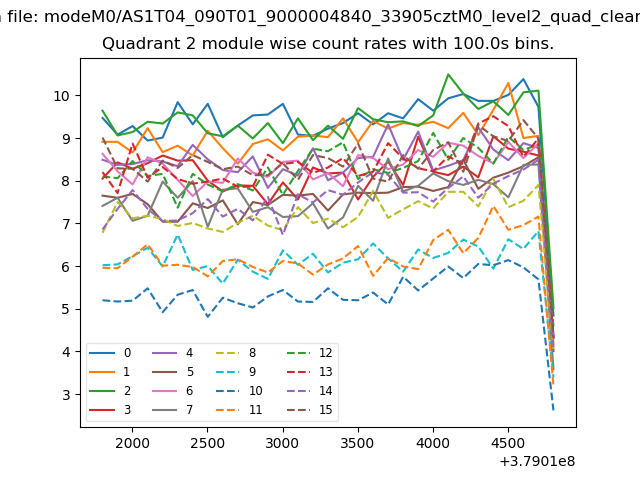
| Module-wise count rates for Quadrant B Data is divided into 100 sec bins |
 |
 |
| Module-wise count rates for Quadrant C Data is divided into 100 sec bins |
 |
 |
| Module-wise count rates for Quadrant D Data is divided into 100 sec bins |
 |
 |
| Parameter | Plot |
|---|---|
| CZT HV Monitor | 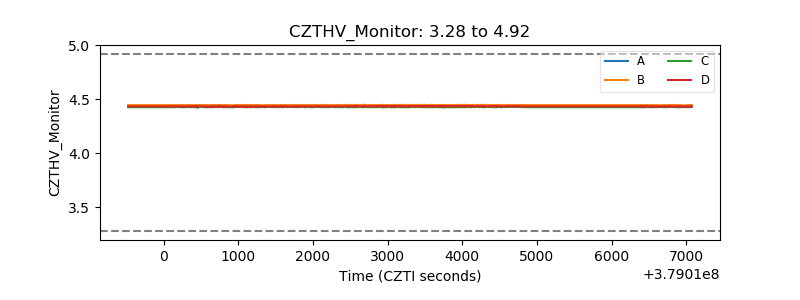 |
| D_VDD | 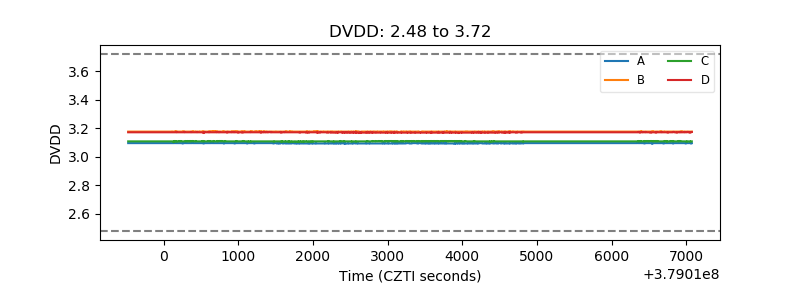 |
| Temperature 1 | 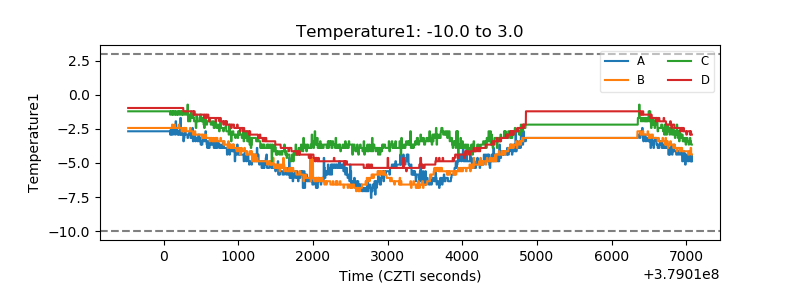 |
| Veto HV Monitor | 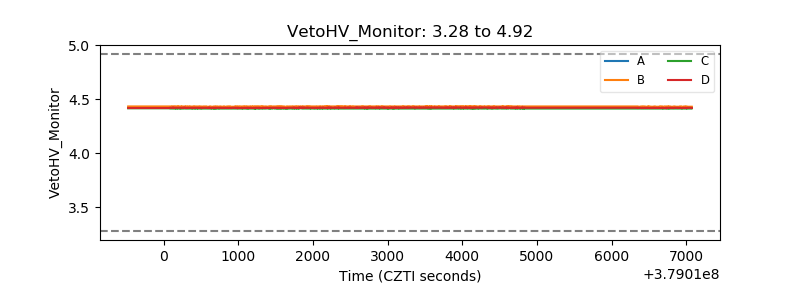 |
| Veto LLD | 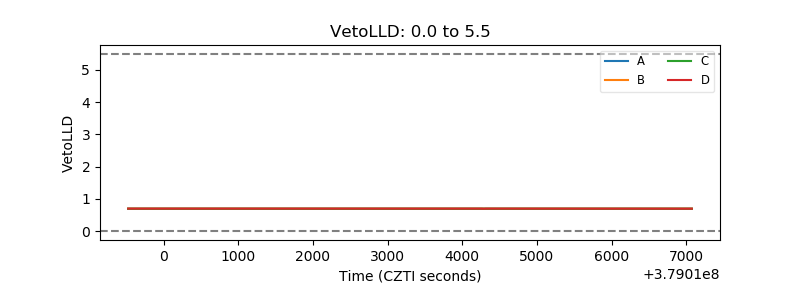 |
| Alpha Counter | 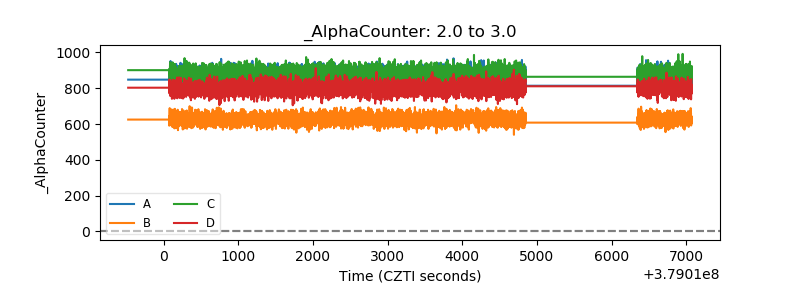 |
| _CPM_Rate | 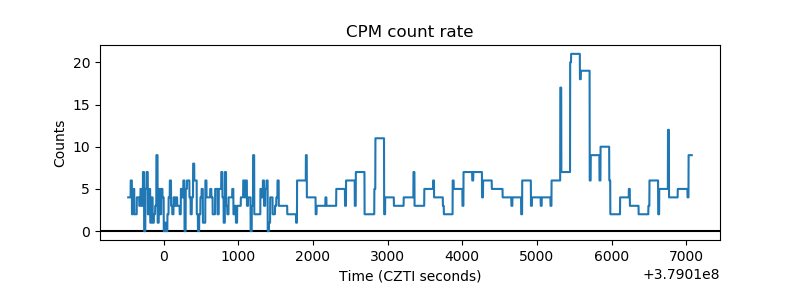 |
| CZT Counter | 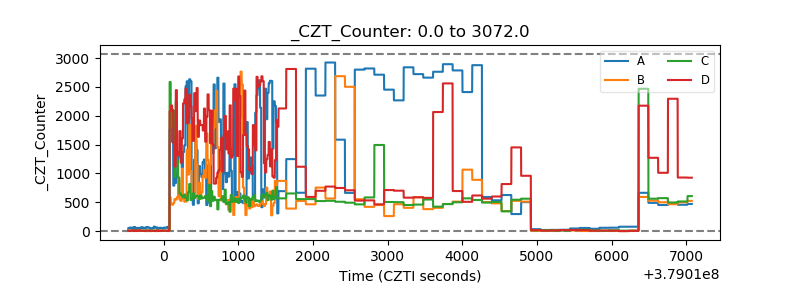 |
| +2.5 Volts monitor |  |
| +5 Volts monitor |  |
| _ROLL_ROT | 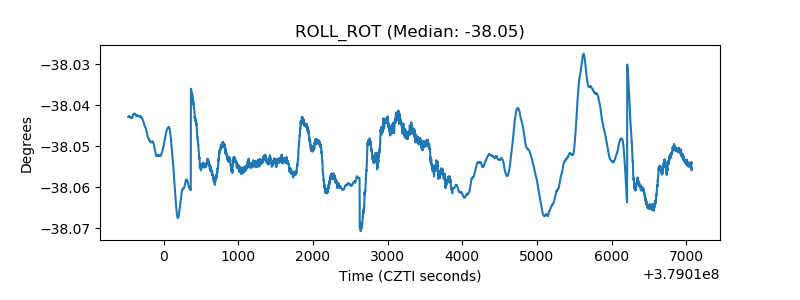 |
| _Roll_DEC | 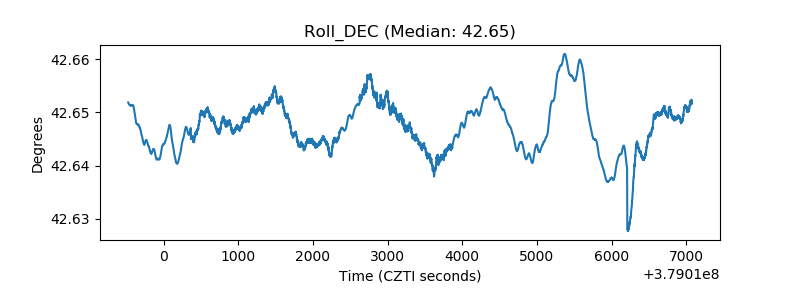 |
| _Roll_RA | 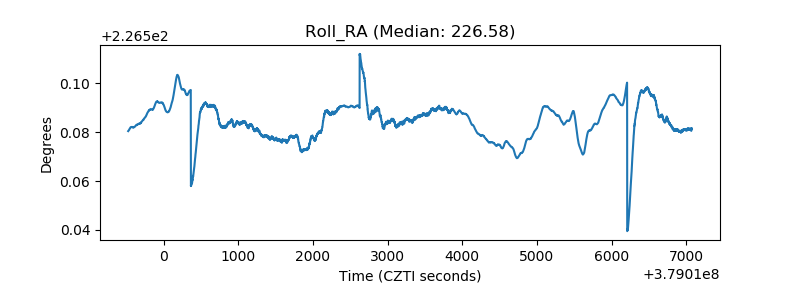 |
| Veto Counter | 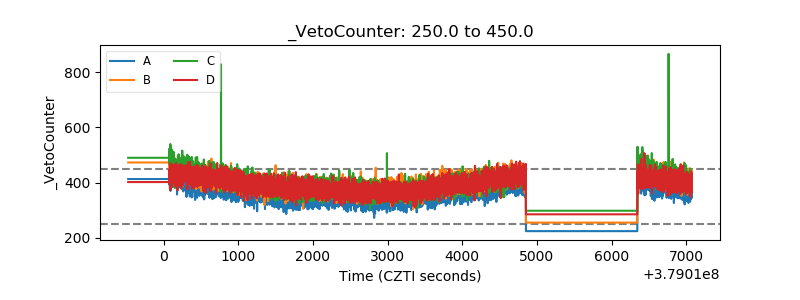 |