| Param | Original file | Final file |
|---|---|---|
| Filename | modeM0/AS1T04_090T01_9000004840_33909cztM0_level2.evt | modeM0/AS1T04_090T01_9000004840_33909cztM0_level2_quad_clean.evt |
| Size (bytes) | 4,348,800 | 1,370,880 |
| Size | 4.1 MB | 1.3 MB |
| Events in quadrant A | 27,687 | 7,562 |
| Events in quadrant B | 29,175 | 6,654 |
| Events in quadrant C | 36,961 | 9,060 |
| Events in quadrant D | 29,899 | 4,851 |
| Mode M9 | |||
|---|---|---|---|
| Quadrant | BADHDUFLAG | Total packets | Discarded packets |
| A | 1 | 140325214788392 | 46 |
| B | 1 | -1 | -1 |
| C | 1 | -1 | -1 |
| D | 1 | -1 | -1 |
| Mode M0 | |||
|---|---|---|---|
| Quadrant | BADHDUFLAG | Total packets | Discarded packets |
| A | 0 | 5732 | 5604 |
| B | 0 | 6328 | 6207 |
| C | 0 | 5796 | 5644 |
| D | 0 | 8087 | 7971 |
| Mode SS | |||
|---|---|---|---|
| Quadrant | BADHDUFLAG | Total packets | Discarded packets |
| A | 0 | 57 | 55 |
| B | 0 | 55 | 53 |
| C | 0 | 58 | 52 |
| D | 0 | 59 | 59 |
| Quadrant | Total seconds | Saturated seconds | Saturation percentage |
|---|---|---|---|
| A | 62 | 0 | 0.000000% |
| B | 54 | 0 | 0.000000% |
| C | 75 | 1 | 1.333333% |
| D | 41 | 0 | 0.000000% |
Noise dominated data is calculated using 1-second bins in cleaned event files. If a bin has >2000 counts, and if more than 50% of those come from <1% of pixels, then it is considered to be noise-dominated and hence unusable.
| Quadrant | # 1 sec bins | Bins with >0 counts | Bins with >2000 counts | High rate bins dominated by noise | Noise dominated (total time) | Noise dominated (detector-on time) | Marked lightcurve |
|---|---|---|---|---|---|---|---|
| A | 1099 | 115 | 0 | 0 | 0.00% | 0.00% | 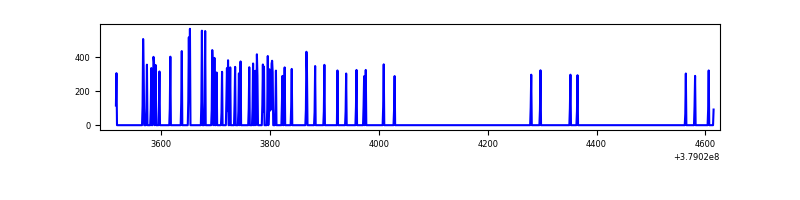 |
| B | 1011 | 99 | 0 | 0 | 0.00% | 0.00% | 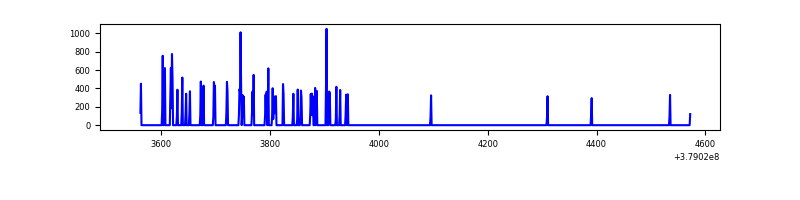 |
| C | 1120 | 136 | 0 | 0 | 0.00% | 0.00% | 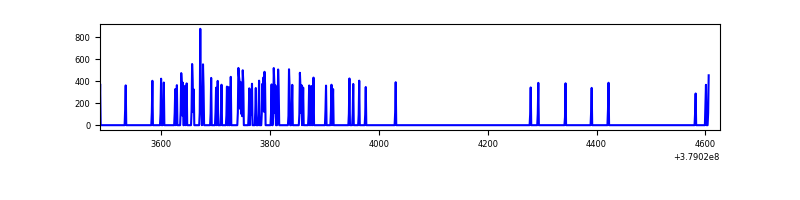 |
| D | 1131 | 78 | 0 | 0 | 0.00% | 0.00% | 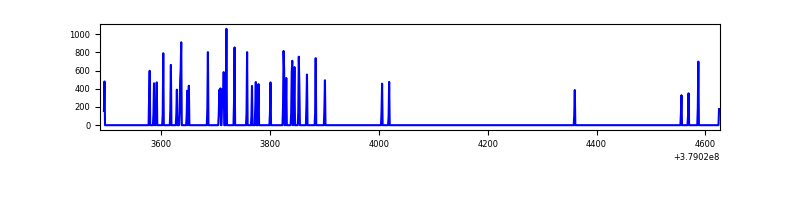 |
Top three noisy pixels from each quadrant. If the there are fewer than three noisy pixels in the level2.evt file, extra rows are filled as -1
| Pixel properties | Quadrant properties | ||||||
|---|---|---|---|---|---|---|---|
| Quadrant | DetID | PixID | Counts | Sigma | Mean | Median | Sigma |
| A | 15 | 169 | 1194 | 412.3 | 6 | 6 | 2.9 |
| A | 13 | 254 | 118 | 38.87 | 6 | 6 | 2.9 |
| A | 13 | 6 | 100 | 32.62 | 6 | 6 | 2.9 |
| B | 5 | 172 | 5050 | 1904.54 | 5 | 5 | 2.6 |
| B | 0 | 190 | 305 | 113.25 | 5 | 5 | 2.6 |
| B | 15 | 35 | 187 | 68.71 | 5 | 5 | 2.6 |
| C | 15 | 214 | 3028 | 889.45 | 8 | 8 | 3.4 |
| C | 3 | 9 | 712 | 207.34 | 8 | 8 | 3.4 |
| C | 3 | 233 | 382 | 110.15 | 8 | 8 | 3.4 |
| D | 1 | 52 | 5221 | 2271.69 | 4 | 4 | 2.3 |
| D | 8 | 195 | 3288 | 1429.98 | 4 | 4 | 2.3 |
| D | 10 | 118 | 2935 | 1276.27 | 4 | 4 | 2.3 |
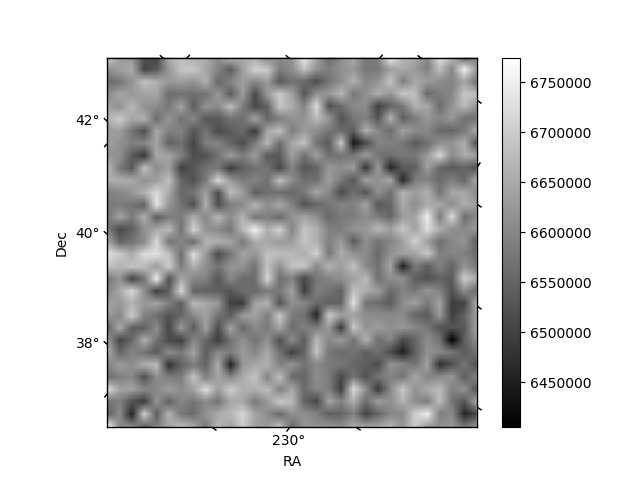
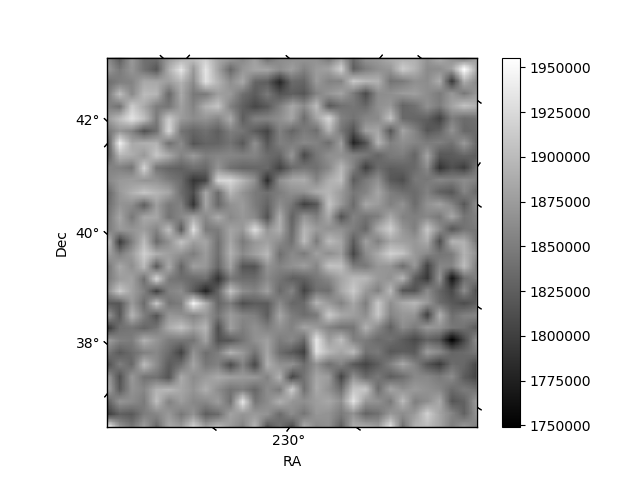
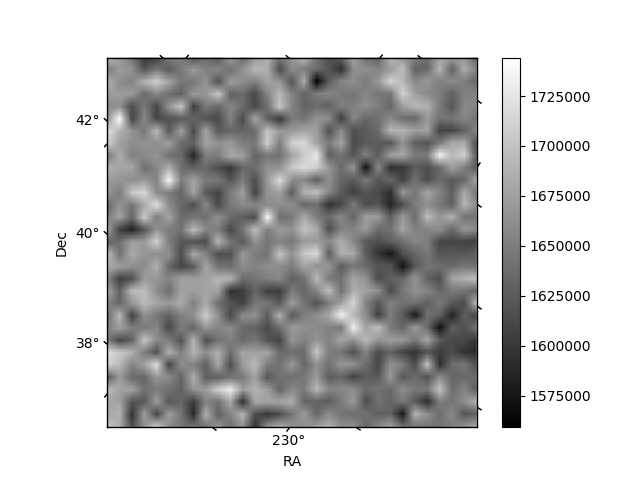
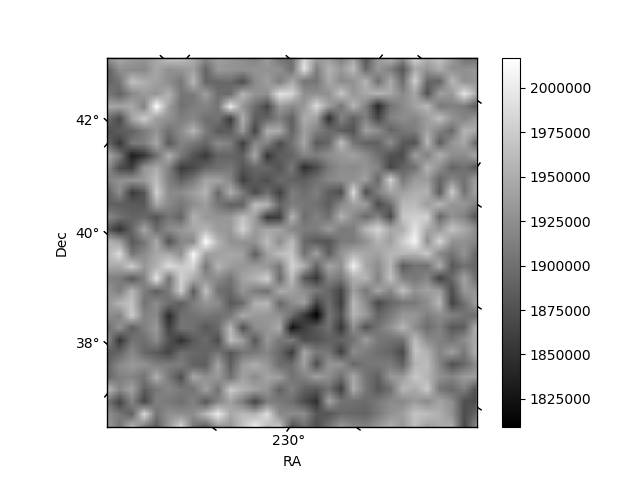
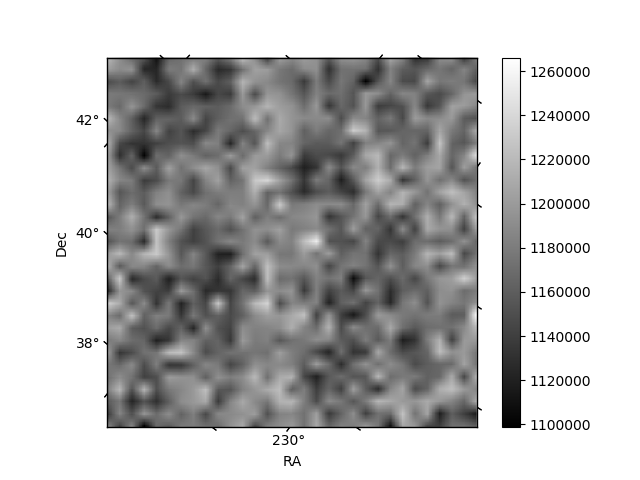
Histogram calculated using DETX and DETY for each event in the final _common_clean file
| Quadrant A | 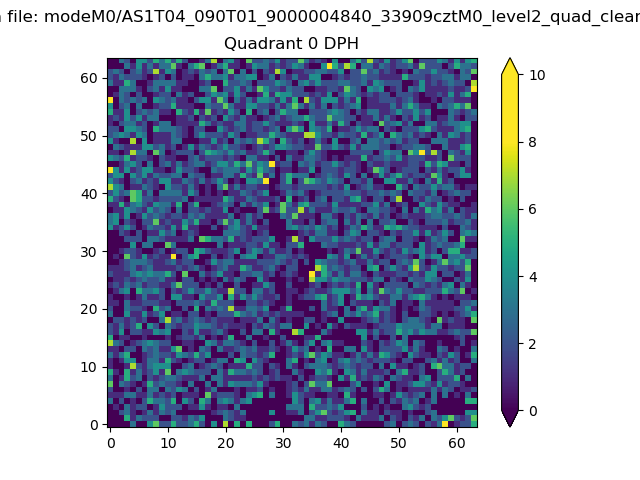 |
 |
Quadrant B |
|---|---|---|---|
| Quadrant D | 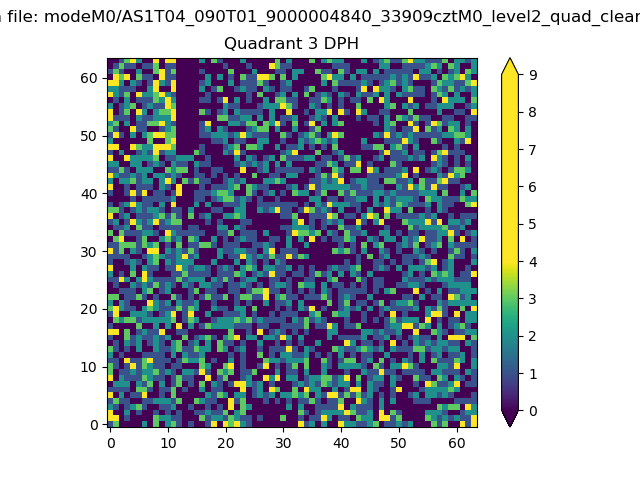 |
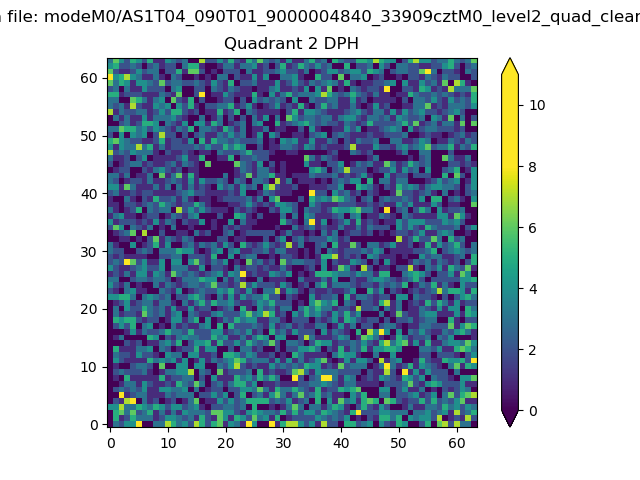 |
Quadrant C |
| Plot type | Count rate plots | Images |
|---|---|---|
| Comparison with Poisson distribution Blue bars denote a histogram of data divided into 1 sec bins. Red curve is a Poisson curve with rate = median count rate of data. |
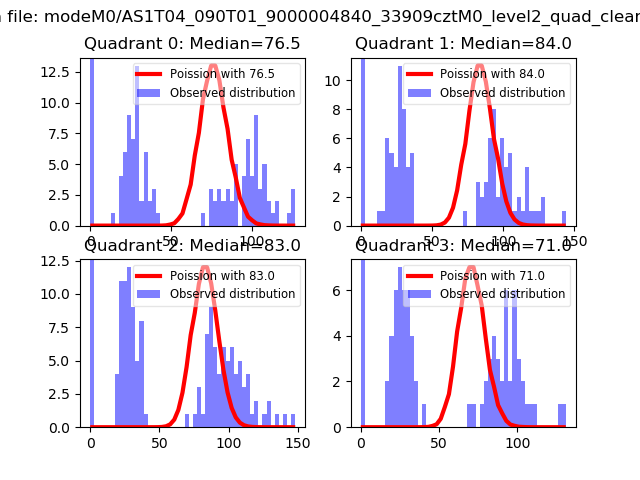 |
 |
| Quadrant-wise count rates Data is divided into 100 sec bins |
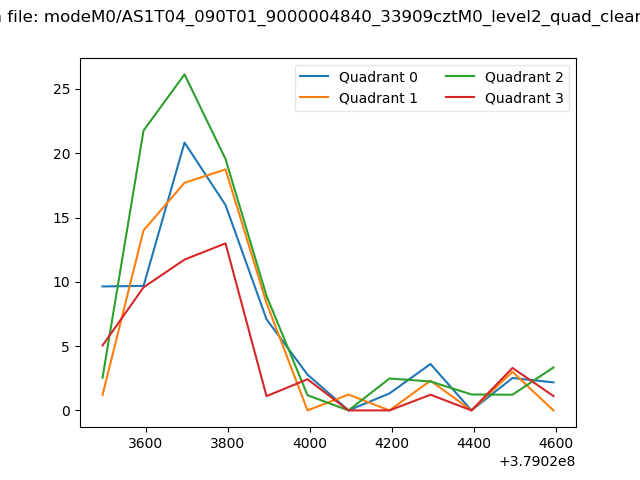 |
|
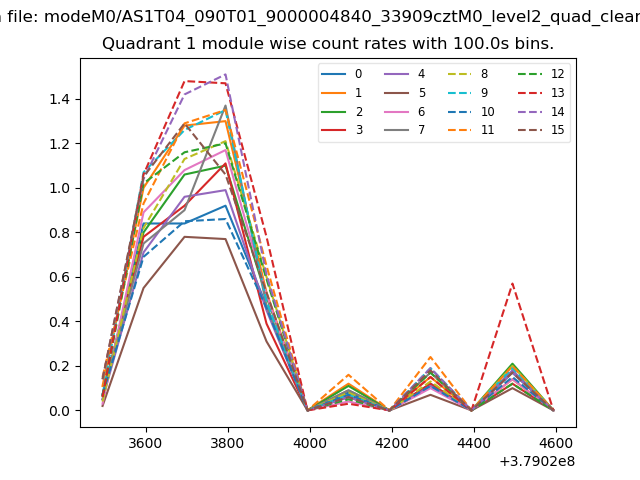
| Module-wise count rates for Quadrant A Data is divided into 100 sec bins |
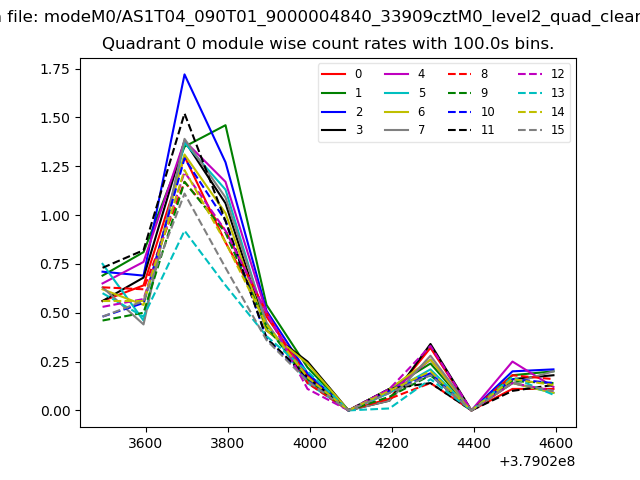 |
 |
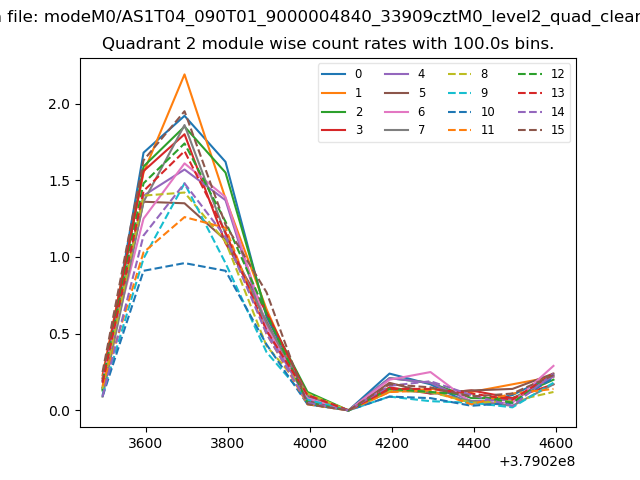
| Module-wise count rates for Quadrant B Data is divided into 100 sec bins |
 |
 |
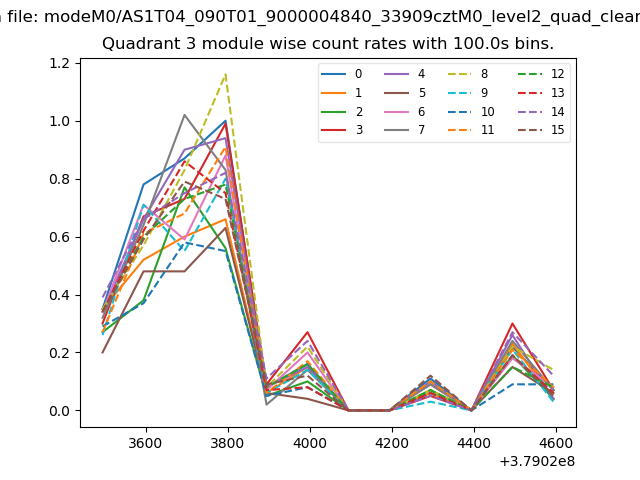
| Module-wise count rates for Quadrant C Data is divided into 100 sec bins |
 |
 |
| Module-wise count rates for Quadrant D Data is divided into 100 sec bins |
 |
 |
| Parameter | Plot |
|---|---|
| CZT HV Monitor | 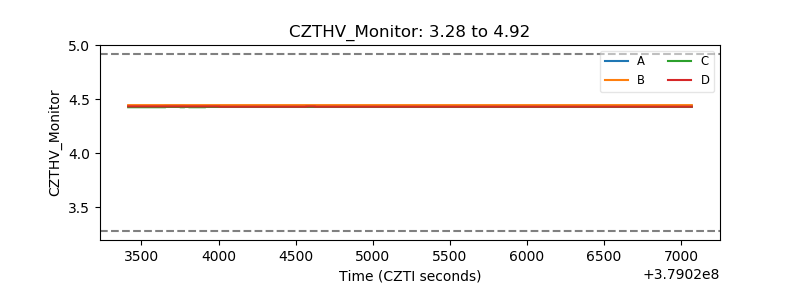 |
| D_VDD | 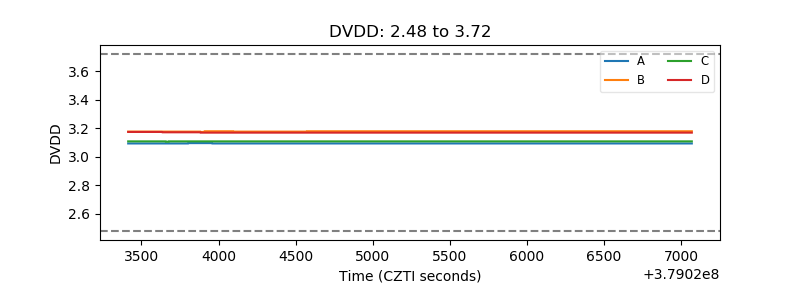 |
| Temperature 1 | 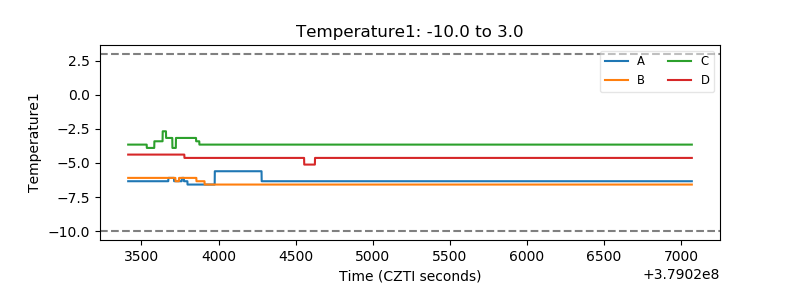 |
| Veto HV Monitor | 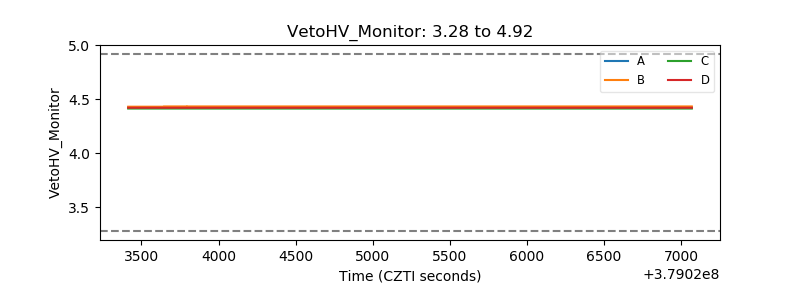 |
| Veto LLD |  |
| Alpha Counter | 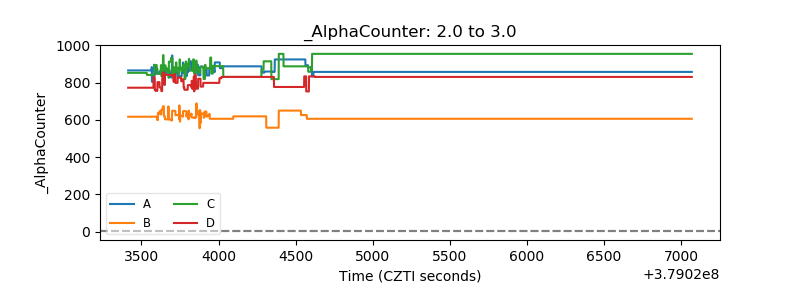 |
| _CPM_Rate | 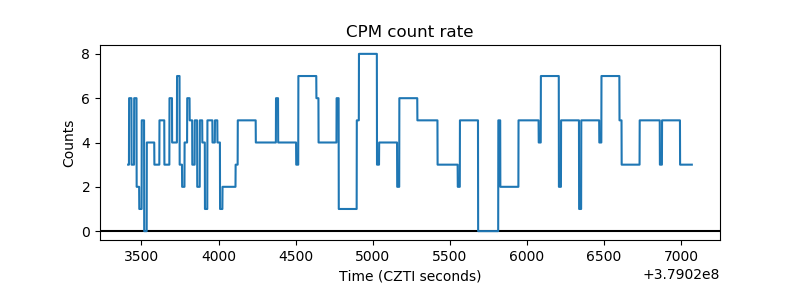 |
| CZT Counter | 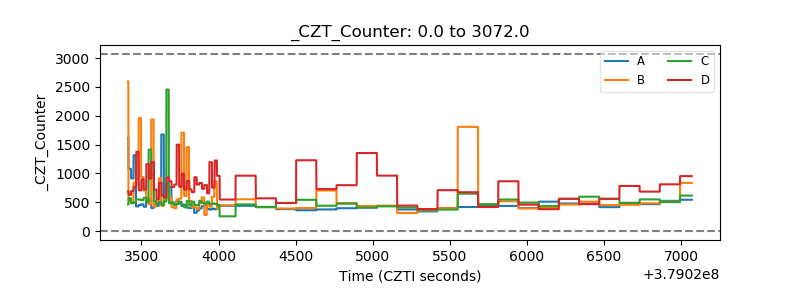 |
| +2.5 Volts monitor |  |
| +5 Volts monitor |  |
| _ROLL_ROT | 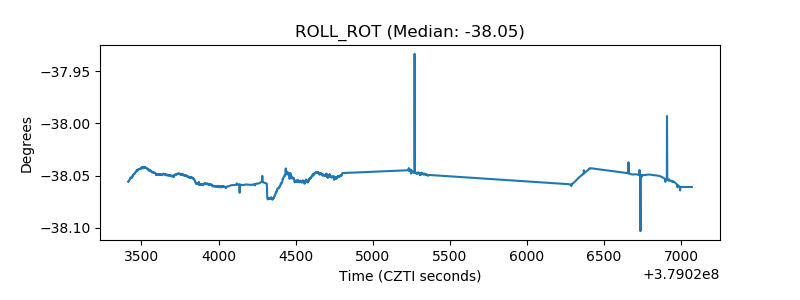 |
| _Roll_DEC | 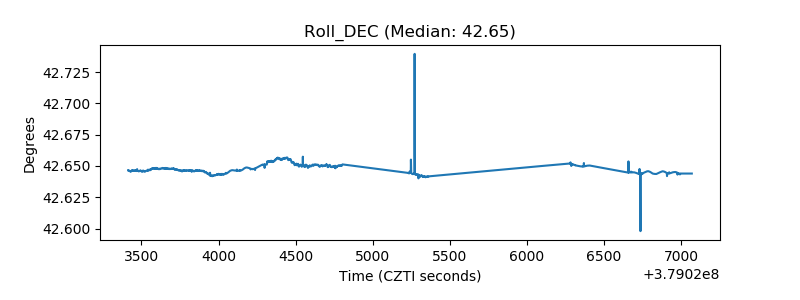 |
| _Roll_RA | 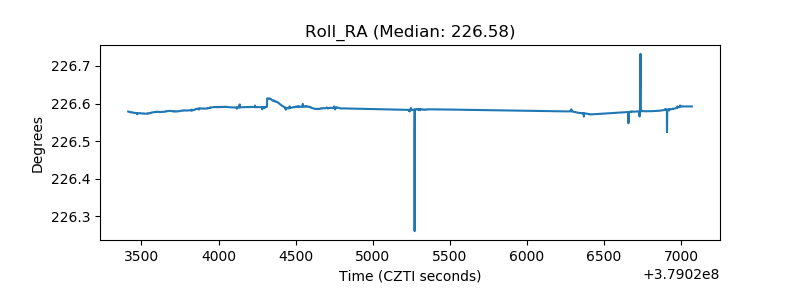 |
| Veto Counter | 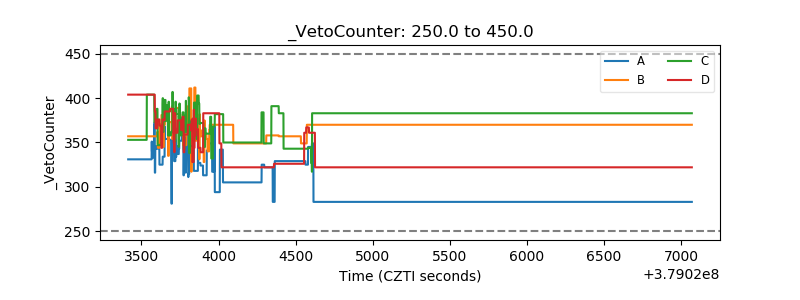 |