| Param | Original file | Final file |
|---|---|---|
| Filename | modeM0/AS1T04_090T01_9000004840_33910cztM0_level2.evt | modeM0/AS1T04_090T01_9000004840_33910cztM0_level2_quad_clean.evt |
| Size (bytes) | 195,226,560 | 29,283,840 |
| Size | 186.2 MB | 27.9 MB |
| Events in quadrant A | 1,158,618 | 184,653 |
| Events in quadrant B | 1,379,343 | 187,375 |
| Events in quadrant C | 1,308,504 | 184,889 |
| Events in quadrant D | 1,920,431 | 176,007 |
| Mode M9 | |||
|---|---|---|---|
| Quadrant | BADHDUFLAG | Total packets | Discarded packets |
| A | 0 | 13 | 0 |
| B | 0 | 13 | 0 |
| C | 0 | 13 | 0 |
| D | 0 | 13 | 0 |
| Mode M0 | |||
|---|---|---|---|
| Quadrant | BADHDUFLAG | Total packets | Discarded packets |
| A | 0 | 4748 | 68 |
| B | 0 | 5419 | 35 |
| C | 0 | 5113 | 66 |
| D | 0 | 7328 | 74 |
| Mode SS | |||
|---|---|---|---|
| Quadrant | BADHDUFLAG | Total packets | Discarded packets |
| A | 0 | 46 | 2 |
| B | 0 | 46 | 0 |
| C | 0 | 46 | 0 |
| D | 0 | 46 | 0 |
| Quadrant | Total seconds | Saturated seconds | Saturation percentage |
|---|---|---|---|
| A | 2109 | 62 | 2.939782% |
| B | 2120 | 84 | 3.962264% |
| C | 2113 | 44 | 2.082347% |
| D | 2109 | 83 | 3.935514% |
Noise dominated data is calculated using 1-second bins in cleaned event files. If a bin has >2000 counts, and if more than 50% of those come from <1% of pixels, then it is considered to be noise-dominated and hence unusable.
| Quadrant | # 1 sec bins | Bins with >0 counts | Bins with >2000 counts | High rate bins dominated by noise | Noise dominated (total time) | Noise dominated (detector-on time) | Marked lightcurve |
|---|---|---|---|---|---|---|---|
| A | 3446 | 2132 | 51 | 51 | 1.48% | 2.39% | 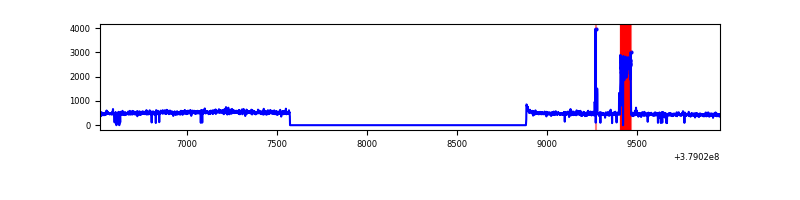 |
| B | 3446 | 2134 | 37 | 37 | 1.07% | 1.73% | 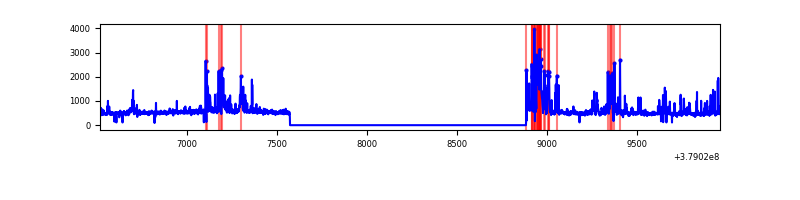 |
| C | 3446 | 2134 | 27 | 27 | 0.78% | 1.27% | 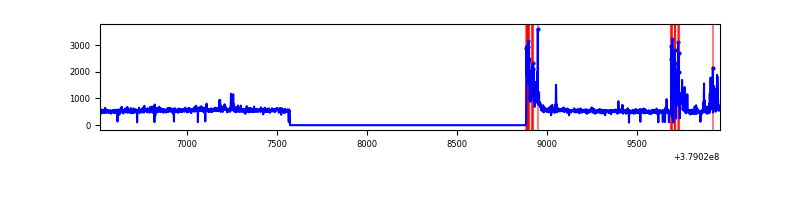 |
| D | 3446 | 2134 | 58 | 58 | 1.68% | 2.72% | 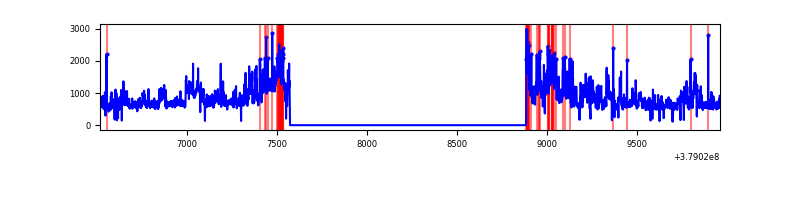 |
Top three noisy pixels from each quadrant. If the there are fewer than three noisy pixels in the level2.evt file, extra rows are filled as -1
| Pixel properties | Quadrant properties | ||||||
|---|---|---|---|---|---|---|---|
| Quadrant | DetID | PixID | Counts | Sigma | Mean | Median | Sigma |
| A | 15 | 169 | 135096 | 2467.95 | 261 | 254 | 54.6 |
| A | 13 | 6 | 6760 | 119.08 | 261 | 254 | 54.6 |
| A | 10 | 83 | 5975 | 104.71 | 261 | 254 | 54.6 |
| B | 5 | 172 | 251773 | 4913.25 | 258 | 252 | 51.2 |
| B | 4 | 170 | 20036 | 386.46 | 258 | 252 | 51.2 |
| B | 15 | 35 | 18811 | 362.53 | 258 | 252 | 51.2 |
| C | 3 | 9 | 98187 | 1605.12 | 255 | 256 | 61.0 |
| C | 15 | 214 | 94303 | 1541.46 | 255 | 256 | 61.0 |
| C | 0 | 10 | 80115 | 1308.92 | 255 | 256 | 61.0 |
| D | 1 | 52 | 481533 | 6893.67 | 253 | 248 | 69.8 |
| D | 8 | 195 | 277902 | 3976.97 | 253 | 248 | 69.8 |
| D | 10 | 118 | 47901 | 682.56 | 253 | 248 | 69.8 |
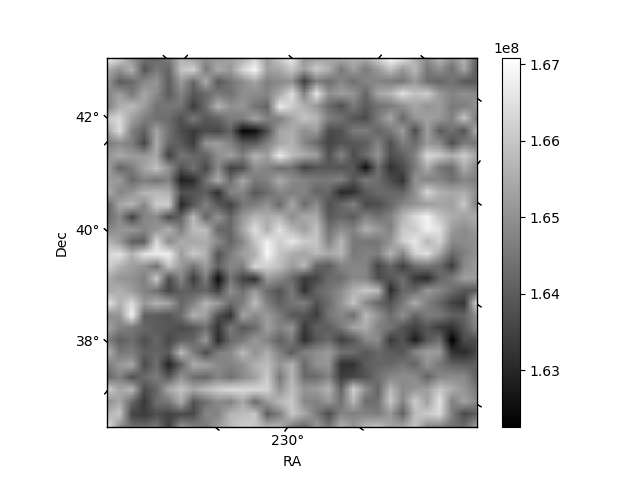
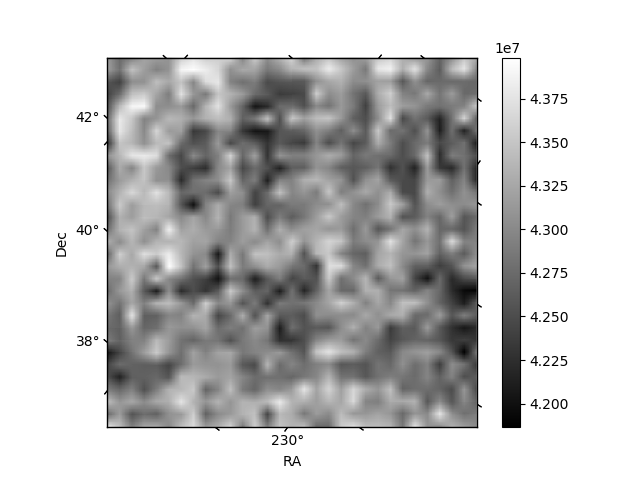
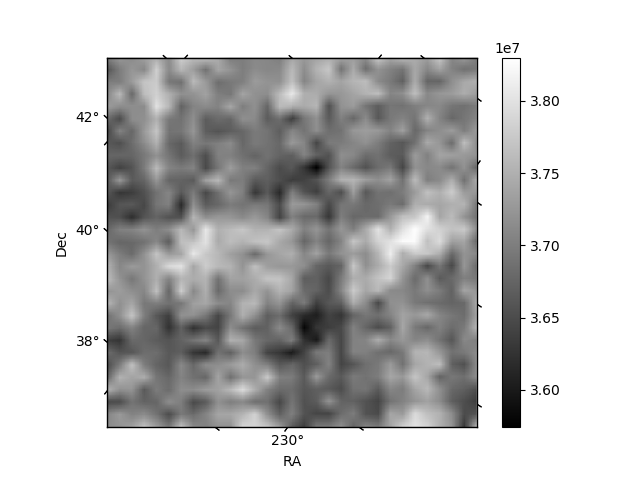
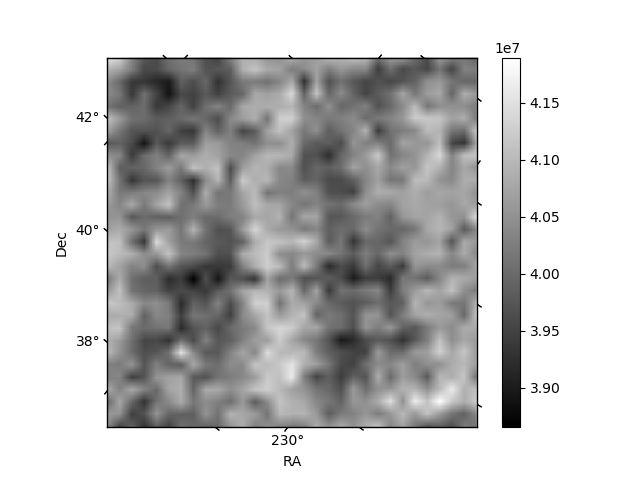
Histogram calculated using DETX and DETY for each event in the final _common_clean file
| Quadrant A | 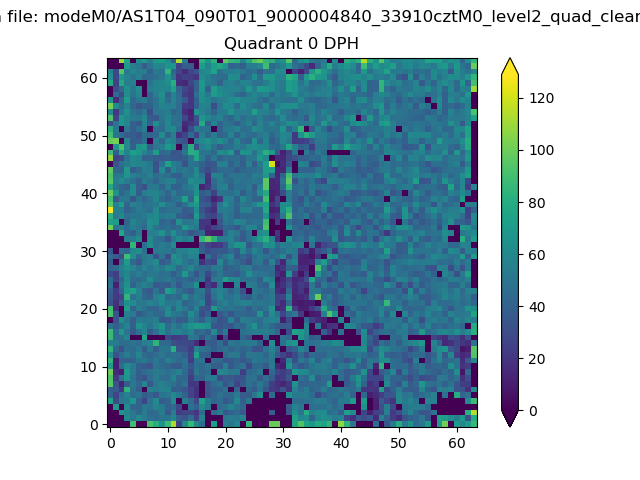 |
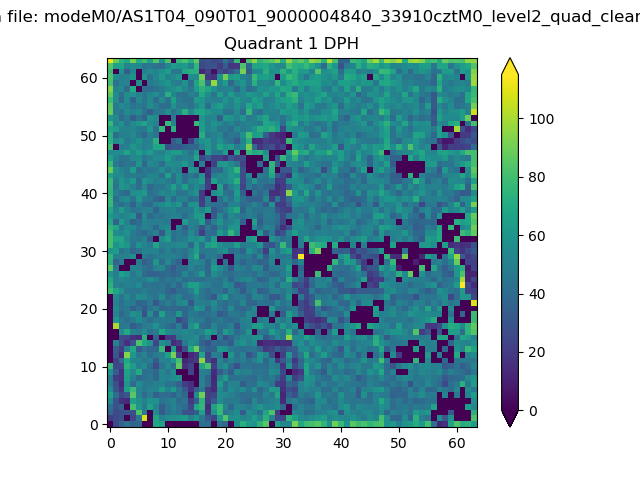 |
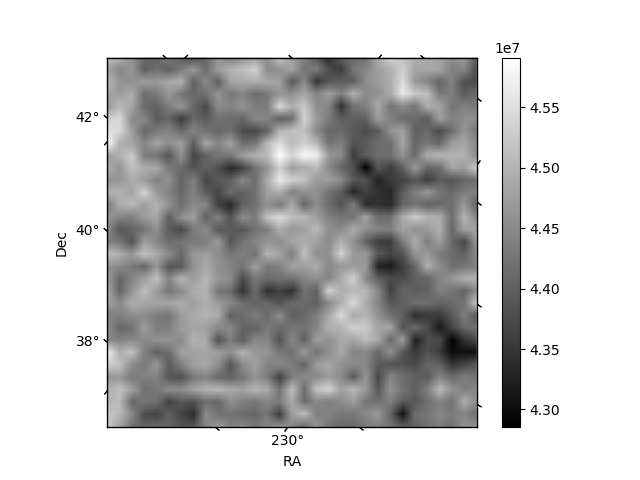
Quadrant B |
|---|---|---|---|
| Quadrant D | 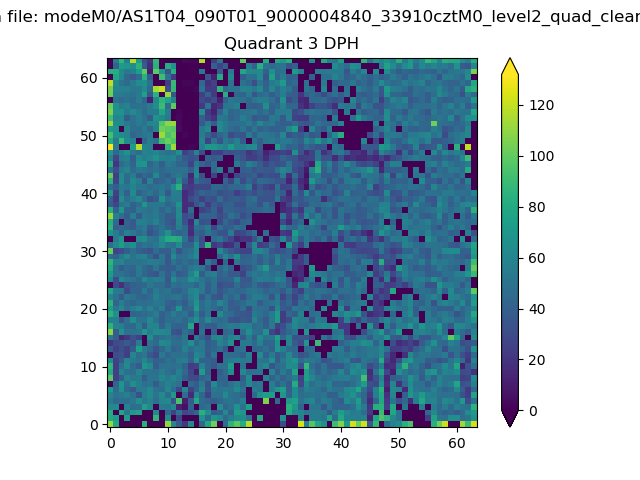 |
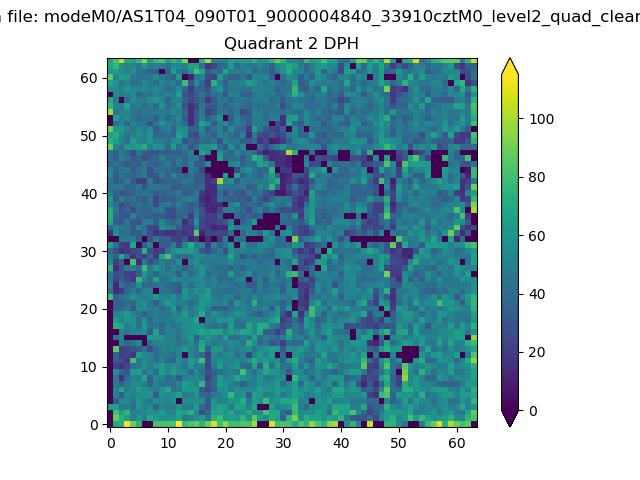 |
Quadrant C |
| Plot type | Count rate plots | Images |
|---|---|---|
| Comparison with Poisson distribution Blue bars denote a histogram of data divided into 1 sec bins. Red curve is a Poisson curve with rate = median count rate of data. |
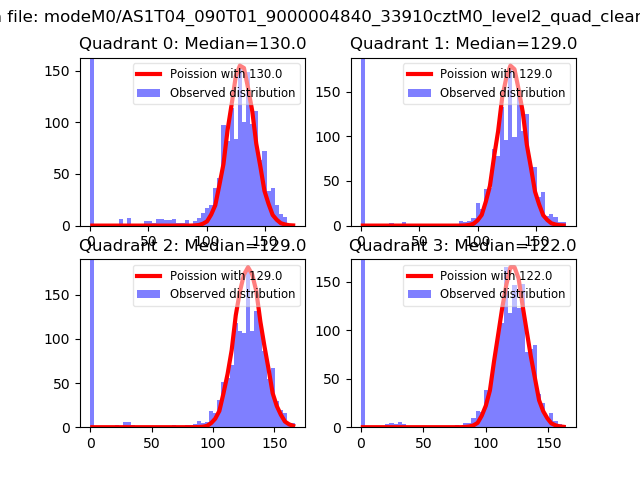 |
 |
| Quadrant-wise count rates Data is divided into 100 sec bins |
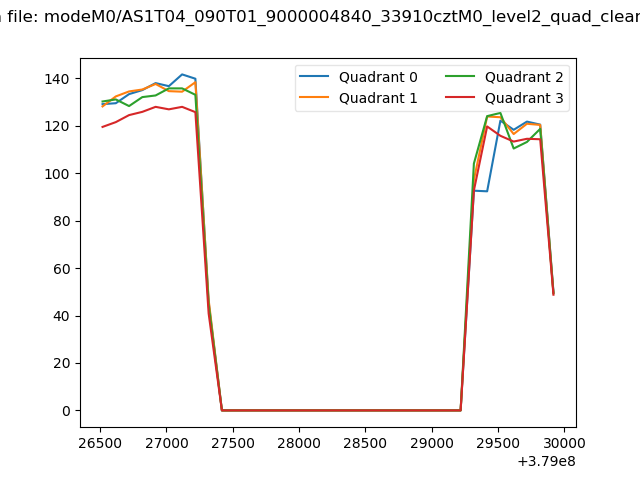 |
|
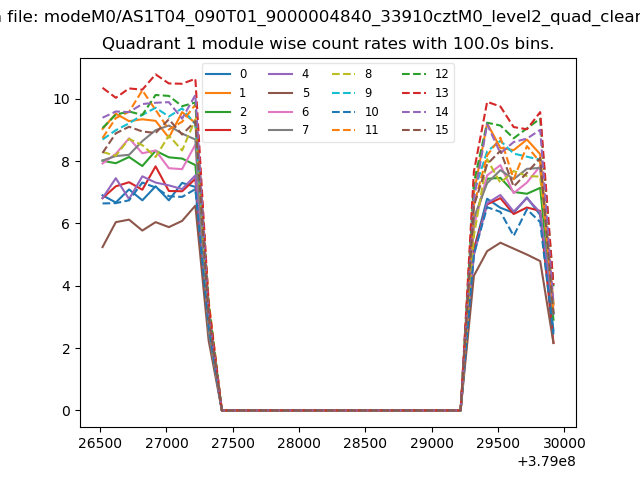
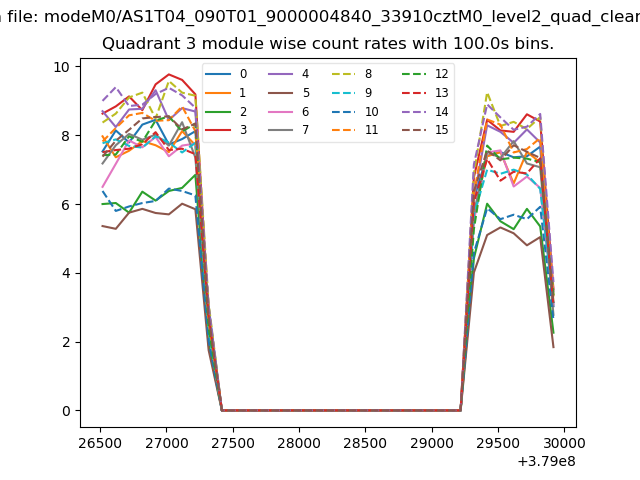
| Module-wise count rates for Quadrant A Data is divided into 100 sec bins |
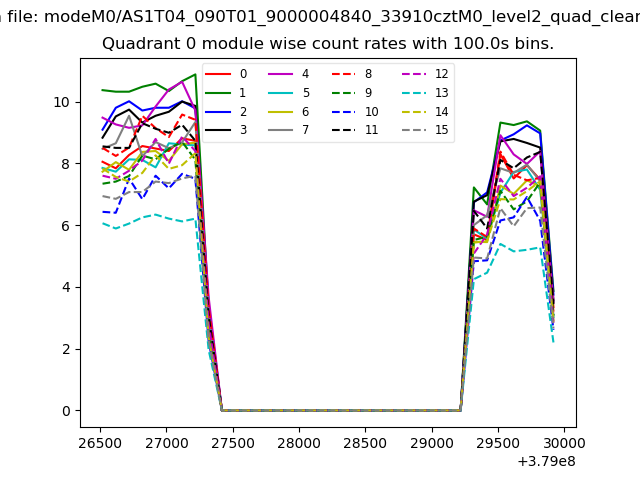 |
 |
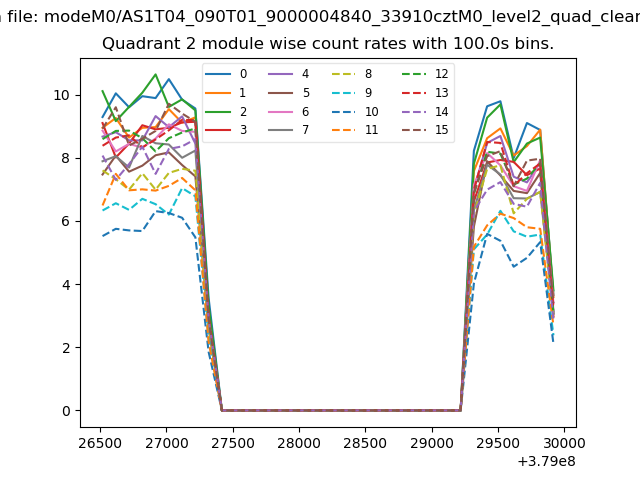
| Module-wise count rates for Quadrant B Data is divided into 100 sec bins |
 |
 |
| Module-wise count rates for Quadrant C Data is divided into 100 sec bins |
 |
 |
| Module-wise count rates for Quadrant D Data is divided into 100 sec bins |
 |
 |
| Parameter | Plot |
|---|---|
| CZT HV Monitor | 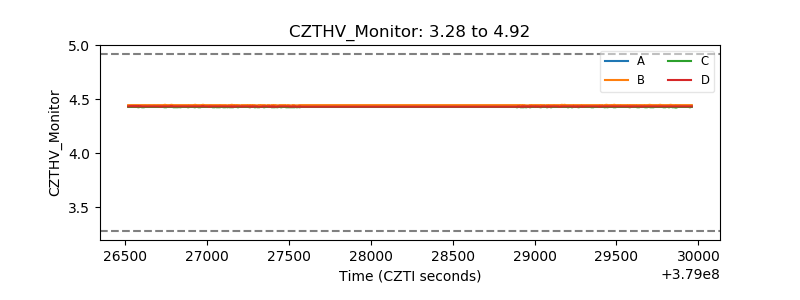 |
| D_VDD | 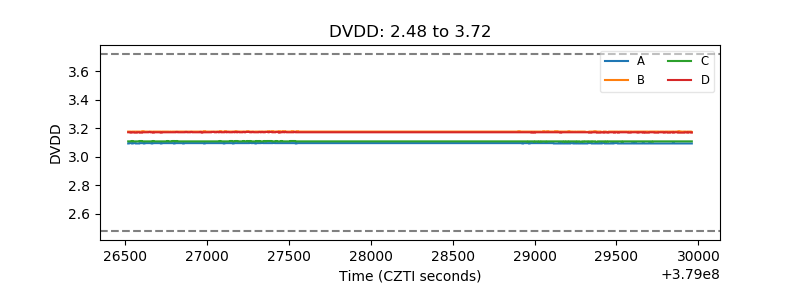 |
| Temperature 1 | 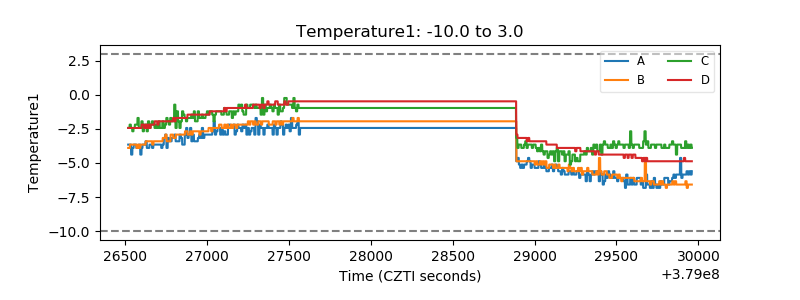 |
| Veto HV Monitor | 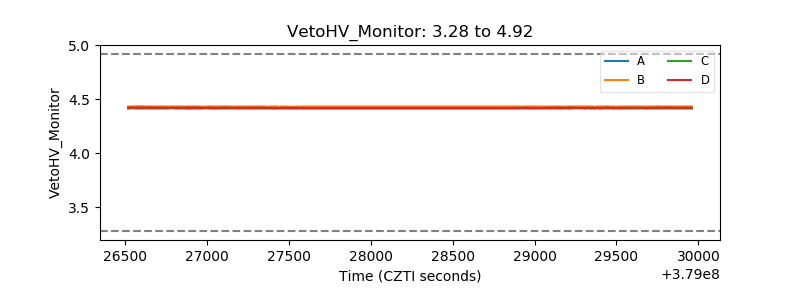 |
| Veto LLD | 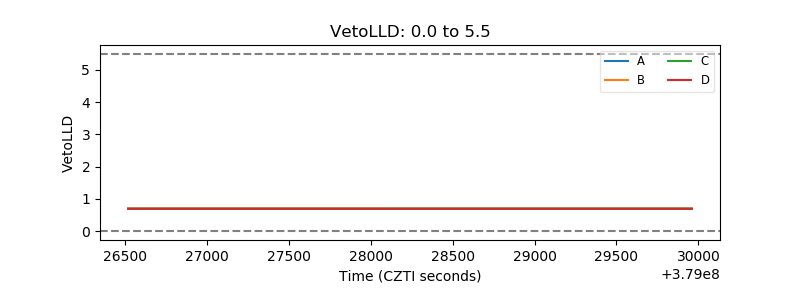 |
| Alpha Counter | 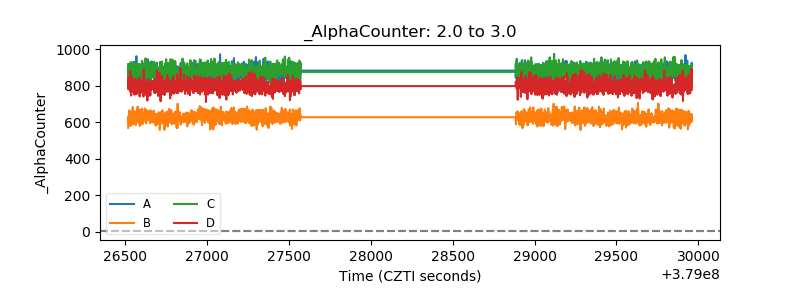 |
| _CPM_Rate | 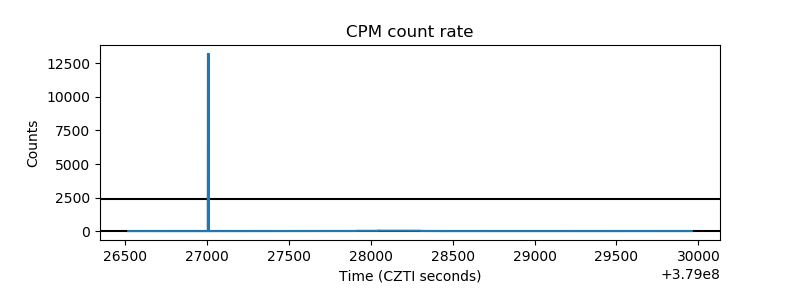 |
| CZT Counter | 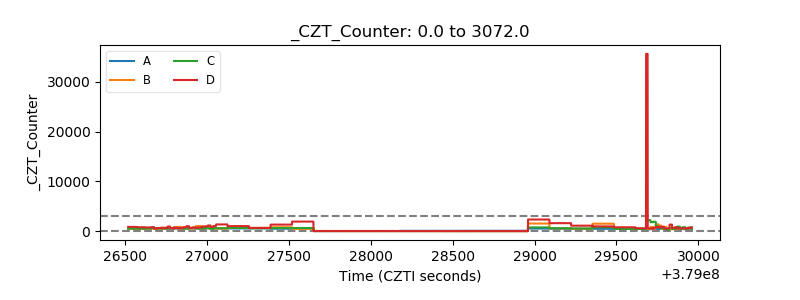 |
| +2.5 Volts monitor |  |
| +5 Volts monitor |  |
| _ROLL_ROT | 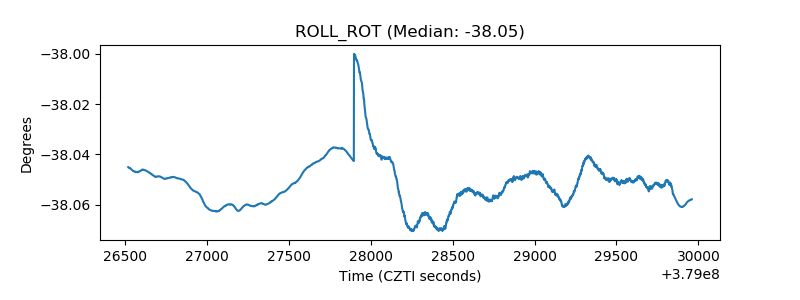 |
| _Roll_DEC | 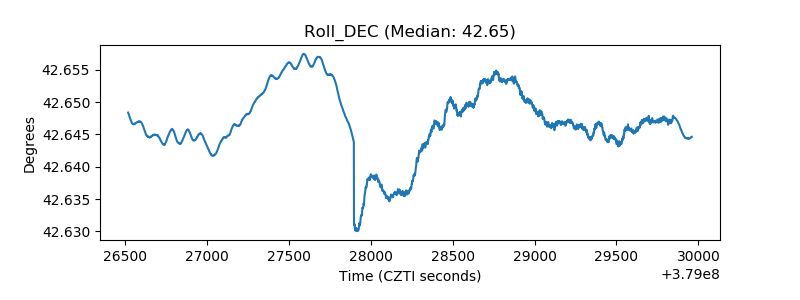 |
| _Roll_RA | 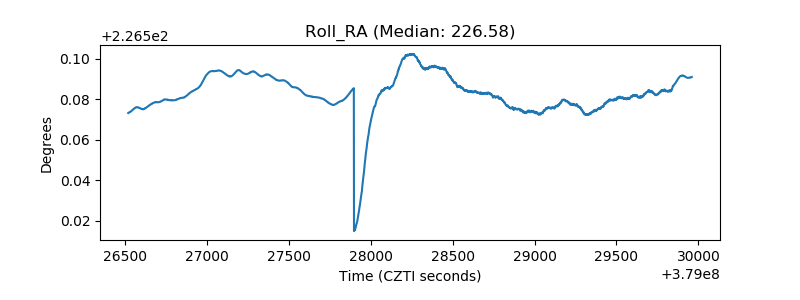 |
| Veto Counter |  |