| Param | Original file | Final file |
|---|---|---|
| Filename | modeM0/AS1T04_090T01_9000004840_34076cztM0_level2.evt | modeM0/AS1T04_090T01_9000004840_34076cztM0_level2_quad_clean.evt |
| Size (bytes) | 548,974,080 | 71,801,280 |
| Size | 523.5 MB | 68.5 MB |
| Events in quadrant A | 2,292,949 | 497,692 |
| Events in quadrant B | 6,736,328 | 426,705 |
| Events in quadrant C | 2,992,274 | 472,651 |
| Events in quadrant D | 4,273,234 | 433,620 |
| Mode M9 | |||
|---|---|---|---|
| Quadrant | BADHDUFLAG | Total packets | Discarded packets |
| A | 0 | 29 | 0 |
| B | 0 | 29 | 0 |
| C | 0 | 29 | 0 |
| D | 0 | 30 | 0 |
| Mode M0 | |||
|---|---|---|---|
| Quadrant | BADHDUFLAG | Total packets | Discarded packets |
| A | 0 | 9829 | 3 |
| B | 0 | 23386 | 2 |
| C | 0 | 11766 | 2 |
| D | 0 | 16153 | 2 |
| Mode SS | |||
|---|---|---|---|
| Quadrant | BADHDUFLAG | Total packets | Discarded packets |
| A | 0 | 102 | 0 |
| B | 0 | 102 | 0 |
| C | 0 | 102 | 0 |
| D | 0 | 102 | 0 |
| Quadrant | Total seconds | Saturated seconds | Saturation percentage |
|---|---|---|---|
| A | 4880 | 4 | 0.081967% |
| B | 4880 | 1393 | 28.545082% |
| C | 4880 | 86 | 1.762295% |
| D | 4880 | 342 | 7.008197% |
Noise dominated data is calculated using 1-second bins in cleaned event files. If a bin has >2000 counts, and if more than 50% of those come from <1% of pixels, then it is considered to be noise-dominated and hence unusable.
| Quadrant | # 1 sec bins | Bins with >0 counts | Bins with >2000 counts | High rate bins dominated by noise | Noise dominated (total time) | Noise dominated (detector-on time) | Marked lightcurve |
|---|---|---|---|---|---|---|---|
| A | 7031 | 4880 | 0 | 0 | 0.00% | 0.00% | 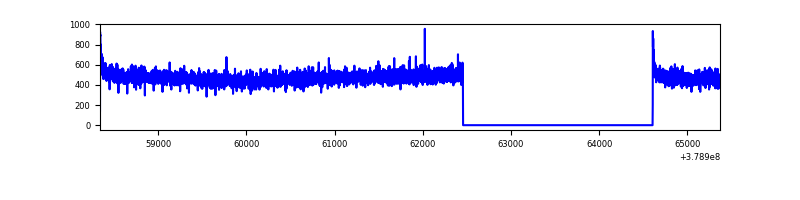 |
| B | 7031 | 4880 | 1205 | 1205 | 17.14% | 24.69% | 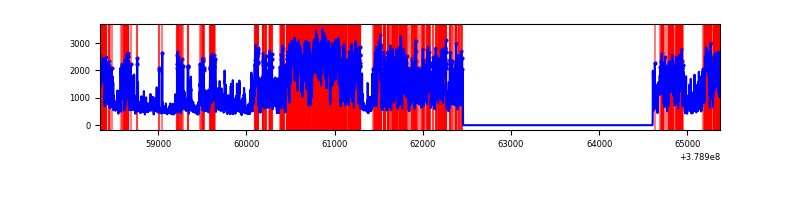 |
| C | 7031 | 4880 | 84 | 84 | 1.19% | 1.72% | 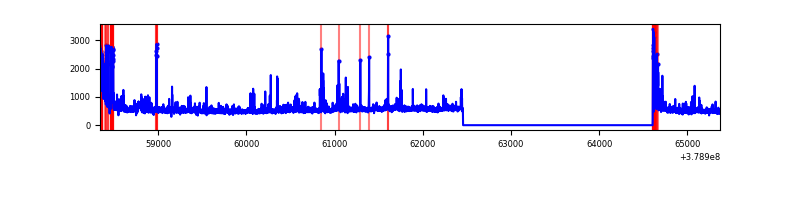 |
| D | 7031 | 4880 | 270 | 270 | 3.84% | 5.53% | 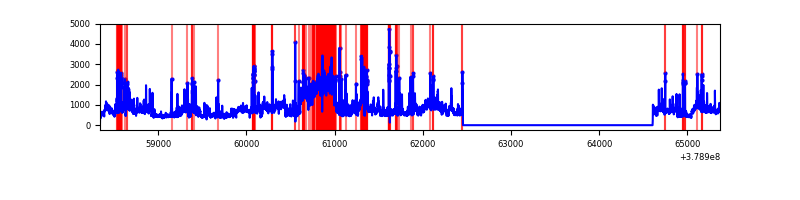 |
Top three noisy pixels from each quadrant. If the there are fewer than three noisy pixels in the level2.evt file, extra rows are filled as -1
| Pixel properties | Quadrant properties | ||||||
|---|---|---|---|---|---|---|---|
| Quadrant | DetID | PixID | Counts | Sigma | Mean | Median | Sigma |
| A | 10 | 83 | 18686 | 155.46 | 586 | 577 | 116.5 |
| A | 13 | 6 | 9319 | 75.05 | 586 | 577 | 116.5 |
| A | 13 | 254 | 8609 | 68.95 | 586 | 577 | 116.5 |
| B | 5 | 31 | 3154210 | 31546.12 | 527 | 514 | 100.0 |
| B | 5 | 15 | 929303 | 9290.59 | 527 | 514 | 100.0 |
| B | 5 | 172 | 281663 | 2812.31 | 527 | 514 | 100.0 |
| C | 0 | 10 | 450077 | 3616.07 | 548 | 553 | 124.3 |
| C | 15 | 214 | 212383 | 1704.01 | 548 | 553 | 124.3 |
| C | 3 | 233 | 102064 | 816.58 | 548 | 553 | 124.3 |
| D | 8 | 195 | 959430 | 7297.35 | 543 | 528 | 131.4 |
| D | 10 | 118 | 464758 | 3532.84 | 543 | 528 | 131.4 |
| D | 2 | 250 | 216475 | 1643.38 | 543 | 528 | 131.4 |
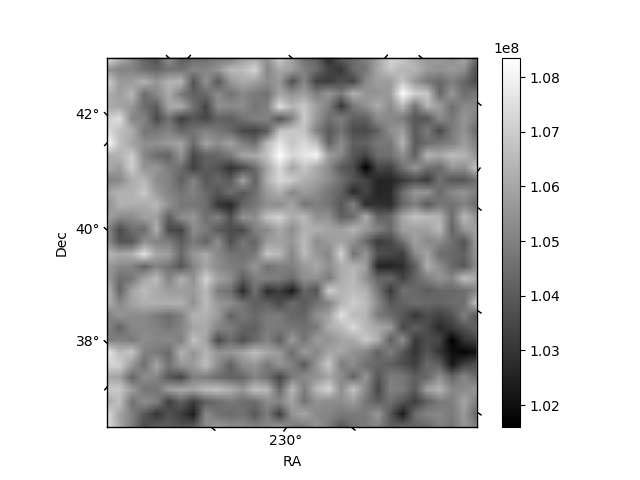
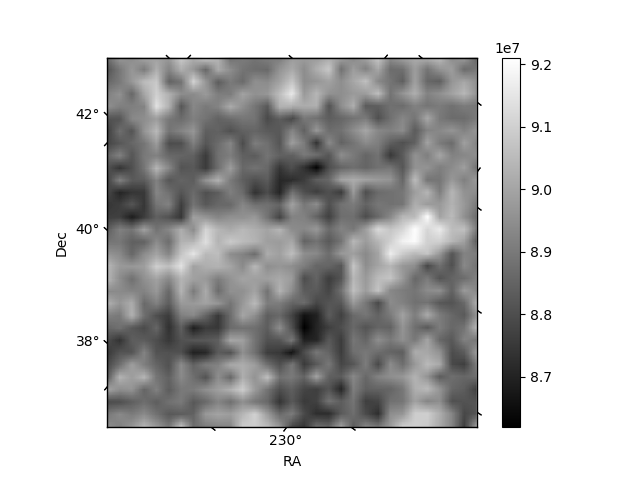
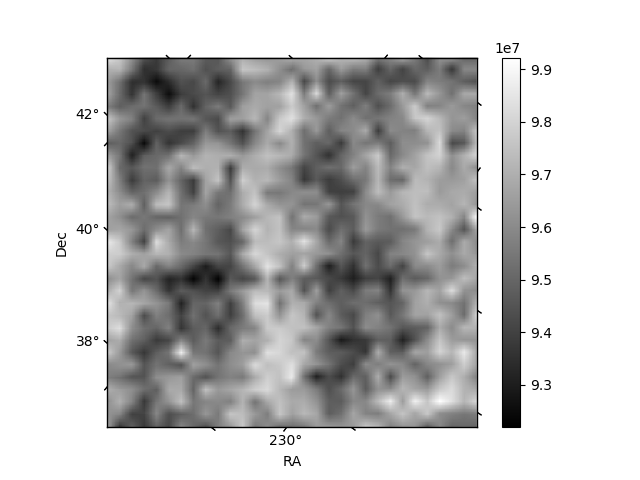
Histogram calculated using DETX and DETY for each event in the final _common_clean file
| Quadrant A | 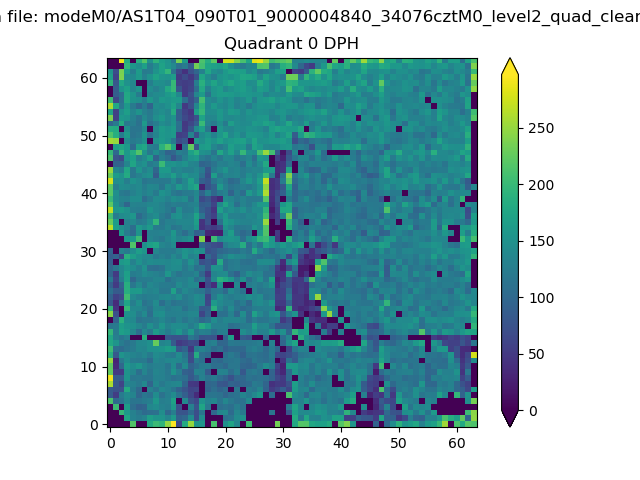 |
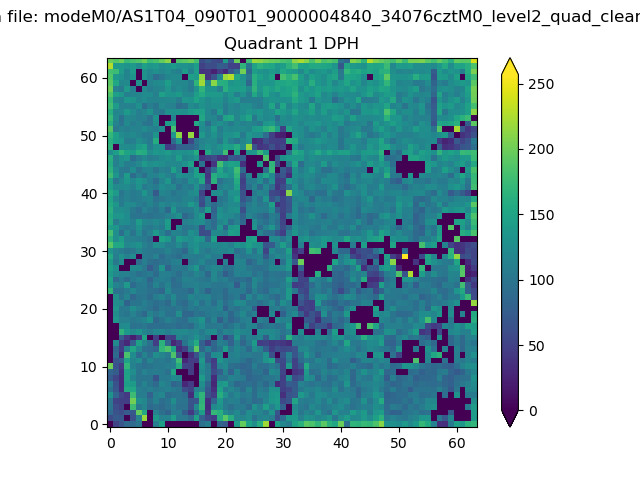 |
Quadrant B |
|---|---|---|---|
| Quadrant D | 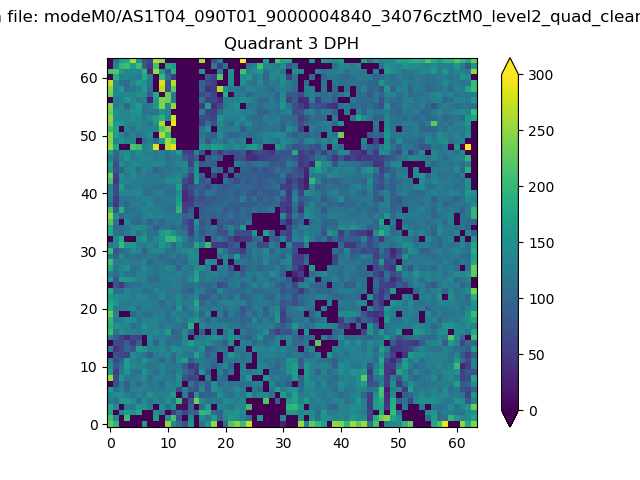 |
 |
Quadrant C |
| Plot type | Count rate plots | Images |
|---|---|---|
| Comparison with Poisson distribution Blue bars denote a histogram of data divided into 1 sec bins. Red curve is a Poisson curve with rate = median count rate of data. |
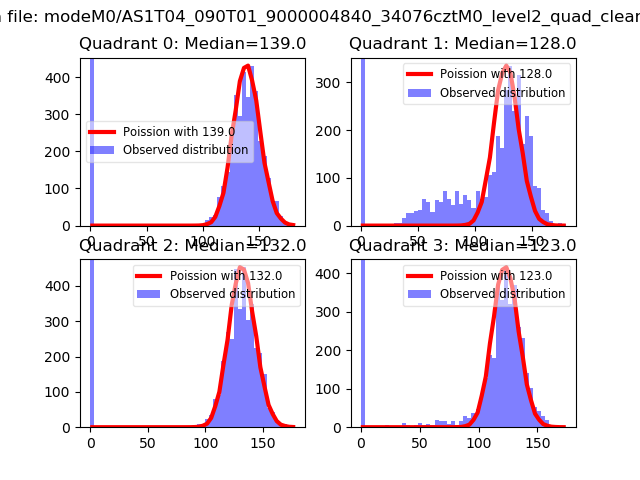 |
 |
| Quadrant-wise count rates Data is divided into 100 sec bins |
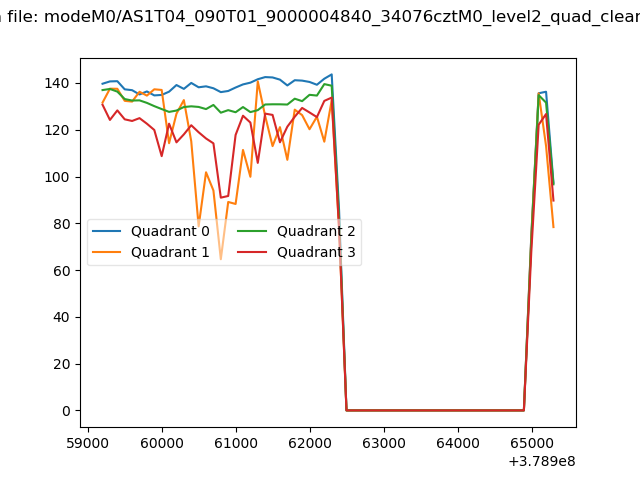 |
|
| Module-wise count rates for Quadrant A Data is divided into 100 sec bins |
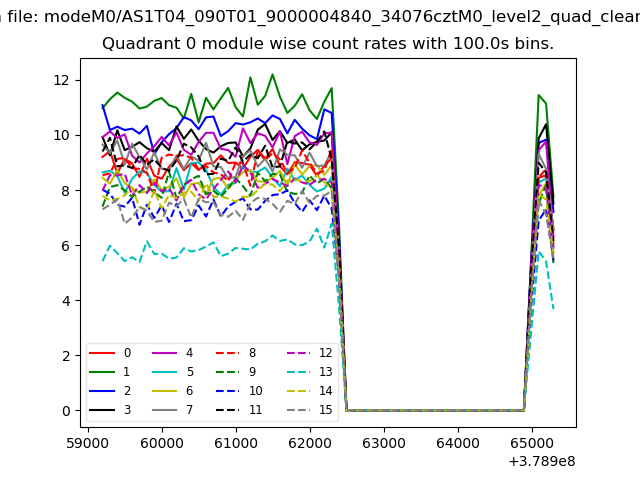 |
 |
| Module-wise count rates for Quadrant B Data is divided into 100 sec bins |
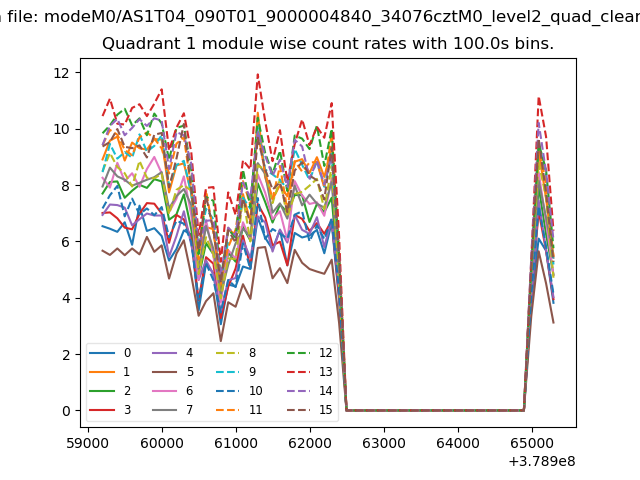 |
 |
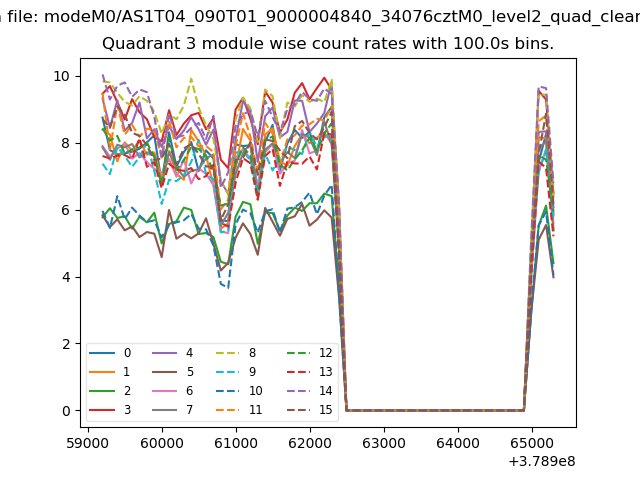
| Module-wise count rates for Quadrant C Data is divided into 100 sec bins |
 |
 |
| Module-wise count rates for Quadrant D Data is divided into 100 sec bins |
 |
 |
| Parameter | Plot |
|---|---|
| CZT HV Monitor | 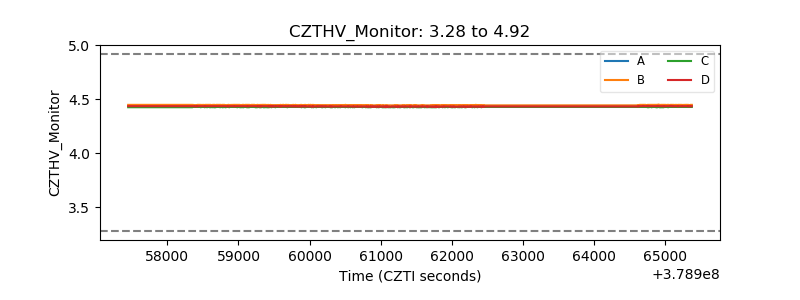 |
| D_VDD | 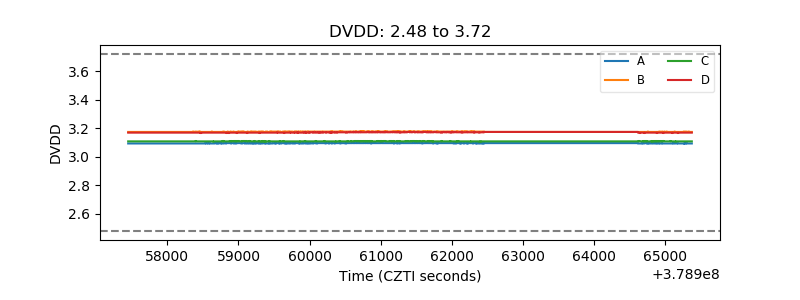 |
| Temperature 1 | 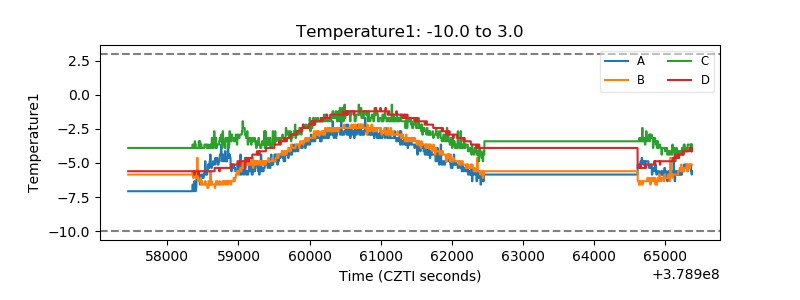 |
| Veto HV Monitor | 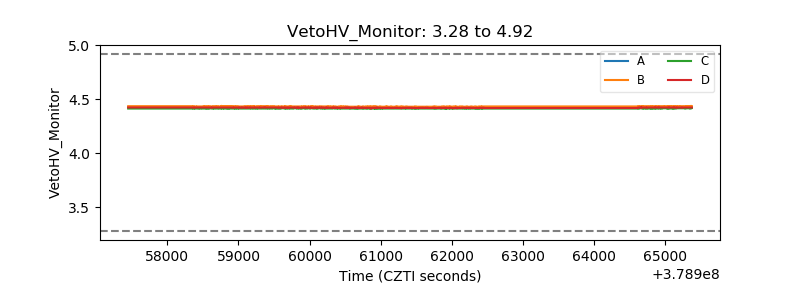 |
| Veto LLD | 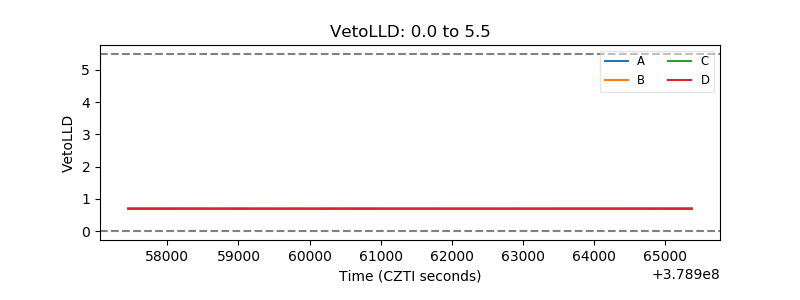 |
| Alpha Counter |  |
| _CPM_Rate |  |
| CZT Counter |  |
| +2.5 Volts monitor |  |
| +5 Volts monitor |  |
| _ROLL_ROT | 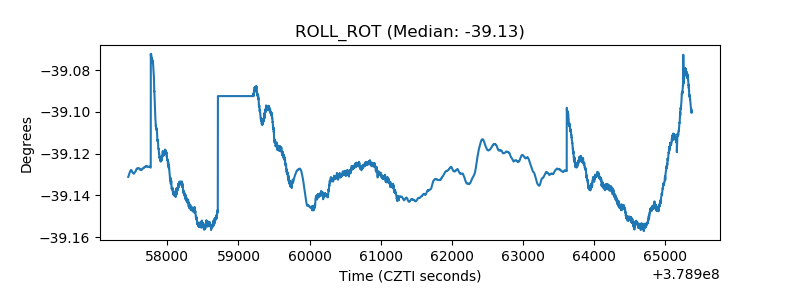 |
| _Roll_DEC | 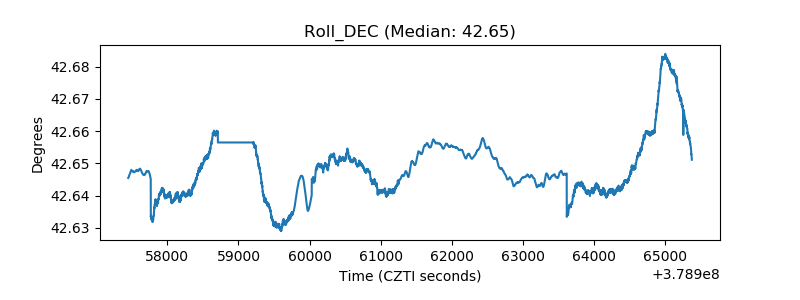 |
| _Roll_RA |  |
| Veto Counter | 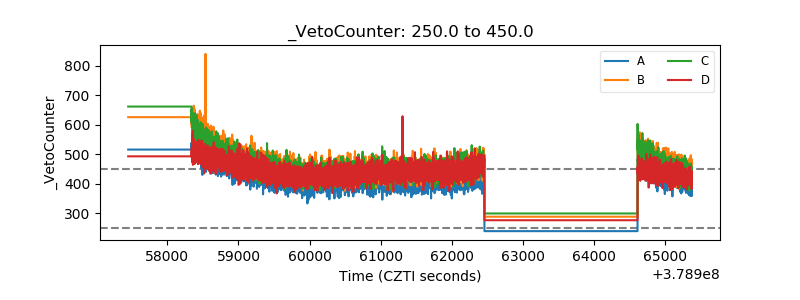 |