| Param | Original file | Final file |
|---|---|---|
| Filename | modeM0/AS1T04_091T01_9000004842_33910cztM0_level2.evt | modeM0/AS1T04_091T01_9000004842_33910cztM0_level2_quad_clean.evt |
| Size (bytes) | 683,962,560 | 95,397,120 |
| Size | 652.3 MB | 91.0 MB |
| Events in quadrant A | 5,191,241 | 582,883 |
| Events in quadrant B | 4,521,646 | 607,734 |
| Events in quadrant C | 4,051,676 | 608,053 |
| Events in quadrant D | 6,442,427 | 568,451 |
| Mode SS | |||
|---|---|---|---|
| Quadrant | BADHDUFLAG | Total packets | Discarded packets |
| A | 0 | 152 | 2 |
| B | 0 | 152 | 0 |
| C | 0 | 152 | 0 |
| D | 0 | 152 | 4 |
| Mode M9 | |||
|---|---|---|---|
| Quadrant | BADHDUFLAG | Total packets | Discarded packets |
| A | 0 | 14 | 0 |
| B | 0 | 14 | 1 |
| C | 0 | 14 | 0 |
| D | 0 | 14 | 1 |
| Mode M0 | |||
|---|---|---|---|
| Quadrant | BADHDUFLAG | Total packets | Discarded packets |
| A | 0 | 20369 | 47 |
| B | 0 | 18664 | 68 |
| C | 0 | 16710 | 25 |
| D | 0 | 24323 | 83 |
| Quadrant | Total seconds | Saturated seconds | Saturation percentage |
|---|---|---|---|
| A | 7499 | 423 | 5.640752% |
| B | 7498 | 371 | 4.947986% |
| C | 7507 | 61 | 0.812575% |
| D | 7494 | 449 | 5.991460% |
Noise dominated data is calculated using 1-second bins in cleaned event files. If a bin has >2000 counts, and if more than 50% of those come from <1% of pixels, then it is considered to be noise-dominated and hence unusable.
| Quadrant | # 1 sec bins | Bins with >0 counts | Bins with >2000 counts | High rate bins dominated by noise | Noise dominated (total time) | Noise dominated (detector-on time) | Marked lightcurve |
|---|---|---|---|---|---|---|---|
| A | 8892 | 7520 | 419 | 419 | 4.71% | 5.57% | 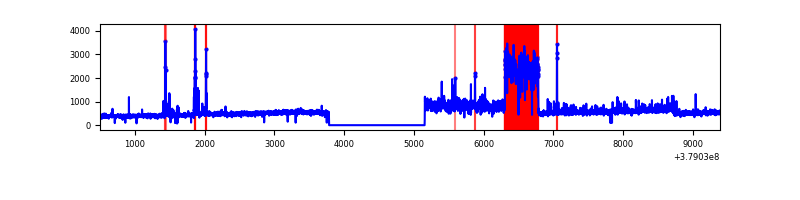 |
| B | 8892 | 7519 | 197 | 197 | 2.22% | 2.62% | 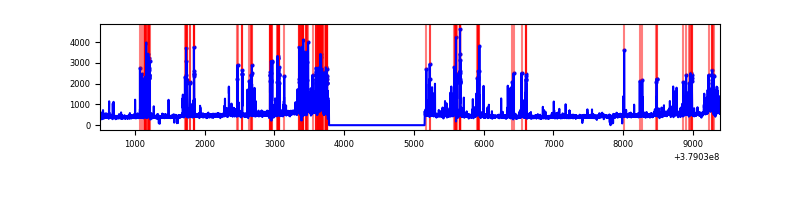 |
| C | 8892 | 7520 | 39 | 39 | 0.44% | 0.52% | 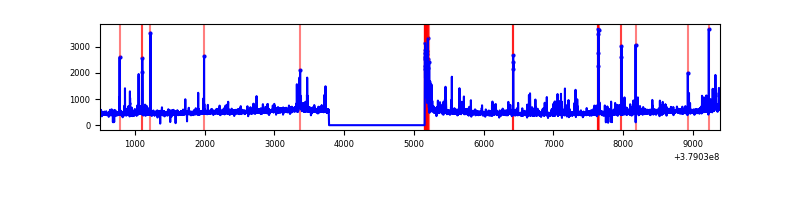 |
| D | 8892 | 7519 | 259 | 259 | 2.91% | 3.44% | 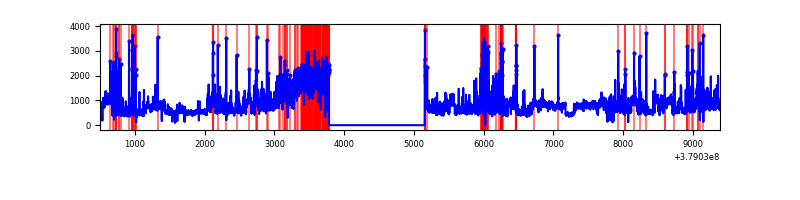 |
Top three noisy pixels from each quadrant. If the there are fewer than three noisy pixels in the level2.evt file, extra rows are filled as -1
| Pixel properties | Quadrant properties | ||||||
|---|---|---|---|---|---|---|---|
| Quadrant | DetID | PixID | Counts | Sigma | Mean | Median | Sigma |
| A | 15 | 169 | 1780245 | 10526.62 | 843 | 824 | 169.0 |
| A | 7 | 16 | 136830 | 804.58 | 843 | 824 | 169.0 |
| A | 13 | 254 | 12660 | 70.02 | 843 | 824 | 169.0 |
| B | 5 | 172 | 1064793 | 6665.79 | 830 | 808 | 159.6 |
| B | 4 | 170 | 24408 | 147.85 | 830 | 808 | 159.6 |
| B | 0 | 219 | 24333 | 147.38 | 830 | 808 | 159.6 |
| C | 15 | 214 | 322630 | 1682.99 | 825 | 830 | 191.2 |
| C | 0 | 207 | 225119 | 1173.01 | 825 | 830 | 191.2 |
| C | 0 | 10 | 208097 | 1083.99 | 825 | 830 | 191.2 |
| D | 8 | 195 | 1481454 | 7433.78 | 815 | 792 | 199.2 |
| D | 1 | 52 | 1035444 | 5194.55 | 815 | 792 | 199.2 |
| D | 13 | 249 | 439848 | 2204.32 | 815 | 792 | 199.2 |
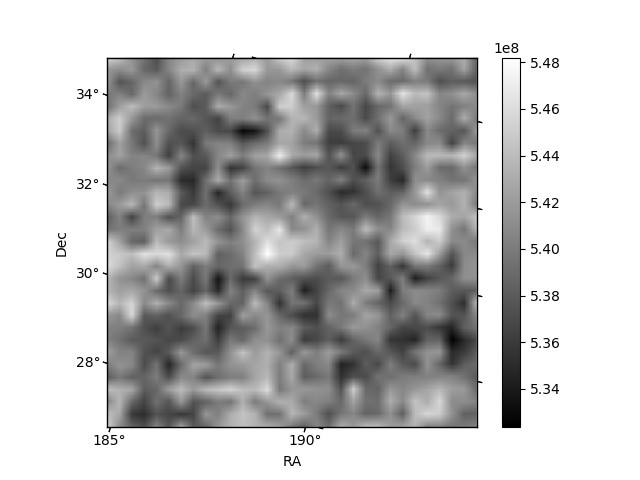
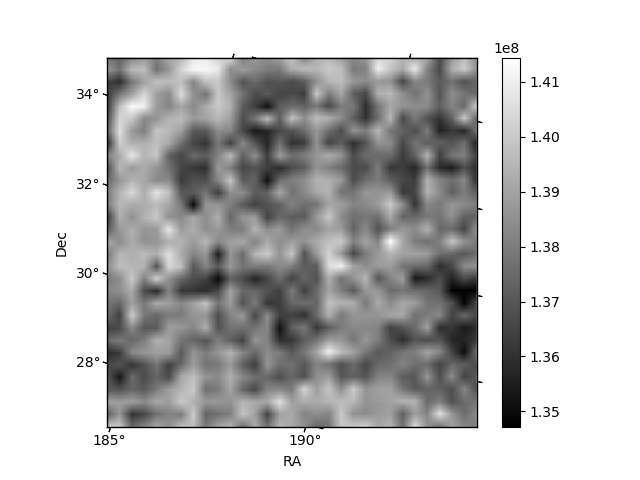
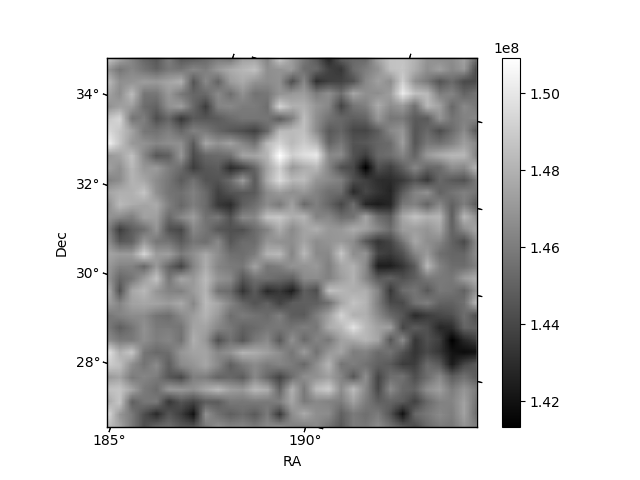
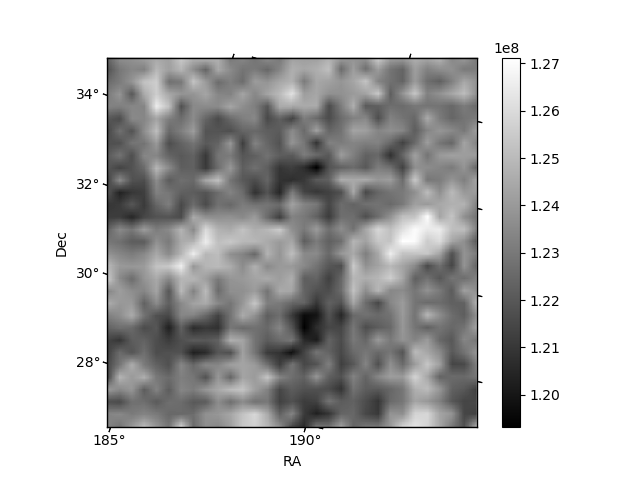
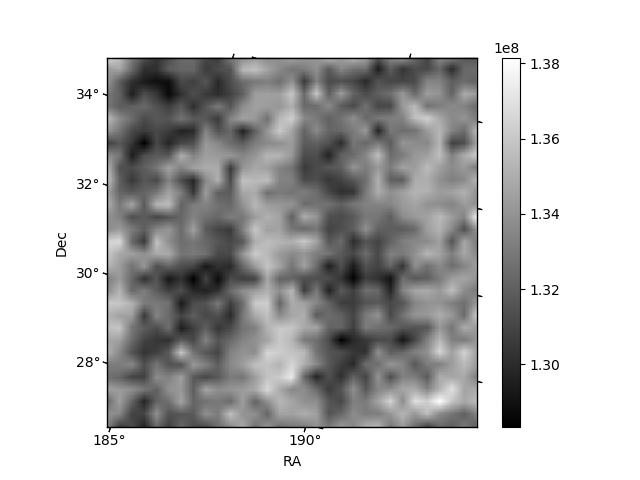
Histogram calculated using DETX and DETY for each event in the final _common_clean file
| Quadrant A | 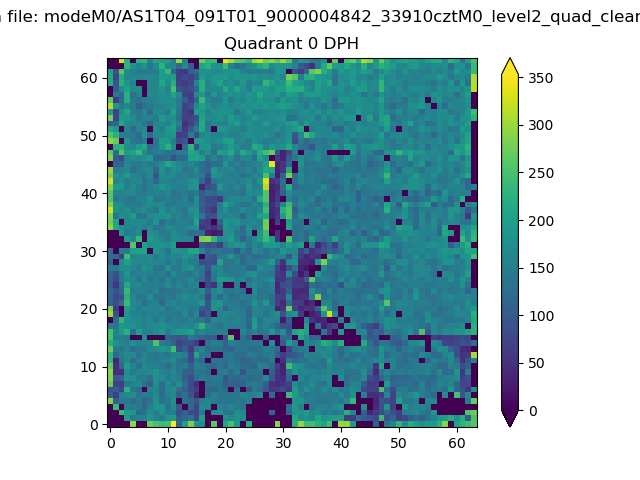 |
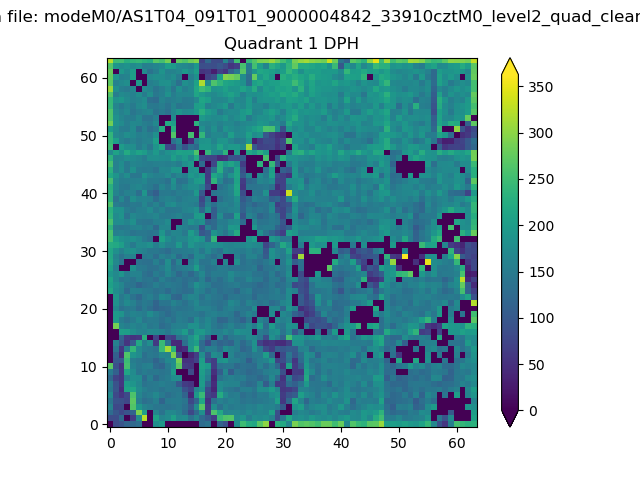 |
Quadrant B |
|---|---|---|---|
| Quadrant D | 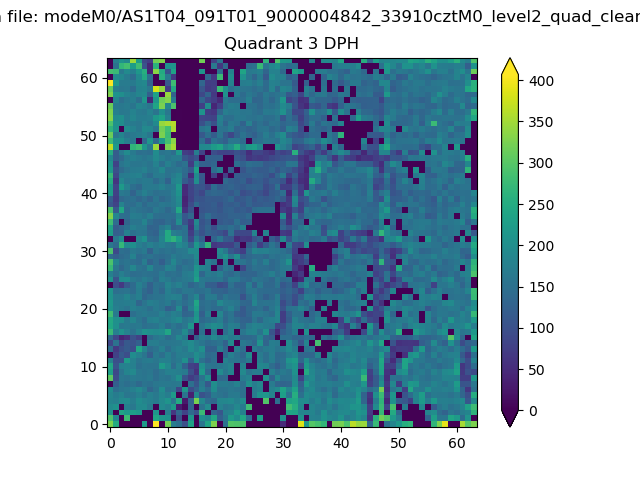 |
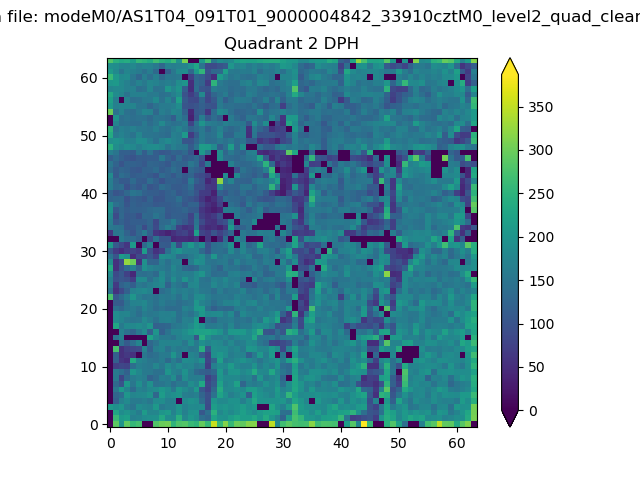 |
Quadrant C |
| Plot type | Count rate plots | Images |
|---|---|---|
| Comparison with Poisson distribution Blue bars denote a histogram of data divided into 1 sec bins. Red curve is a Poisson curve with rate = median count rate of data. |
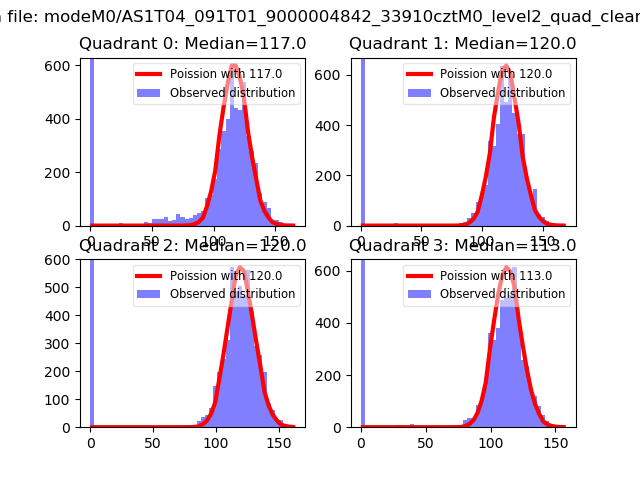 |
 |
| Quadrant-wise count rates Data is divided into 100 sec bins |
 |
|
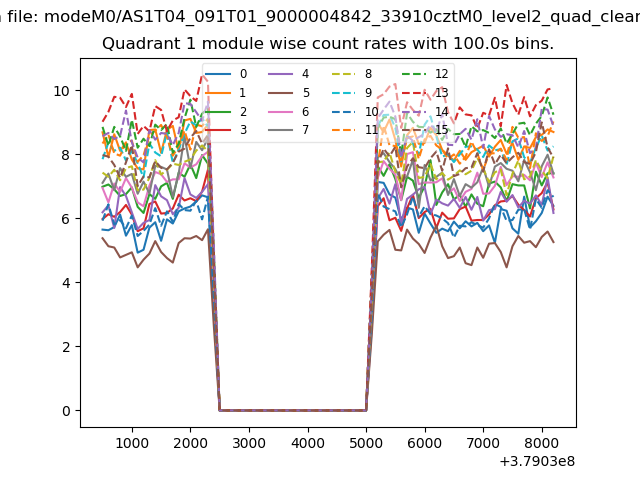
| Module-wise count rates for Quadrant A Data is divided into 100 sec bins |
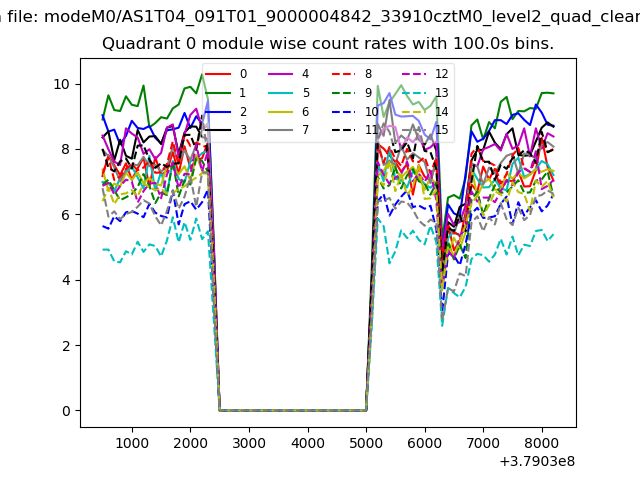 |
 |
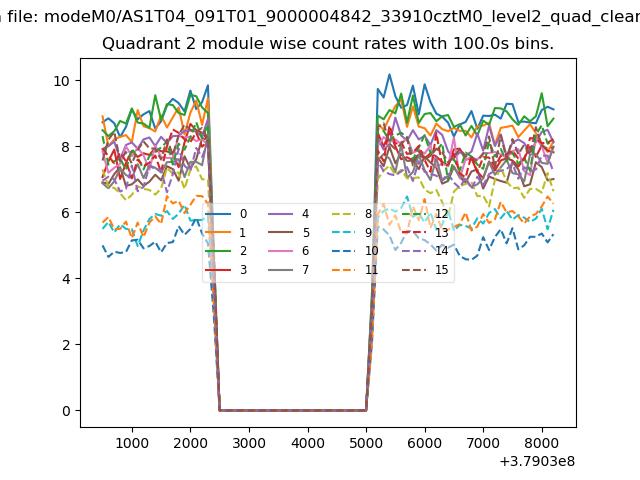
| Module-wise count rates for Quadrant B Data is divided into 100 sec bins |
 |
 |
| Module-wise count rates for Quadrant C Data is divided into 100 sec bins |
 |
 |
| Module-wise count rates for Quadrant D Data is divided into 100 sec bins |
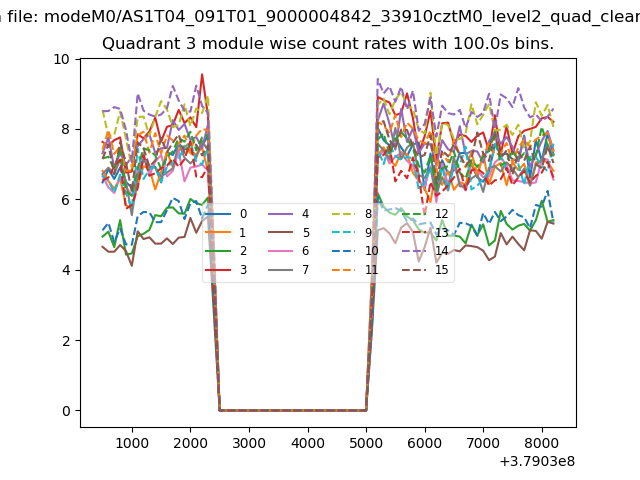 |
 |
| Parameter | Plot |
|---|---|
| CZT HV Monitor | 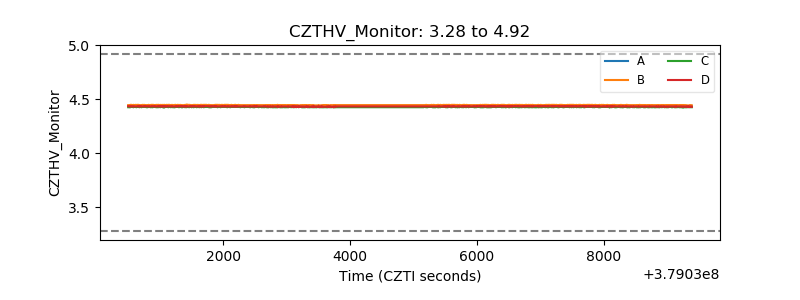 |
| D_VDD | 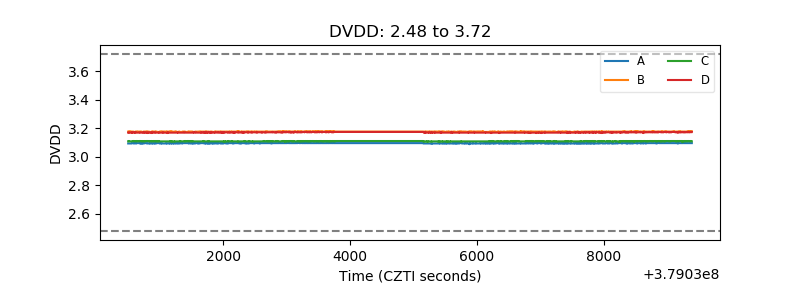 |
| Temperature 1 |  |
| Veto HV Monitor | 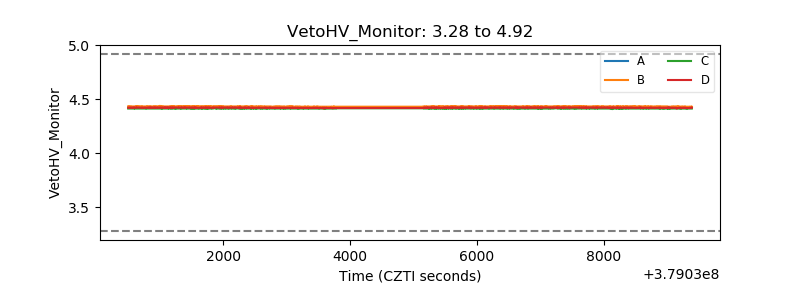 |
| Veto LLD | 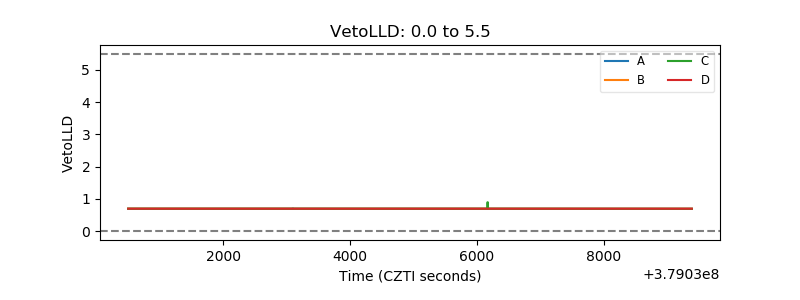 |
| Alpha Counter | 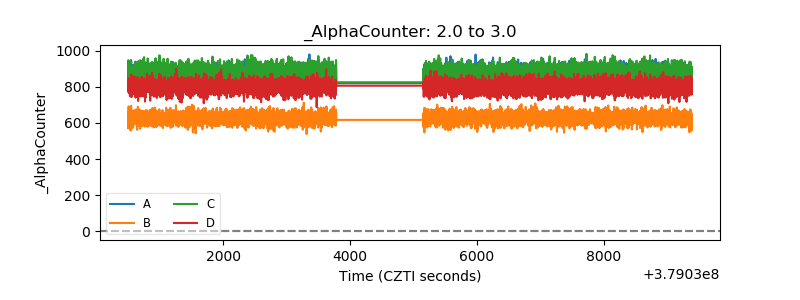 |
| _CPM_Rate | 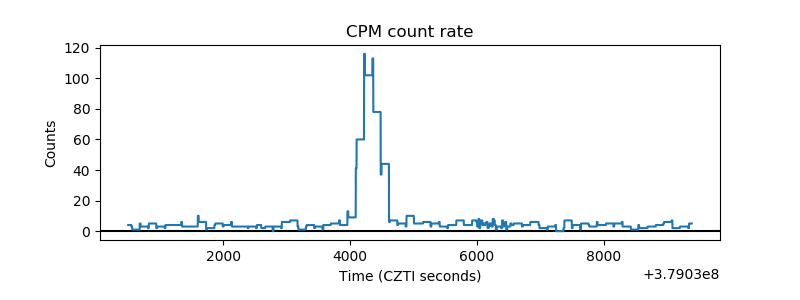 |
| CZT Counter | 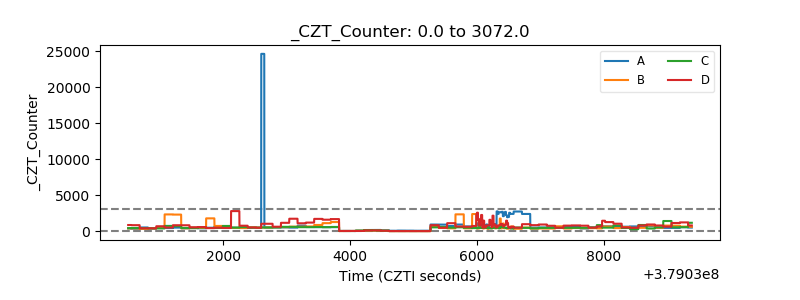 |
| +2.5 Volts monitor |  |
| +5 Volts monitor |  |
| _ROLL_ROT | 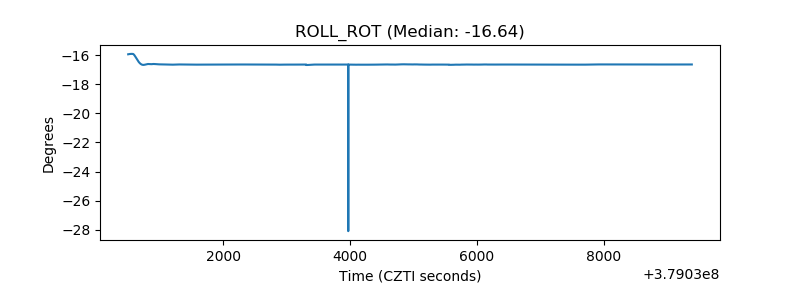 |
| _Roll_DEC | 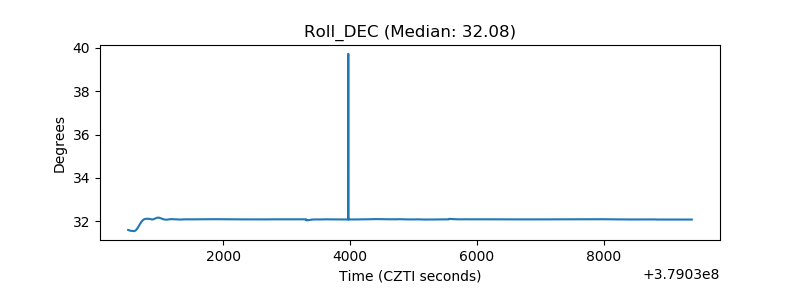 |
| _Roll_RA | 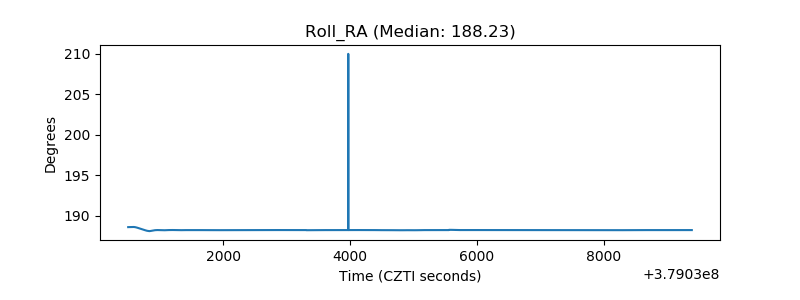 |
| Veto Counter | 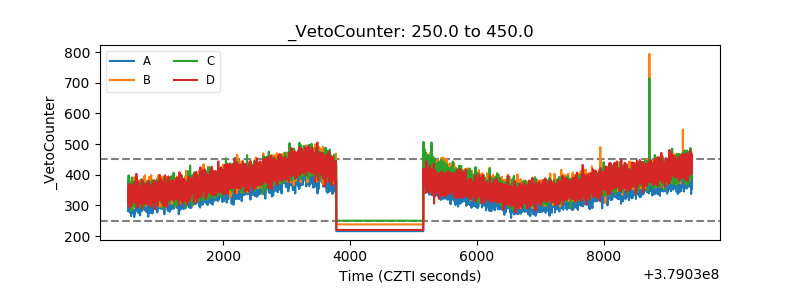 |