| Param | Original file | Final file |
|---|---|---|
| Filename | modeM0/AS1T04_091T01_9000004842_33911cztM0_level2.evt | modeM0/AS1T04_091T01_9000004842_33911cztM0_level2_quad_clean.evt |
| Size (bytes) | 2,101,809,600 | 211,014,720 |
| Size | 2.0 GB | 201.2 MB |
| Events in quadrant A | 20,275,219 | 1,067,672 |
| Events in quadrant B | 10,946,451 | 1,397,624 |
| Events in quadrant C | 10,213,454 | 1,385,760 |
| Events in quadrant D | 20,979,902 | 1,267,597 |
| Mode SS | |||
|---|---|---|---|
| Quadrant | BADHDUFLAG | Total packets | Discarded packets |
| A | 0 | 376 | 0 |
| B | 0 | 376 | 0 |
| C | 0 | 376 | 0 |
| D | 0 | 376 | 0 |
| Mode M9 | |||
|---|---|---|---|
| Quadrant | BADHDUFLAG | Total packets | Discarded packets |
| A | 0 | 62 | 0 |
| B | 0 | 62 | 0 |
| C | 0 | 62 | 0 |
| D | 0 | 62 | 0 |
| Mode M0 | |||
|---|---|---|---|
| Quadrant | BADHDUFLAG | Total packets | Discarded packets |
| A | 0 | 72573 | 11 |
| B | 0 | 44870 | 3 |
| C | 0 | 41761 | 3 |
| D | 0 | 74901 | 3 |
| Quadrant | Total seconds | Saturated seconds | Saturation percentage |
|---|---|---|---|
| A | 18436 | 4911 | 26.638099% |
| B | 18437 | 740 | 4.013668% |
| C | 18437 | 194 | 1.052232% |
| D | 18437 | 2953 | 16.016706% |
Noise dominated data is calculated using 1-second bins in cleaned event files. If a bin has >2000 counts, and if more than 50% of those come from <1% of pixels, then it is considered to be noise-dominated and hence unusable.
| Quadrant | # 1 sec bins | Bins with >0 counts | Bins with >2000 counts | High rate bins dominated by noise | Noise dominated (total time) | Noise dominated (detector-on time) | Marked lightcurve |
|---|---|---|---|---|---|---|---|
| A | 24586 | 18434 | 3448 | 3448 | 14.02% | 18.70% | 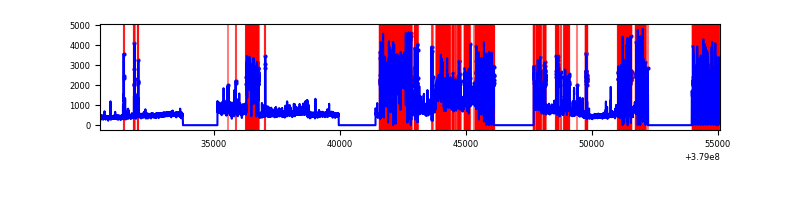 |
| B | 24587 | 18441 | 406 | 406 | 1.65% | 2.20% | 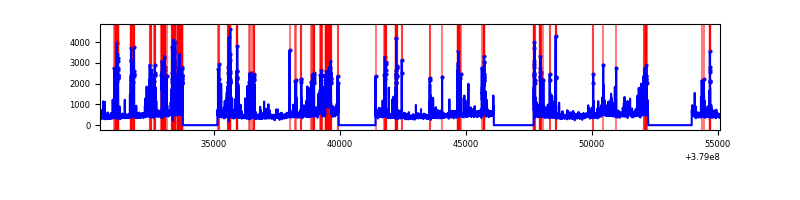 |
| C | 24587 | 18441 | 138 | 138 | 0.56% | 0.75% | 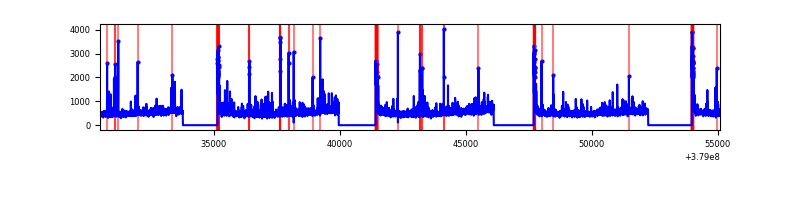 |
| D | 24587 | 18439 | 2248 | 2248 | 9.14% | 12.19% | 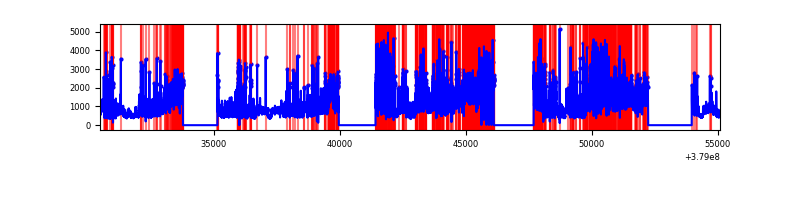 |
Top three noisy pixels from each quadrant. If the there are fewer than three noisy pixels in the level2.evt file, extra rows are filled as -1
| Pixel properties | Quadrant properties | ||||||
|---|---|---|---|---|---|---|---|
| Quadrant | DetID | PixID | Counts | Sigma | Mean | Median | Sigma |
| A | 15 | 169 | 13313728 | 38552.81 | 1740 | 1702 | 345.3 |
| A | 7 | 16 | 198932 | 571.2 | 1740 | 1702 | 345.3 |
| A | 13 | 254 | 25035 | 67.57 | 1740 | 1702 | 345.3 |
| B | 5 | 172 | 1941348 | 4922.49 | 2083 | 2027 | 394.0 |
| B | 4 | 251 | 261713 | 659.15 | 2083 | 2027 | 394.0 |
| B | 0 | 219 | 97136 | 241.41 | 2083 | 2027 | 394.0 |
| C | 15 | 214 | 800196 | 1696.43 | 2058 | 2070 | 470.5 |
| C | 0 | 10 | 587580 | 1244.51 | 2058 | 2070 | 470.5 |
| C | 0 | 207 | 400559 | 846.99 | 2058 | 2070 | 470.5 |
| D | 8 | 195 | 4398231 | 9438.21 | 1918 | 1868 | 465.8 |
| D | 1 | 52 | 2998245 | 6432.69 | 1918 | 1868 | 465.8 |
| D | 12 | 235 | 2959571 | 6349.66 | 1918 | 1868 | 465.8 |
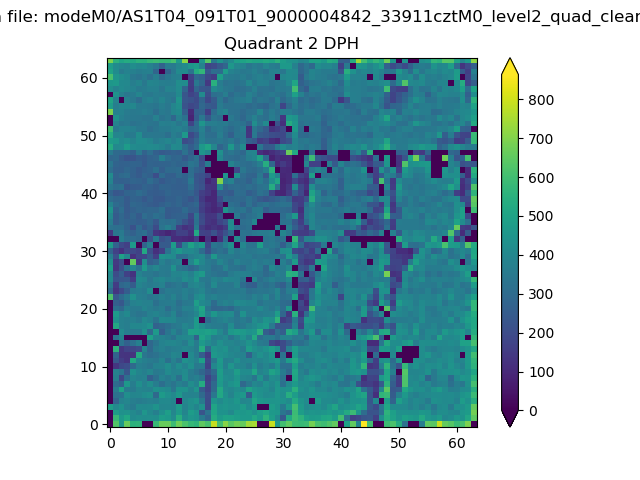
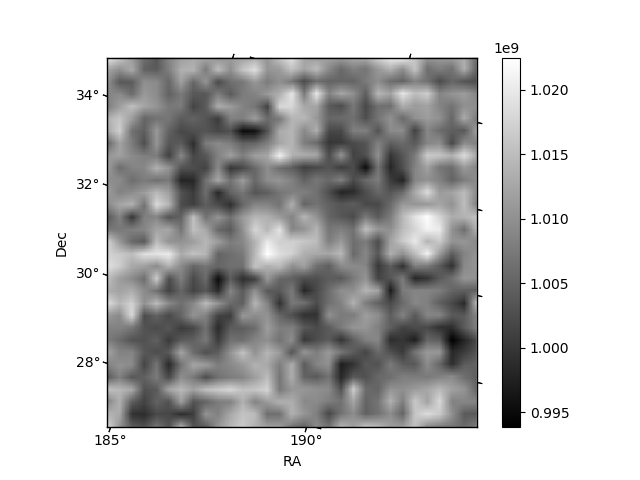
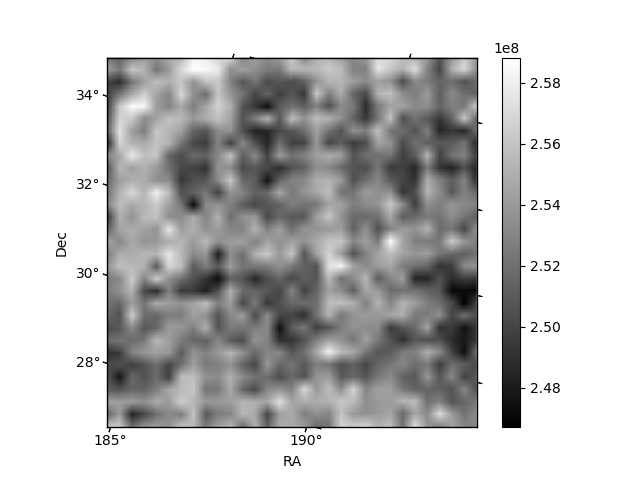
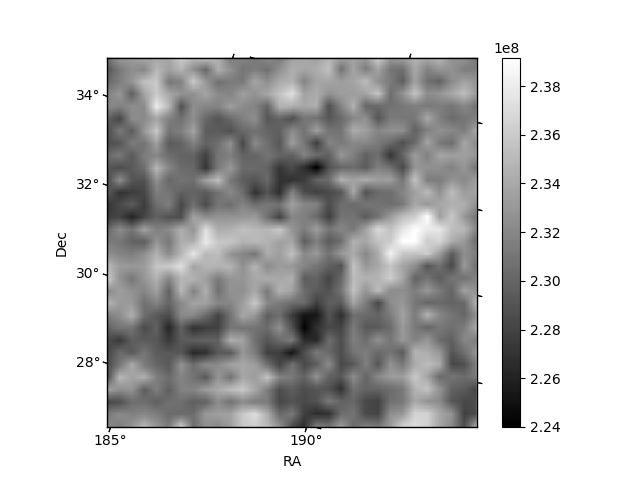
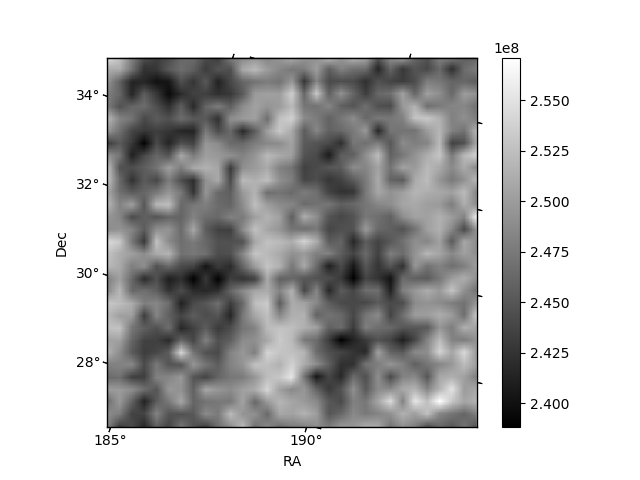
Histogram calculated using DETX and DETY for each event in the final _common_clean file
| Quadrant A | 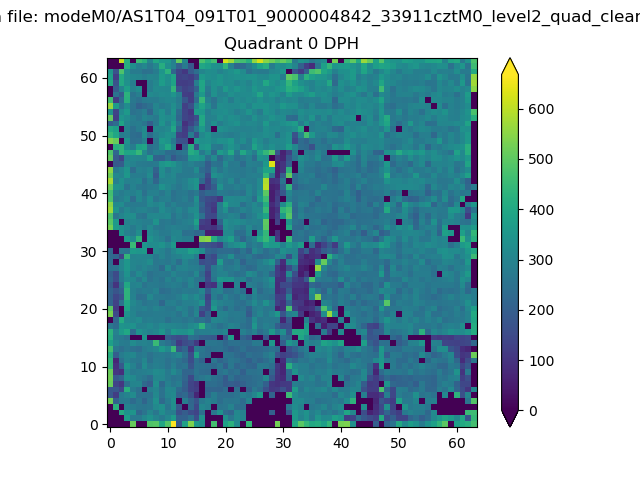 |
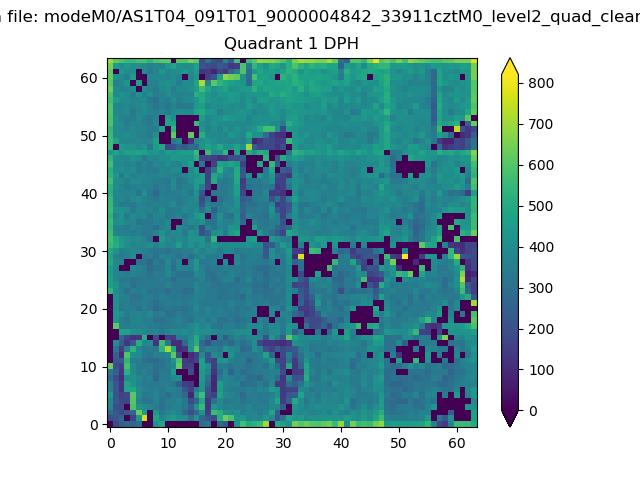 |
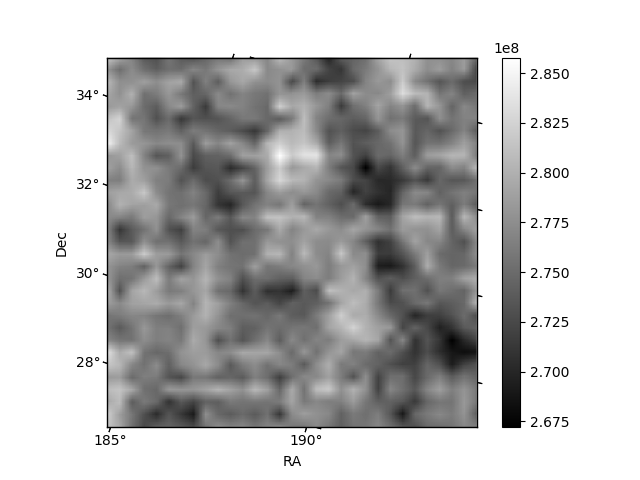
Quadrant B |
|---|---|---|---|
| Quadrant D | 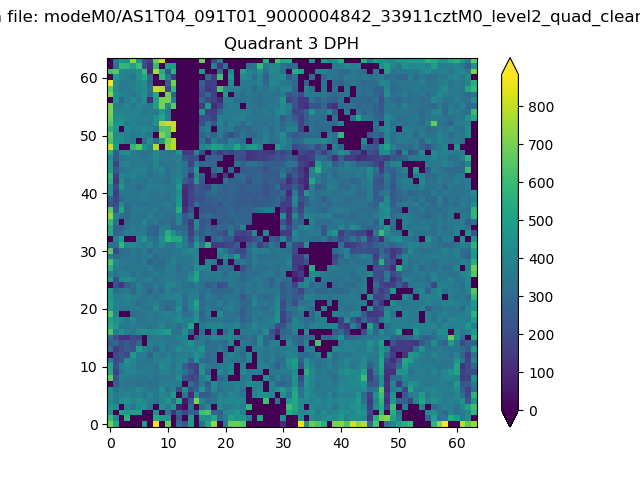 |
 |
Quadrant C |
| Plot type | Count rate plots | Images |
|---|---|---|
| Comparison with Poisson distribution Blue bars denote a histogram of data divided into 1 sec bins. Red curve is a Poisson curve with rate = median count rate of data. |
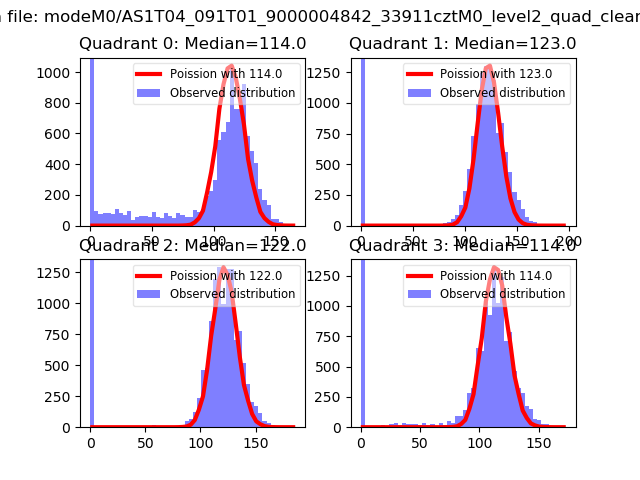 |
 |
| Quadrant-wise count rates Data is divided into 100 sec bins |
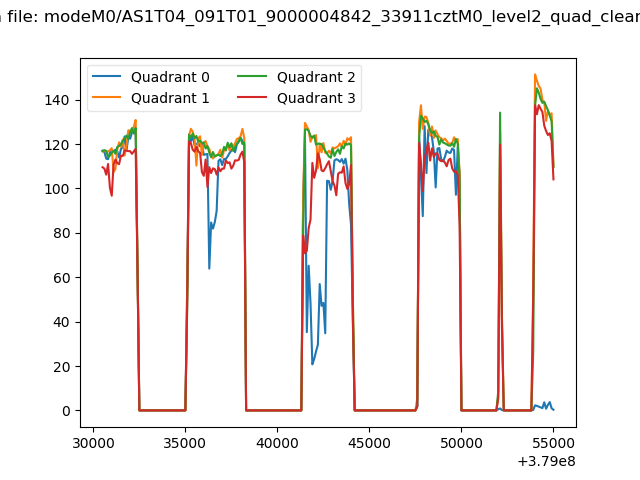 |
|
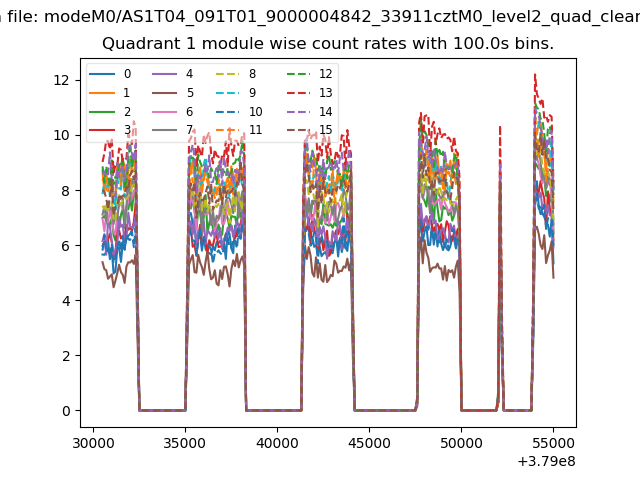
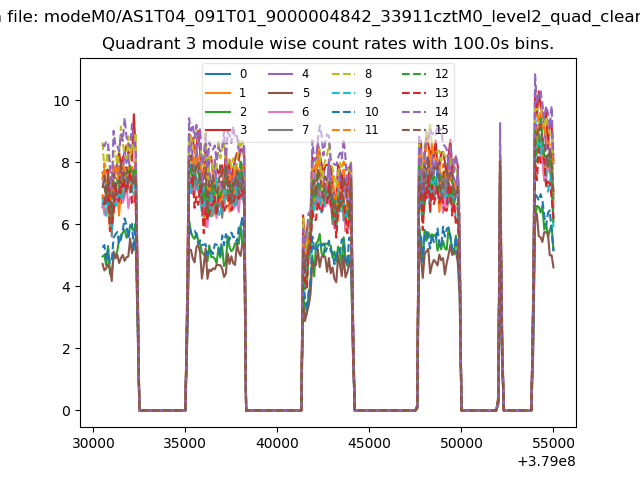
| Module-wise count rates for Quadrant A Data is divided into 100 sec bins |
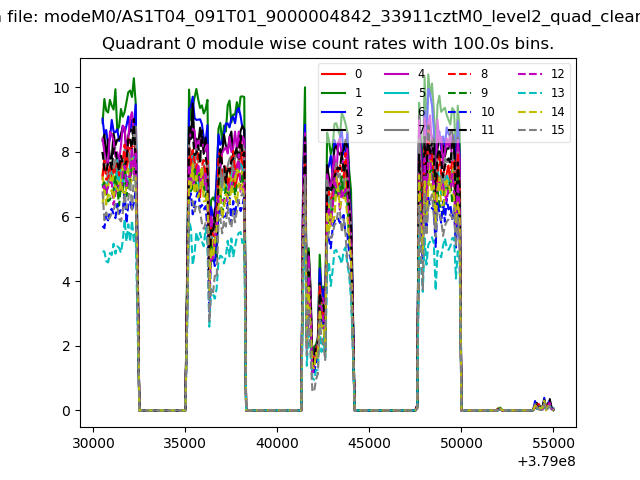 |
 |
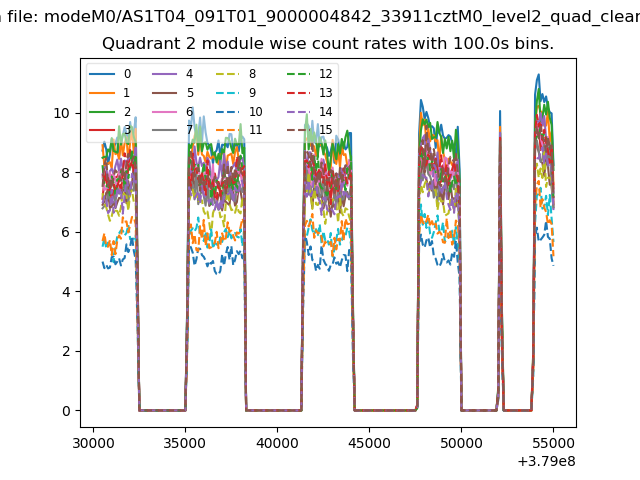
| Module-wise count rates for Quadrant B Data is divided into 100 sec bins |
 |
 |
| Module-wise count rates for Quadrant C Data is divided into 100 sec bins |
 |
 |
| Module-wise count rates for Quadrant D Data is divided into 100 sec bins |
 |
 |
| Parameter | Plot |
|---|---|
| CZT HV Monitor | 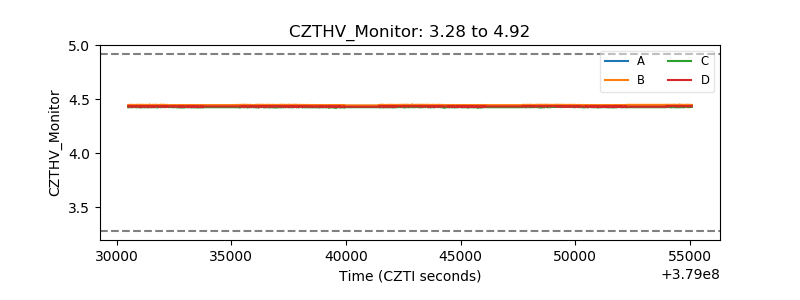 |
| D_VDD | 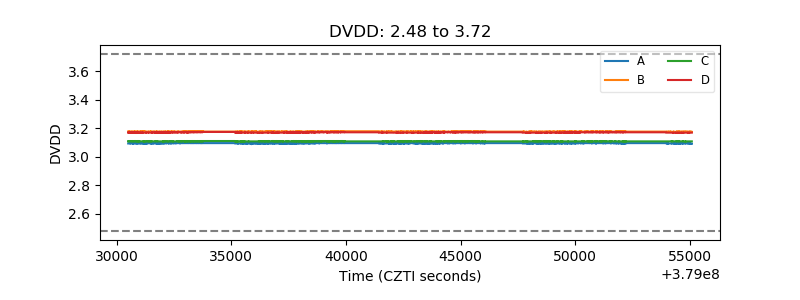 |
| Temperature 1 |  |
| Veto HV Monitor | 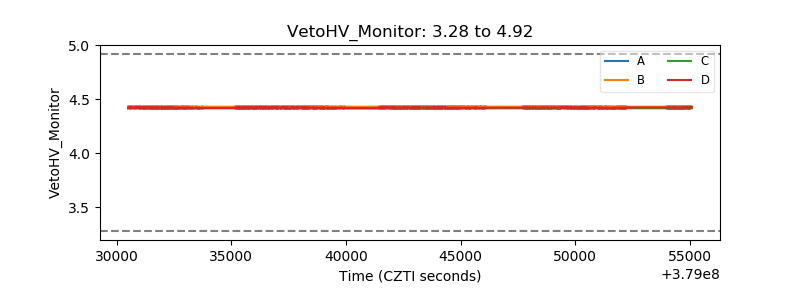 |
| Veto LLD | 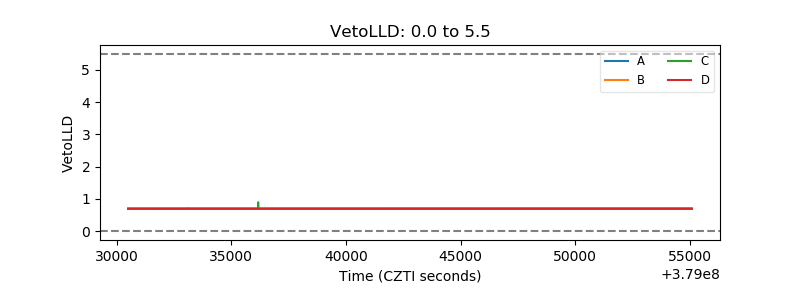 |
| Alpha Counter | 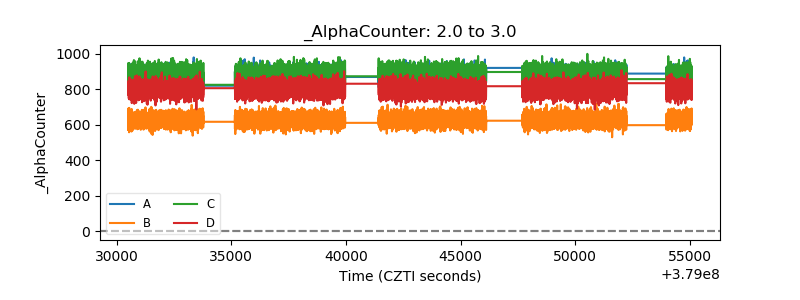 |
| _CPM_Rate | 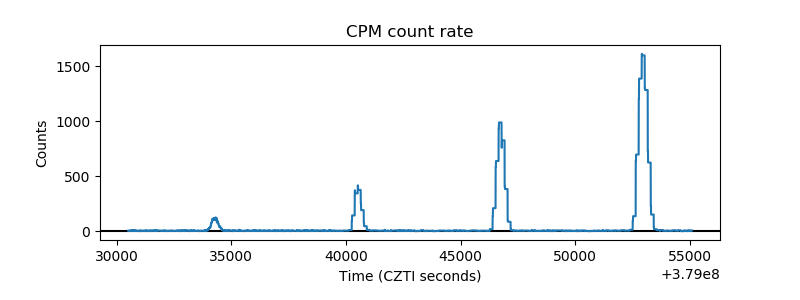 |
| CZT Counter | 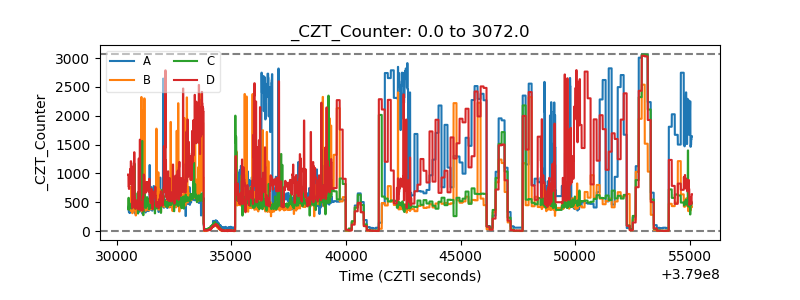 |
| +2.5 Volts monitor |  |
| +5 Volts monitor | 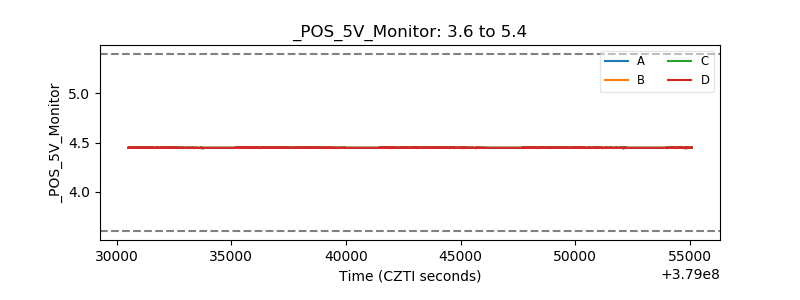 |
| _ROLL_ROT | 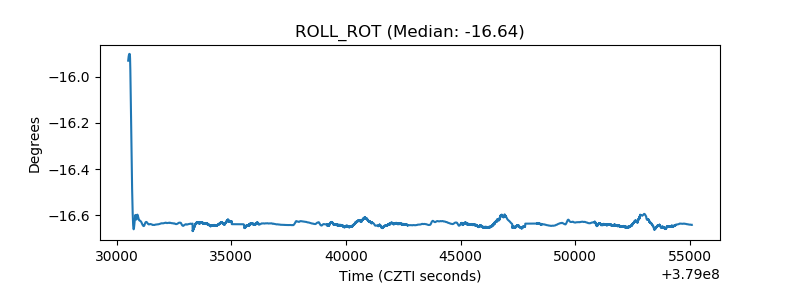 |
| _Roll_DEC | 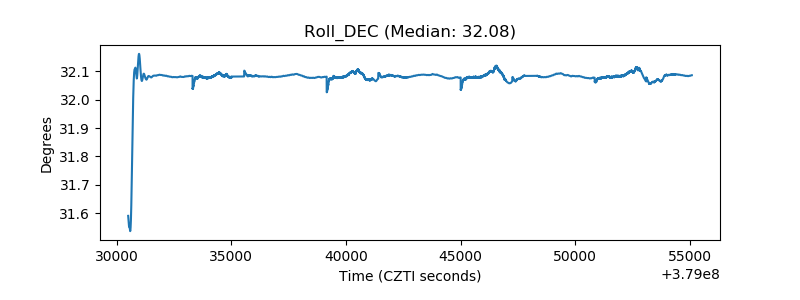 |
| _Roll_RA | 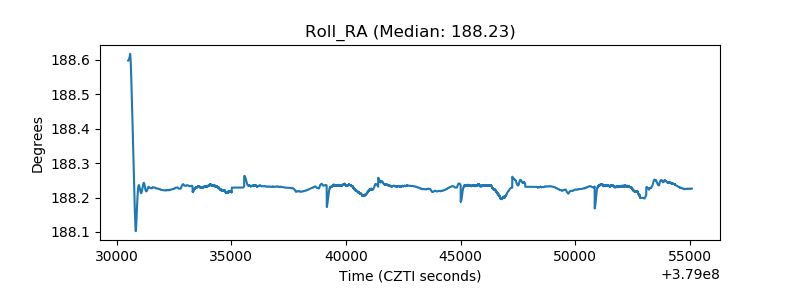 |
| Veto Counter | 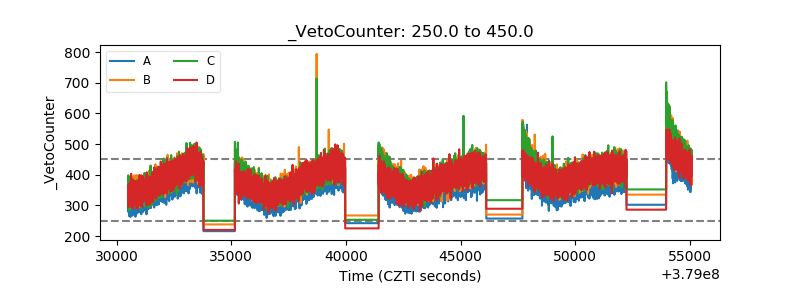 |