| Param | Original file | Final file |
|---|---|---|
| Filename | modeM0/AS1T04_091T01_9000004842_33913cztM0_level2.evt | modeM0/AS1T04_091T01_9000004842_33913cztM0_level2_quad_clean.evt |
| Size (bytes) | 653,765,760 | 61,977,600 |
| Size | 623.5 MB | 59.1 MB |
| Events in quadrant A | 6,462,741 | 173,046 |
| Events in quadrant B | 4,014,744 | 450,189 |
| Events in quadrant C | 3,279,185 | 451,632 |
| Events in quadrant D | 5,677,637 | 423,334 |
| Mode SS | |||
|---|---|---|---|
| Quadrant | BADHDUFLAG | Total packets | Discarded packets |
| A | 0 | 108 | 0 |
| B | 0 | 108 | 0 |
| C | 0 | 108 | 0 |
| D | 0 | 108 | 0 |
| Mode M9 | |||
|---|---|---|---|
| Quadrant | BADHDUFLAG | Total packets | Discarded packets |
| A | 0 | 27 | 0 |
| B | 0 | 27 | 0 |
| C | 0 | 27 | 0 |
| D | 0 | 28 | 0 |
| Mode M0 | |||
|---|---|---|---|
| Quadrant | BADHDUFLAG | Total packets | Discarded packets |
| A | 0 | 22512 | 3 |
| B | 0 | 15292 | 2 |
| C | 0 | 12978 | 2 |
| D | 0 | 20553 | 2 |
| Quadrant | Total seconds | Saturated seconds | Saturation percentage |
|---|---|---|---|
| A | 5396 | 2683 | 49.722016% |
| B | 5396 | 496 | 9.191994% |
| C | 5396 | 96 | 1.779096% |
| D | 5396 | 393 | 7.283173% |
Noise dominated data is calculated using 1-second bins in cleaned event files. If a bin has >2000 counts, and if more than 50% of those come from <1% of pixels, then it is considered to be noise-dominated and hence unusable.
| Quadrant | # 1 sec bins | Bins with >0 counts | Bins with >2000 counts | High rate bins dominated by noise | Noise dominated (total time) | Noise dominated (detector-on time) | Marked lightcurve |
|---|---|---|---|---|---|---|---|
| A | 7249 | 5395 | 1056 | 1056 | 14.57% | 19.57% | 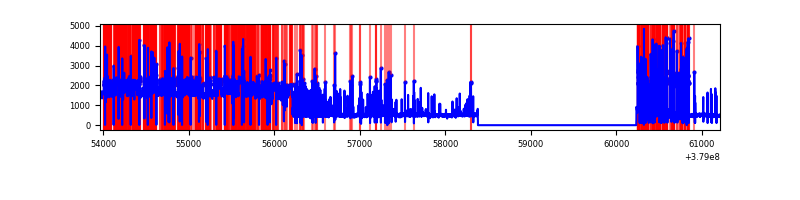 |
| B | 7249 | 5396 | 282 | 282 | 3.89% | 5.23% | 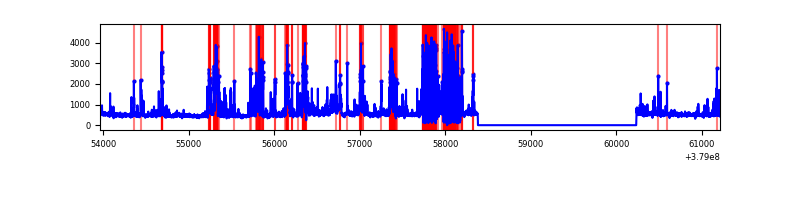 |
| C | 7249 | 5397 | 75 | 75 | 1.03% | 1.39% | 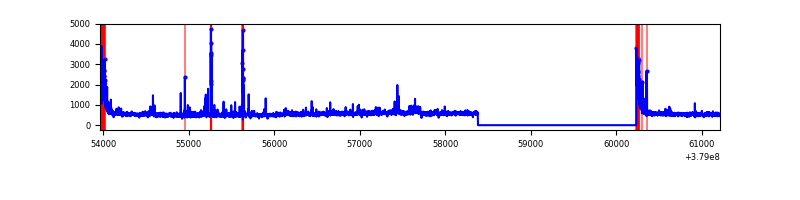 |
| D | 7249 | 5397 | 312 | 312 | 4.30% | 5.78% | 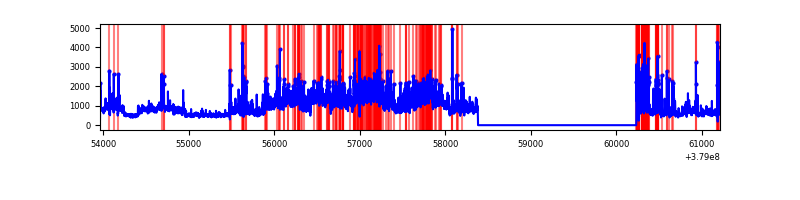 |
Top three noisy pixels from each quadrant. If the there are fewer than three noisy pixels in the level2.evt file, extra rows are filled as -1
| Pixel properties | Quadrant properties | ||||||
|---|---|---|---|---|---|---|---|
| Quadrant | DetID | PixID | Counts | Sigma | Mean | Median | Sigma |
| A | 15 | 169 | 4971360 | 66446.99 | 368 | 360 | 74.8 |
| A | 7 | 16 | 62761 | 834.11 | 368 | 360 | 74.8 |
| A | 10 | 83 | 4899 | 60.67 | 368 | 360 | 74.8 |
| B | 5 | 172 | 765092 | 6474.12 | 621 | 604 | 118.1 |
| B | 4 | 251 | 633119 | 5356.49 | 621 | 604 | 118.1 |
| B | 0 | 190 | 46544 | 389.05 | 621 | 604 | 118.1 |
| C | 0 | 10 | 268236 | 1848.0 | 631 | 637 | 144.8 |
| C | 15 | 214 | 238314 | 1641.37 | 631 | 637 | 144.8 |
| C | 3 | 233 | 121519 | 834.79 | 631 | 637 | 144.8 |
| D | 1 | 52 | 1681850 | 10890.4 | 626 | 609 | 154.4 |
| D | 8 | 195 | 845393 | 5472.17 | 626 | 609 | 154.4 |
| D | 12 | 235 | 274501 | 1774.16 | 626 | 609 | 154.4 |
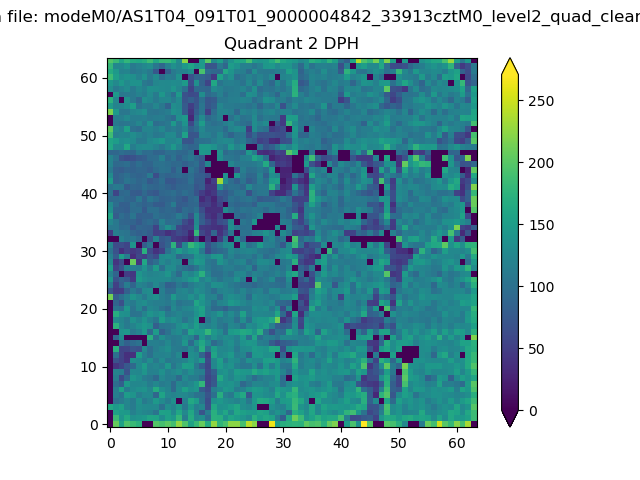
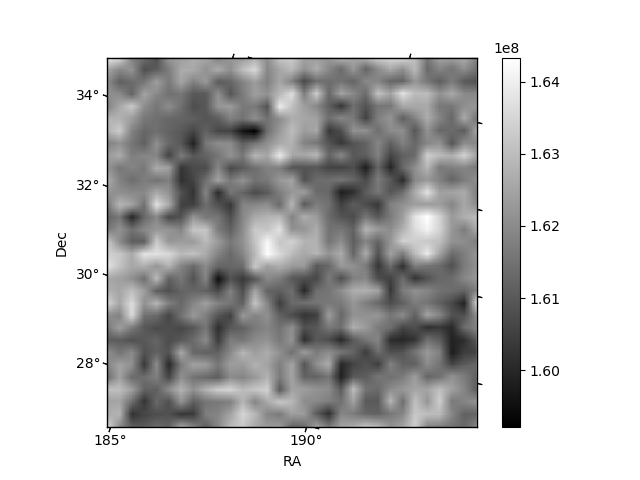
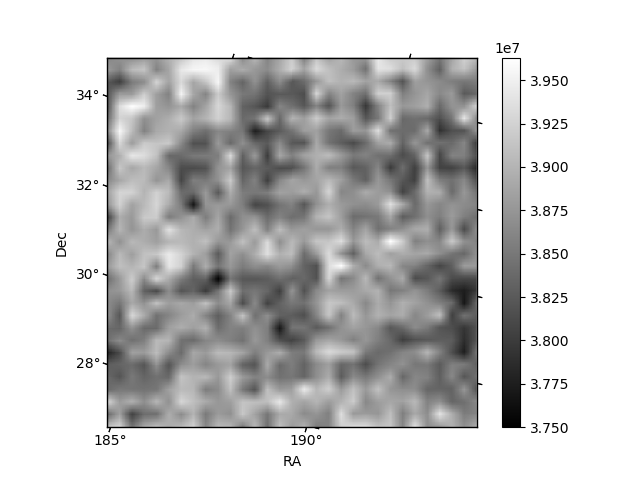
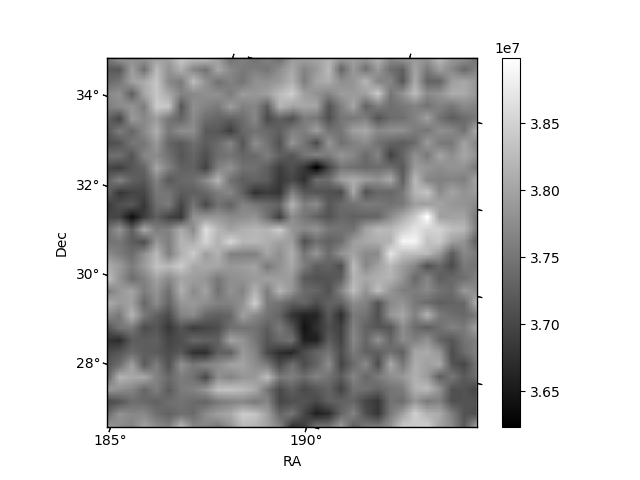
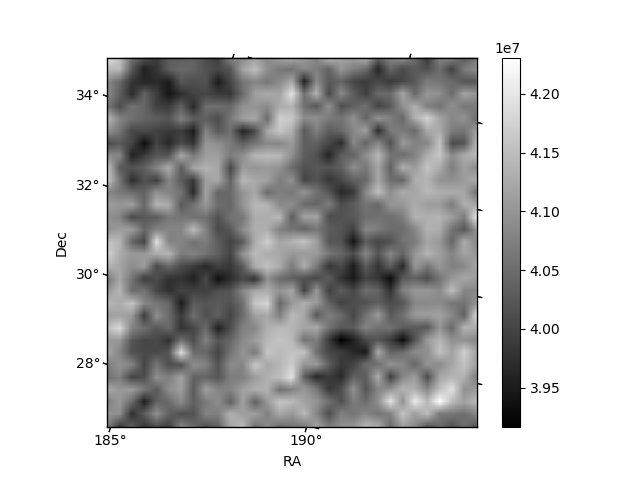
Histogram calculated using DETX and DETY for each event in the final _common_clean file
| Quadrant A | 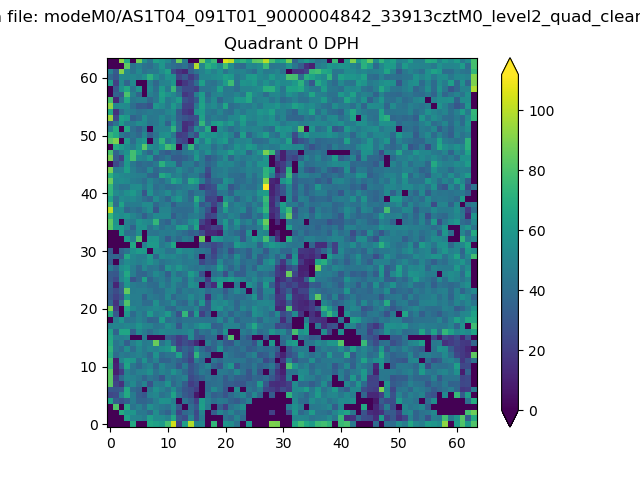 |
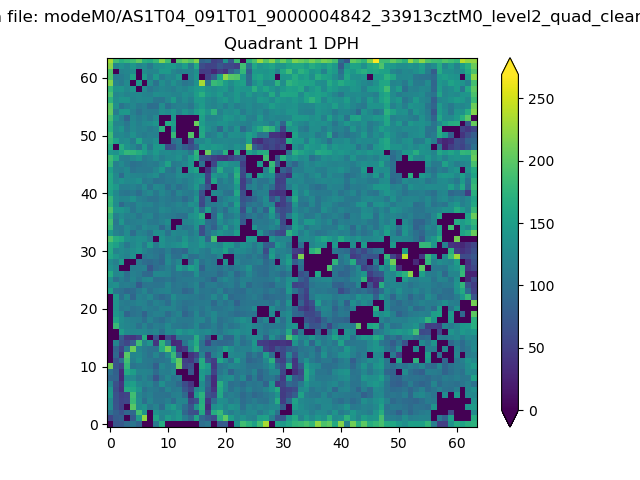 |
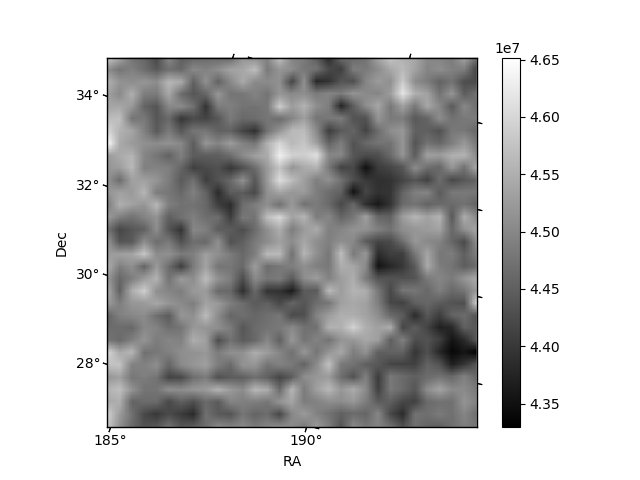
Quadrant B |
|---|---|---|---|
| Quadrant D | 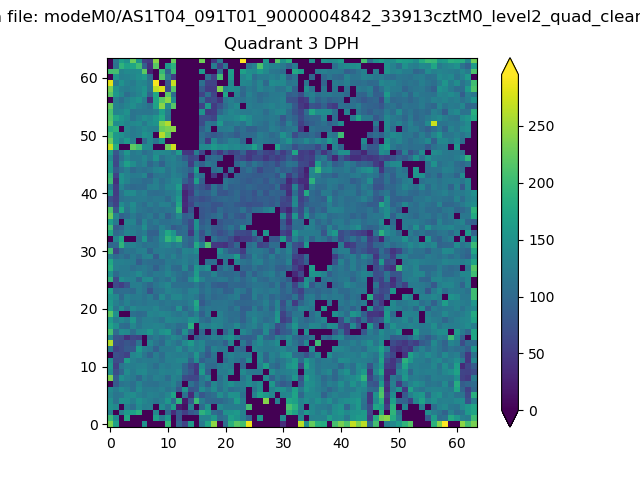 |
 |
Quadrant C |
| Plot type | Count rate plots | Images |
|---|---|---|
| Comparison with Poisson distribution Blue bars denote a histogram of data divided into 1 sec bins. Red curve is a Poisson curve with rate = median count rate of data. |
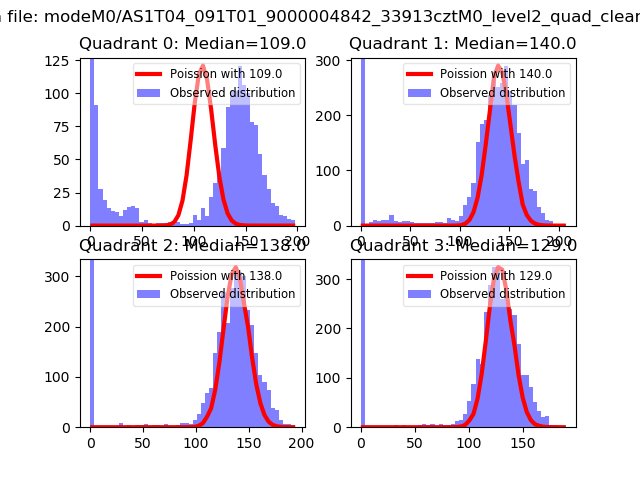 |
 |
| Quadrant-wise count rates Data is divided into 100 sec bins |
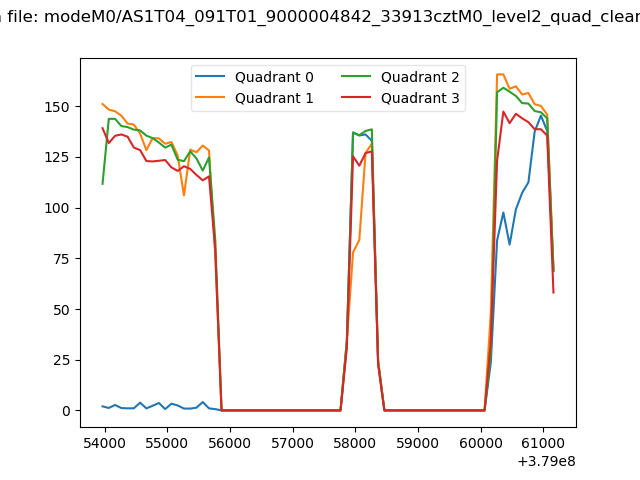 |
|
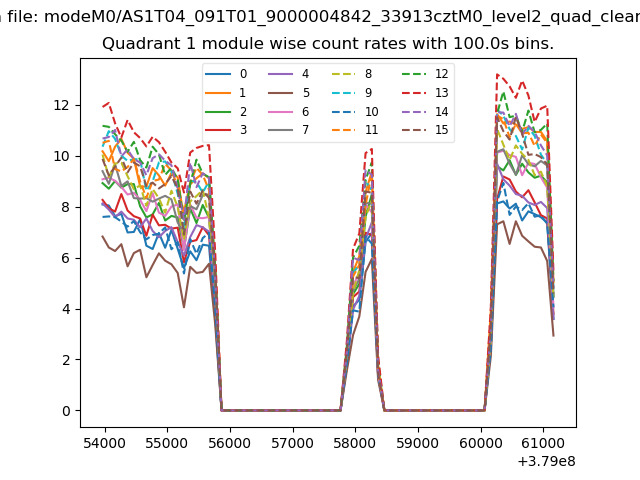
| Module-wise count rates for Quadrant A Data is divided into 100 sec bins |
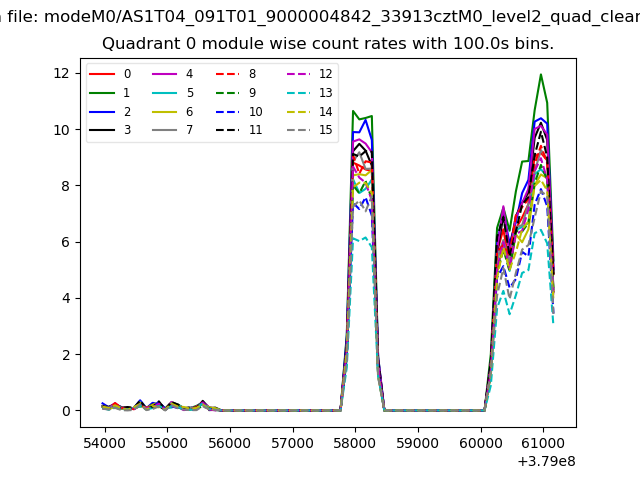 |
 |
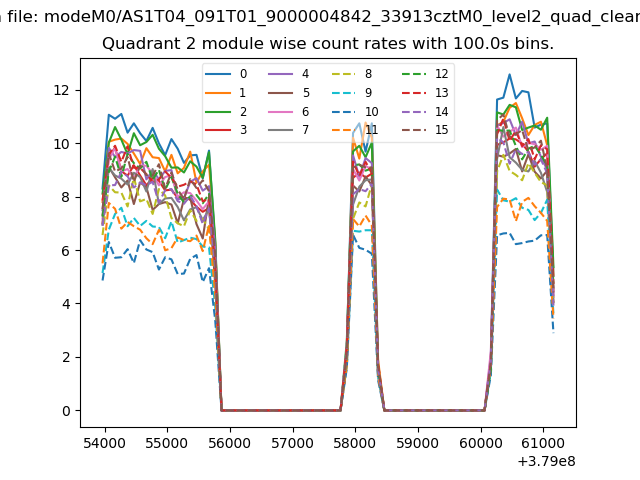
| Module-wise count rates for Quadrant B Data is divided into 100 sec bins |
 |
 |
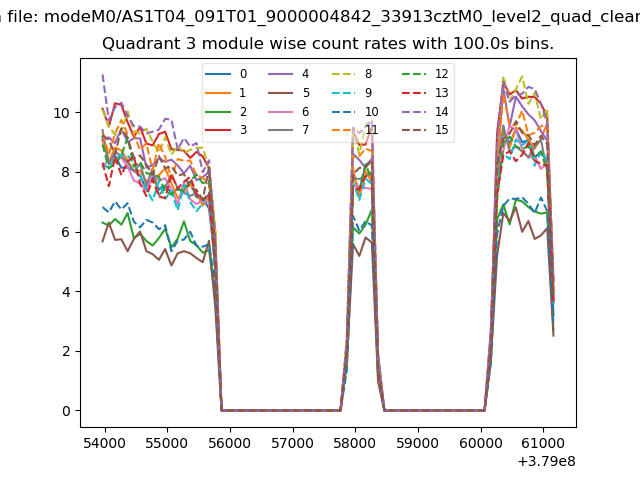
| Module-wise count rates for Quadrant C Data is divided into 100 sec bins |
 |
 |
| Module-wise count rates for Quadrant D Data is divided into 100 sec bins |
 |
 |
| Parameter | Plot |
|---|---|
| CZT HV Monitor | 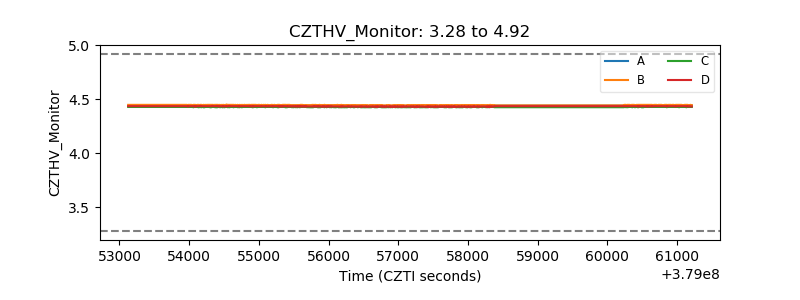 |
| D_VDD | 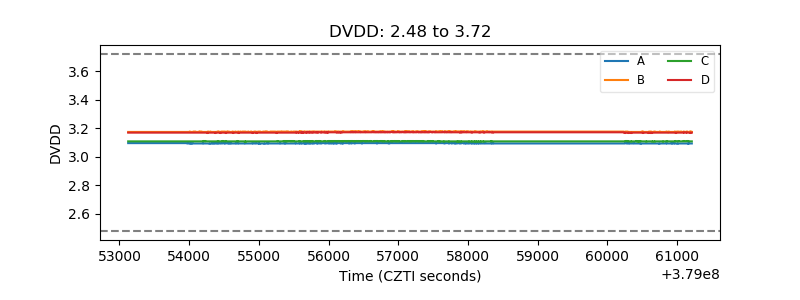 |
| Temperature 1 | 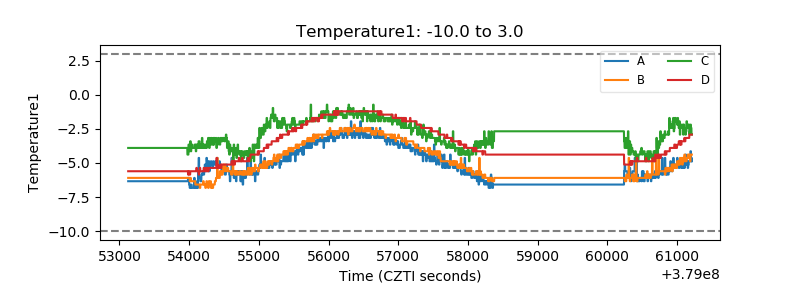 |
| Veto HV Monitor | 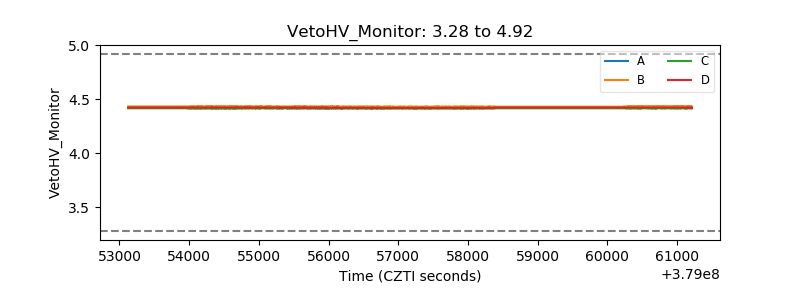 |
| Veto LLD | 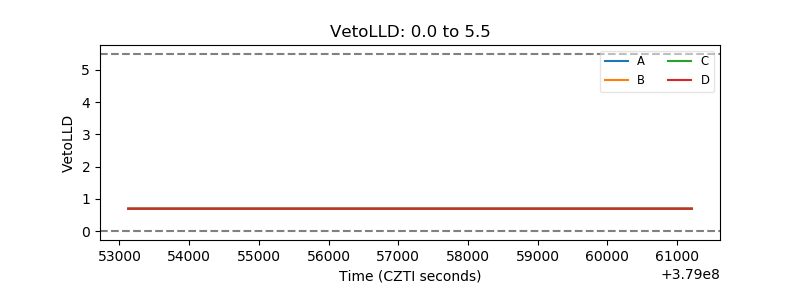 |
| Alpha Counter | 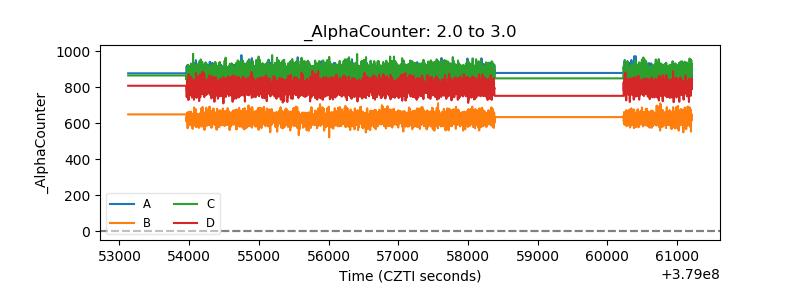 |
| _CPM_Rate | 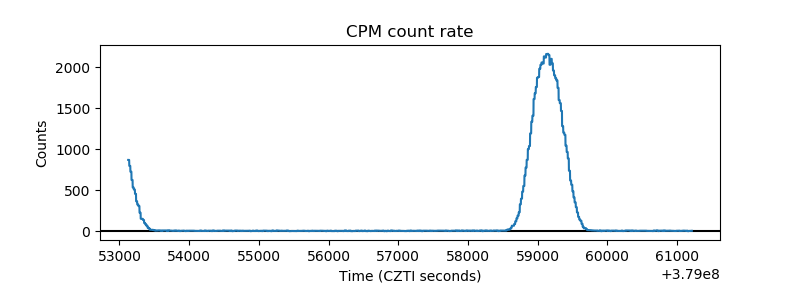 |
| CZT Counter | 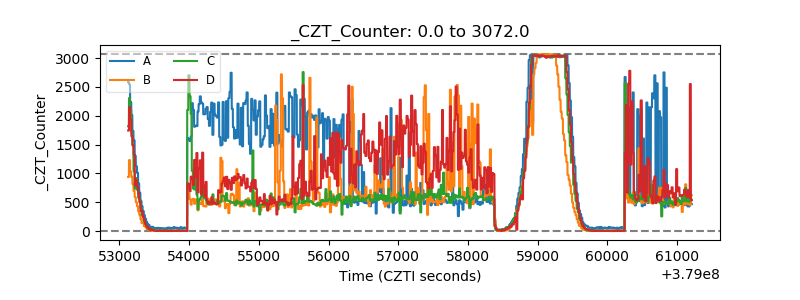 |
| +2.5 Volts monitor |  |
| +5 Volts monitor | 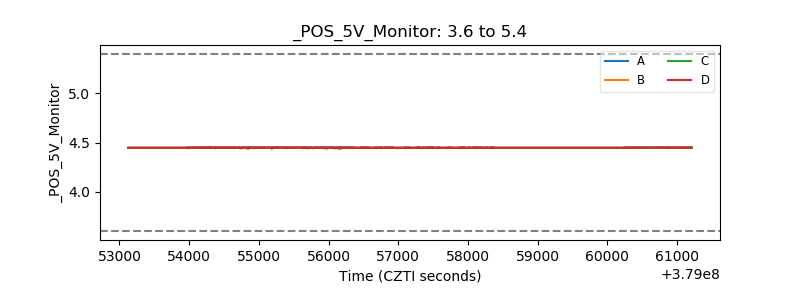 |
| _ROLL_ROT | 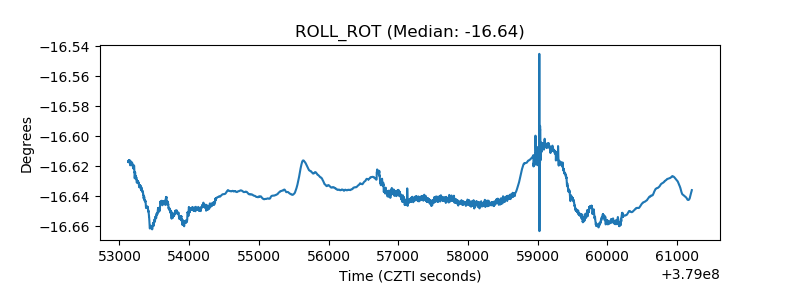 |
| _Roll_DEC | 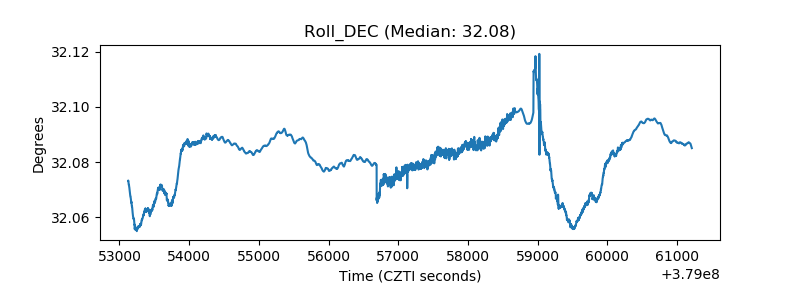 |
| _Roll_RA | 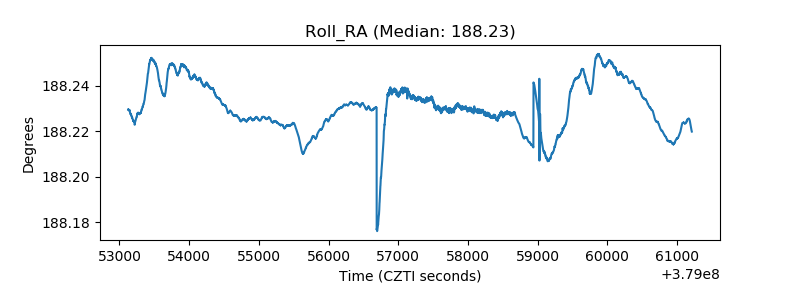 |
| Veto Counter | 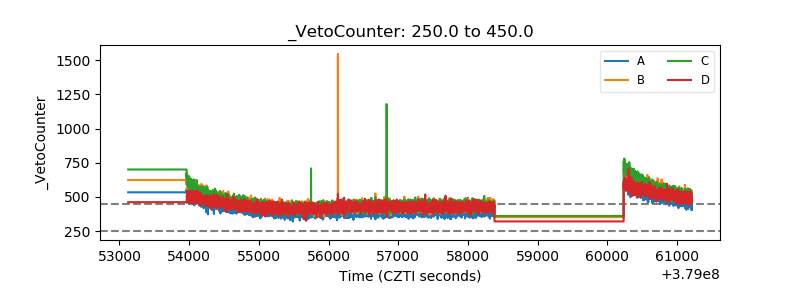 |