| Param | Original file | Final file |
|---|---|---|
| Filename | modeM0/AS1T04_091T01_9000004842_33914cztM0_level2.evt | modeM0/AS1T04_091T01_9000004842_33914cztM0_level2_quad_clean.evt |
| Size (bytes) | 509,221,440 | 65,430,720 |
| Size | 485.6 MB | 62.4 MB |
| Events in quadrant A | 3,066,376 | 398,252 |
| Events in quadrant B | 2,936,998 | 429,033 |
| Events in quadrant C | 2,953,995 | 420,678 |
| Events in quadrant D | 6,129,582 | 386,223 |
| Mode SS | |||
|---|---|---|---|
| Quadrant | BADHDUFLAG | Total packets | Discarded packets |
| A | 0 | 102 | 0 |
| B | 0 | 102 | 0 |
| C | 0 | 102 | 0 |
| D | 0 | 102 | 0 |
| Mode M9 | |||
|---|---|---|---|
| Quadrant | BADHDUFLAG | Total packets | Discarded packets |
| A | 0 | 19 | 0 |
| B | 0 | 19 | 0 |
| C | 0 | 19 | 0 |
| D | 0 | 19 | 0 |
| Mode M0 | |||
|---|---|---|---|
| Quadrant | BADHDUFLAG | Total packets | Discarded packets |
| A | 0 | 11956 | 2 |
| B | 0 | 11589 | 1 |
| C | 0 | 11681 | 1 |
| D | 0 | 21654 | 1 |
| Quadrant | Total seconds | Saturated seconds | Saturation percentage |
|---|---|---|---|
| A | 4938 | 284 | 5.751316% |
| B | 4938 | 97 | 1.964358% |
| C | 4938 | 51 | 1.032807% |
| D | 4938 | 867 | 17.557716% |
Noise dominated data is calculated using 1-second bins in cleaned event files. If a bin has >2000 counts, and if more than 50% of those come from <1% of pixels, then it is considered to be noise-dominated and hence unusable.
| Quadrant | # 1 sec bins | Bins with >0 counts | Bins with >2000 counts | High rate bins dominated by noise | Noise dominated (total time) | Noise dominated (detector-on time) | Marked lightcurve |
|---|---|---|---|---|---|---|---|
| A | 6912 | 4938 | 174 | 174 | 2.52% | 3.52% | 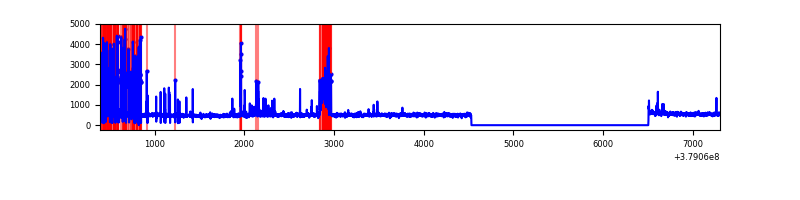 |
| B | 6912 | 4939 | 52 | 52 | 0.75% | 1.05% | 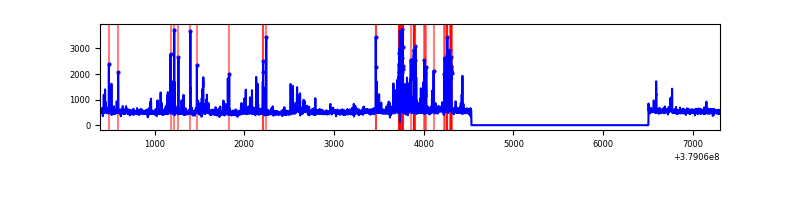 |
| C | 6912 | 4939 | 36 | 36 | 0.52% | 0.73% | 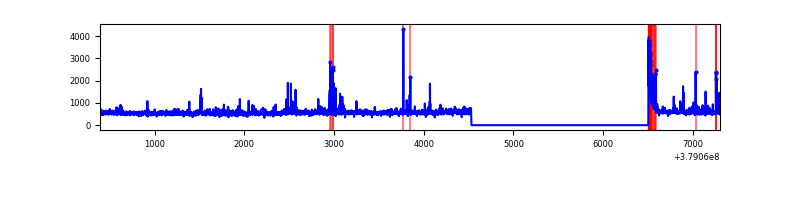 |
| D | 6912 | 4939 | 784 | 784 | 11.34% | 15.87% | 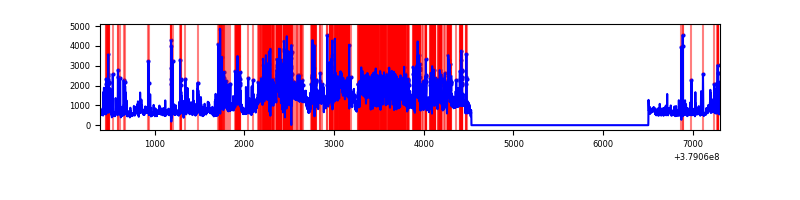 |
Top three noisy pixels from each quadrant. If the there are fewer than three noisy pixels in the level2.evt file, extra rows are filled as -1
| Pixel properties | Quadrant properties | ||||||
|---|---|---|---|---|---|---|---|
| Quadrant | DetID | PixID | Counts | Sigma | Mean | Median | Sigma |
| A | 15 | 169 | 598292 | 4934.24 | 607 | 598 | 121.1 |
| A | 7 | 16 | 111702 | 917.22 | 607 | 598 | 121.1 |
| A | 13 | 6 | 9994 | 77.57 | 607 | 598 | 121.1 |
| B | 5 | 172 | 290688 | 2505.32 | 617 | 603 | 115.8 |
| B | 4 | 251 | 54771 | 467.82 | 617 | 603 | 115.8 |
| B | 15 | 35 | 42691 | 363.49 | 617 | 603 | 115.8 |
| C | 15 | 214 | 218272 | 1558.86 | 607 | 612 | 139.6 |
| C | 0 | 10 | 159975 | 1141.34 | 607 | 612 | 139.6 |
| C | 0 | 207 | 94395 | 671.67 | 607 | 612 | 139.6 |
| D | 1 | 52 | 1397536 | 9833.14 | 578 | 563 | 142.1 |
| D | 12 | 235 | 947368 | 6664.45 | 578 | 563 | 142.1 |
| D | 8 | 195 | 813862 | 5724.72 | 578 | 563 | 142.1 |
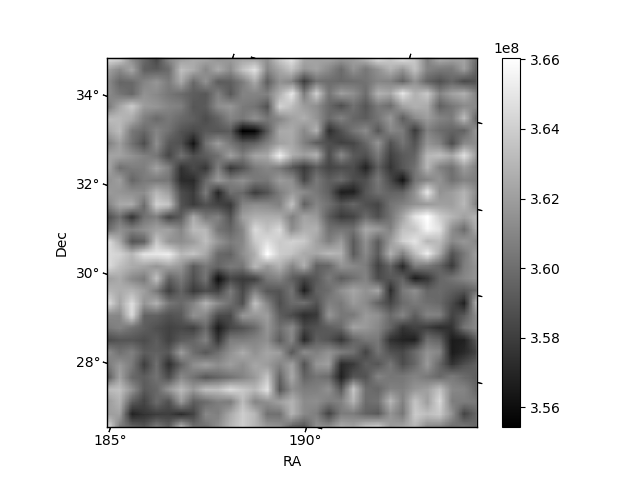
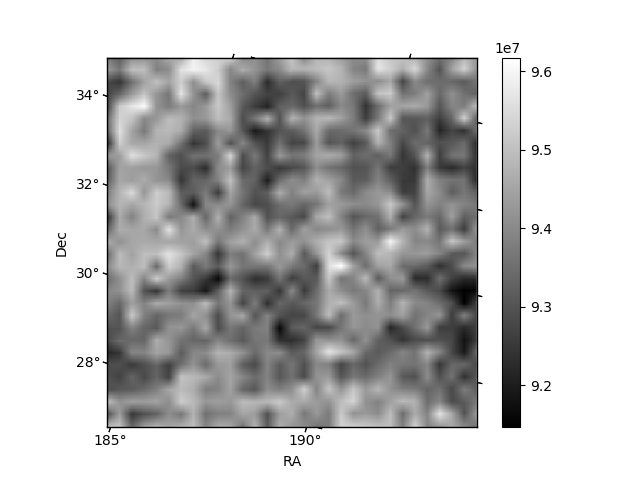
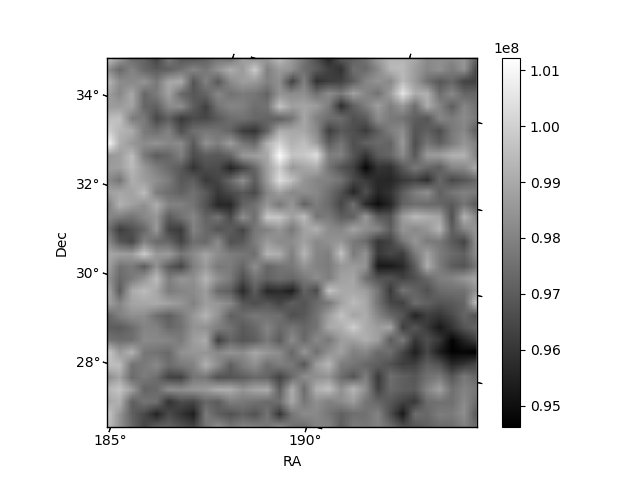
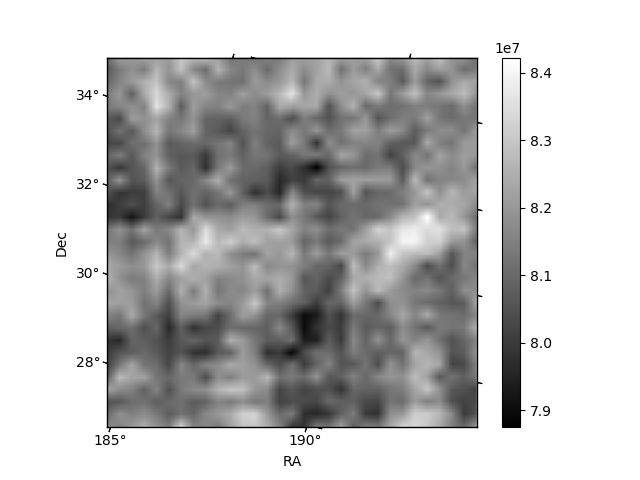
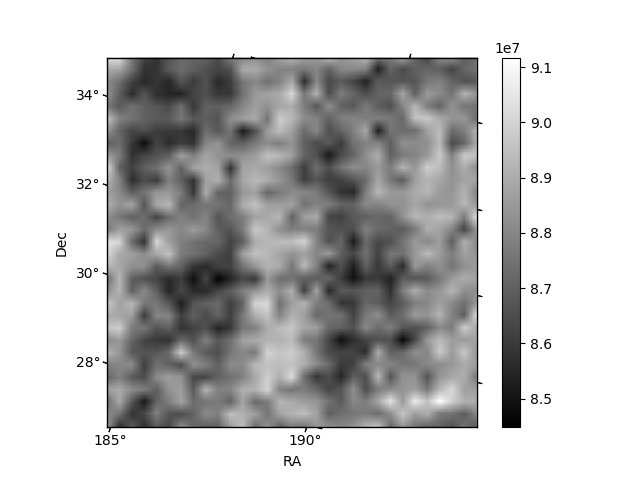
Histogram calculated using DETX and DETY for each event in the final _common_clean file
| Quadrant A | 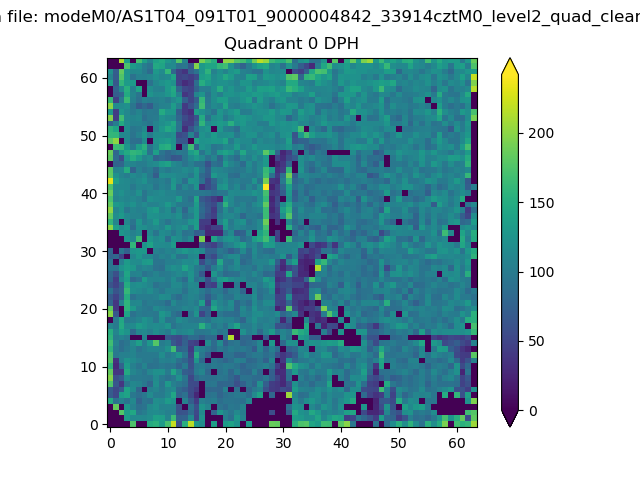 |
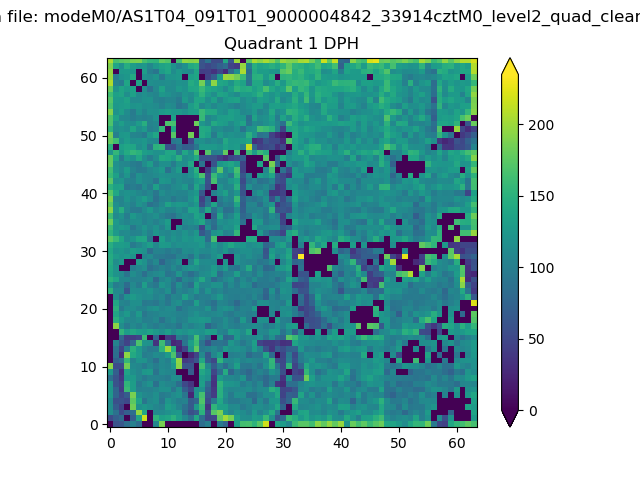 |
Quadrant B |
|---|---|---|---|
| Quadrant D | 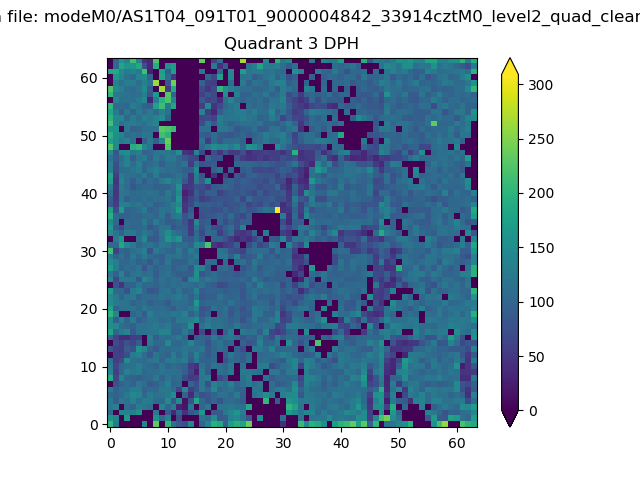 |
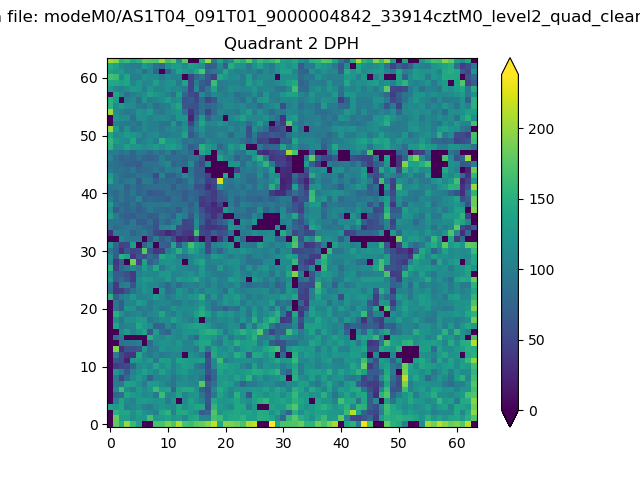 |
Quadrant C |
| Plot type | Count rate plots | Images |
|---|---|---|
| Comparison with Poisson distribution Blue bars denote a histogram of data divided into 1 sec bins. Red curve is a Poisson curve with rate = median count rate of data. |
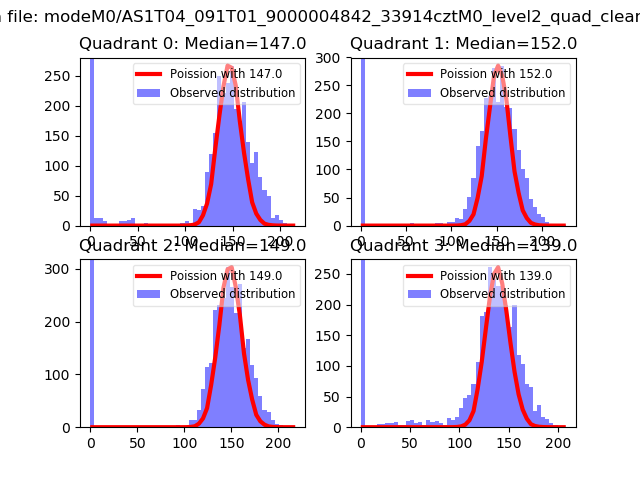 |
 |
| Quadrant-wise count rates Data is divided into 100 sec bins |
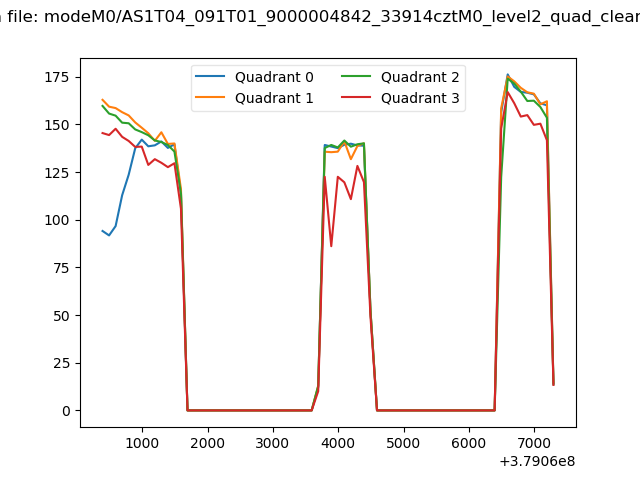 |
|
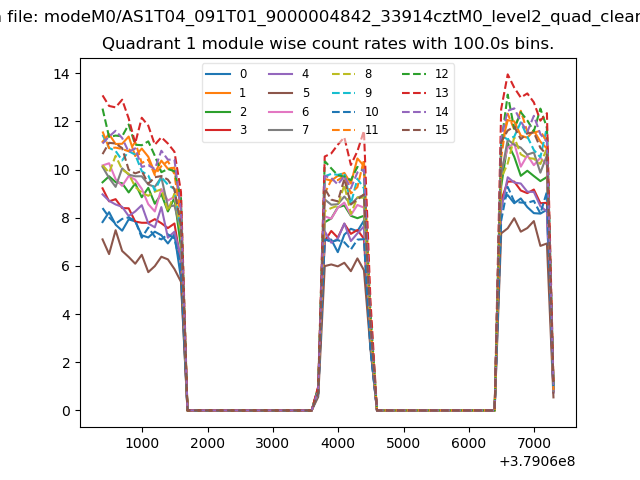
| Module-wise count rates for Quadrant A Data is divided into 100 sec bins |
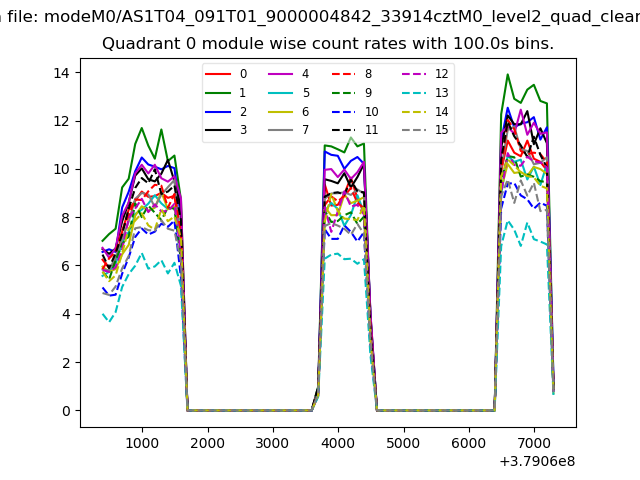 |
 |
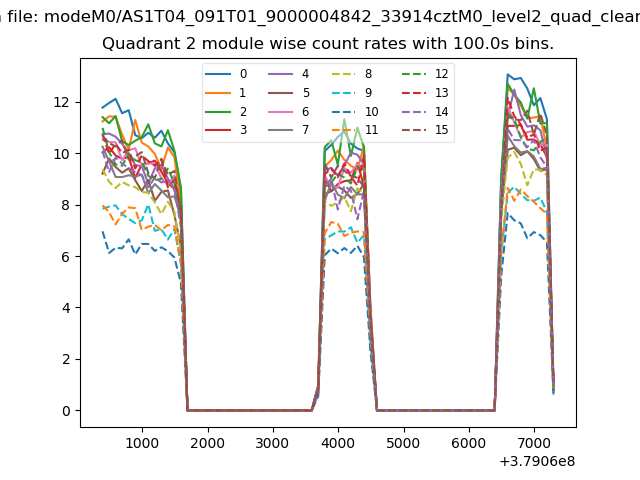
| Module-wise count rates for Quadrant B Data is divided into 100 sec bins |
 |
 |
| Module-wise count rates for Quadrant C Data is divided into 100 sec bins |
 |
 |
| Module-wise count rates for Quadrant D Data is divided into 100 sec bins |
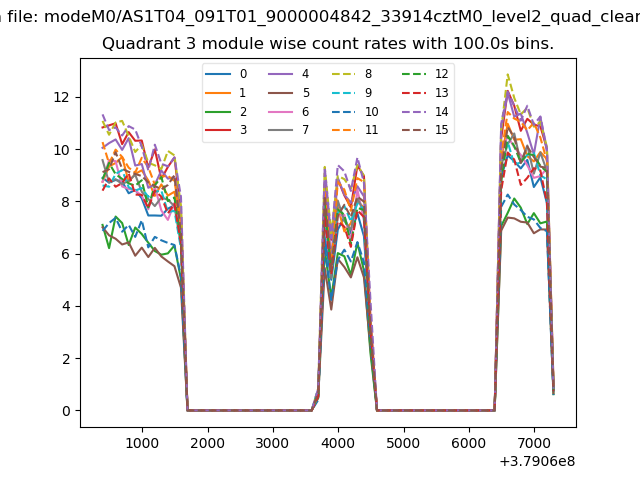 |
 |
| Parameter | Plot |
|---|---|
| CZT HV Monitor | 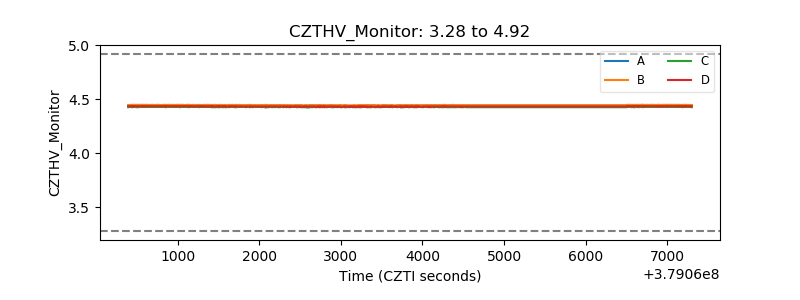 |
| D_VDD | 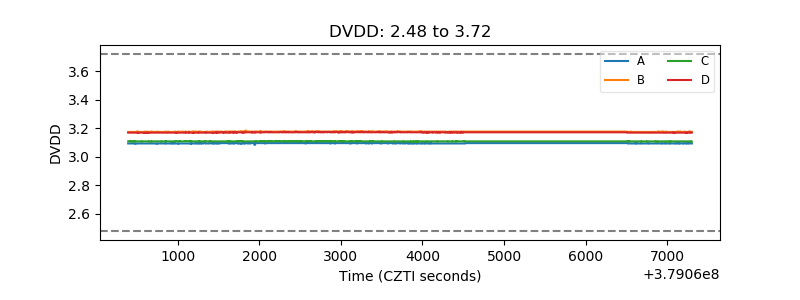 |
| Temperature 1 | 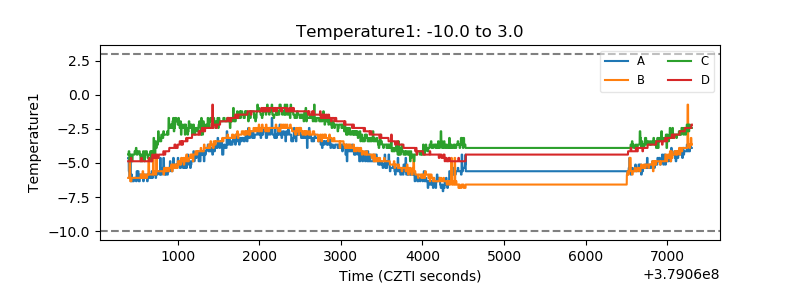 |
| Veto HV Monitor | 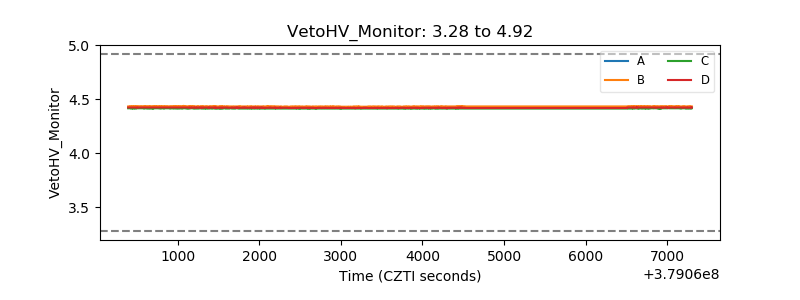 |
| Veto LLD | 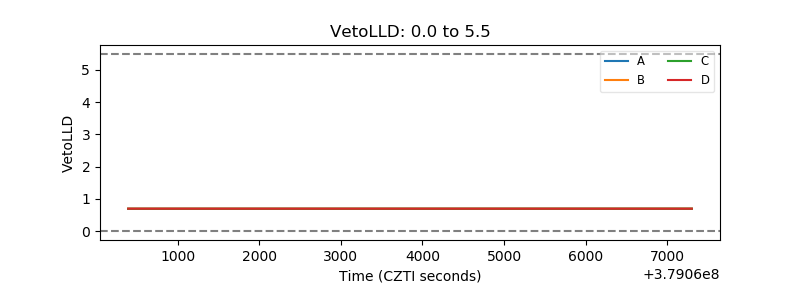 |
| Alpha Counter | 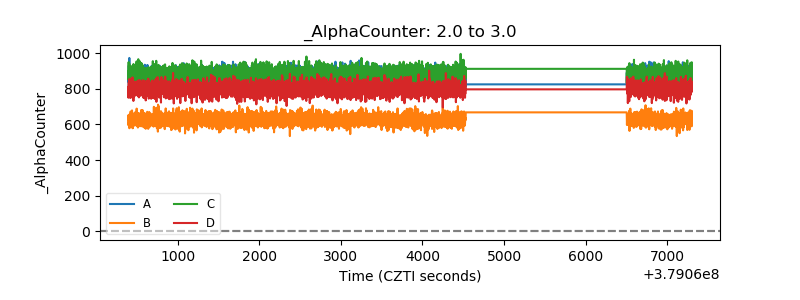 |
| _CPM_Rate | 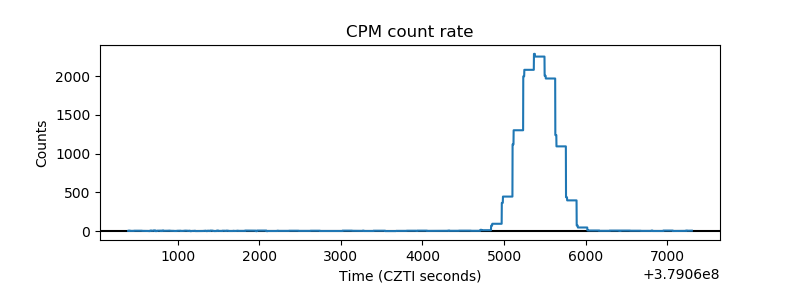 |
| CZT Counter | 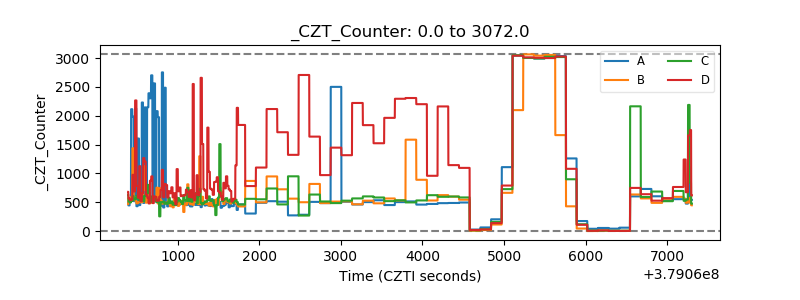 |
| +2.5 Volts monitor |  |
| +5 Volts monitor |  |
| _ROLL_ROT | 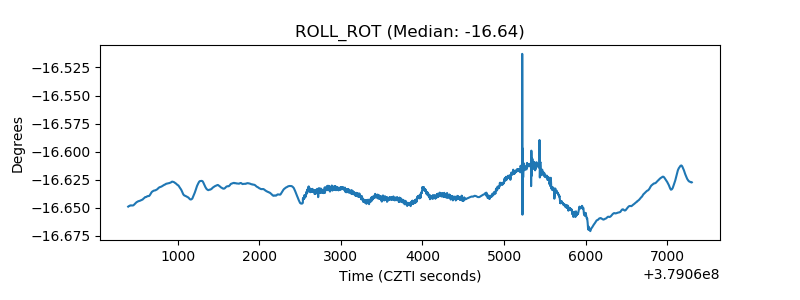 |
| _Roll_DEC | 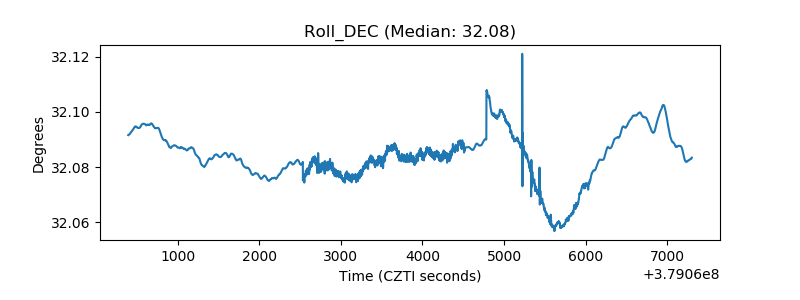 |
| _Roll_RA | 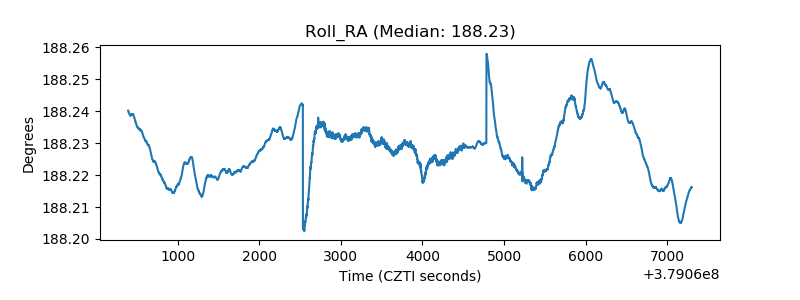 |
| Veto Counter | 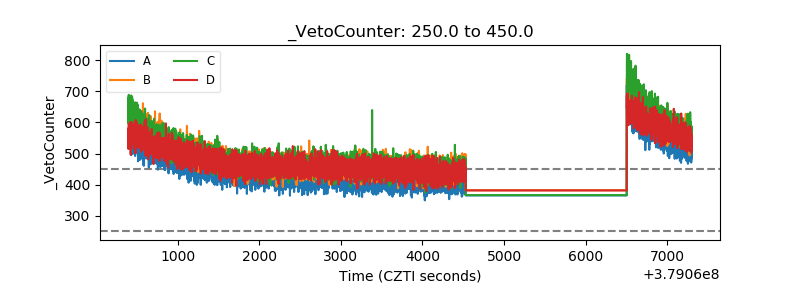 |