| Param | Original file | Final file |
|---|---|---|
| Filename | modeM0/AS1T04_091T01_9000004842_33916cztM0_level2.evt | modeM0/AS1T04_091T01_9000004842_33916cztM0_level2_quad_clean.evt |
| Size (bytes) | 421,390,080 | 30,479,040 |
| Size | 401.9 MB | 29.1 MB |
| Events in quadrant A | 2,052,430 | 178,457 |
| Events in quadrant B | 4,614,300 | 173,312 |
| Events in quadrant C | 2,306,103 | 168,955 |
| Events in quadrant D | 3,547,281 | 149,597 |
| Mode SS | |||
|---|---|---|---|
| Quadrant | BADHDUFLAG | Total packets | Discarded packets |
| A | 0 | 96 | 18 |
| B | 0 | 96 | 28 |
| C | 0 | 99 | 29 |
| D | 0 | 96 | 26 |
| Mode M9 | |||
|---|---|---|---|
| Quadrant | BADHDUFLAG | Total packets | Discarded packets |
| A | 0 | 22 | 10 |
| B | 0 | 22 | 10 |
| C | 0 | 22 | 9 |
| D | 0 | 22 | 9 |
| Mode M0 | |||
|---|---|---|---|
| Quadrant | BADHDUFLAG | Total packets | Discarded packets |
| A | 0 | 10442 | 2334 |
| B | 0 | 19482 | 3379 |
| C | 0 | 11981 | 2791 |
| D | 0 | 18072 | 5012 |
| Quadrant | Total seconds | Saturated seconds | Saturation percentage |
|---|---|---|---|
| A | 3638 | 21 | 0.577240% |
| B | 3555 | 995 | 27.988748% |
| C | 3592 | 55 | 1.531180% |
| D | 3465 | 203 | 5.858586% |
Noise dominated data is calculated using 1-second bins in cleaned event files. If a bin has >2000 counts, and if more than 50% of those come from <1% of pixels, then it is considered to be noise-dominated and hence unusable.
| Quadrant | # 1 sec bins | Bins with >0 counts | Bins with >2000 counts | High rate bins dominated by noise | Noise dominated (total time) | Noise dominated (detector-on time) | Marked lightcurve |
|---|---|---|---|---|---|---|---|
| A | 6949 | 3858 | 13 | 13 | 0.19% | 0.34% | 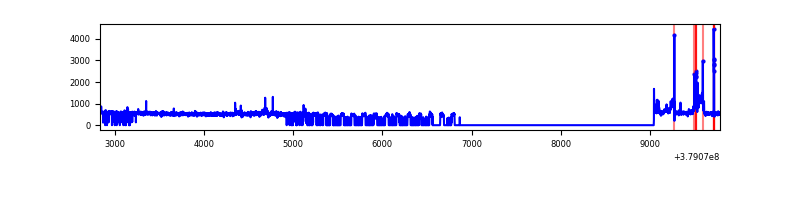 |
| B | 6949 | 3778 | 783 | 783 | 11.27% | 20.73% | 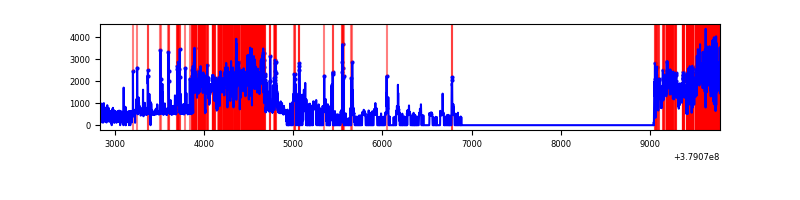 |
| C | 6949 | 3819 | 37 | 37 | 0.53% | 0.97% | 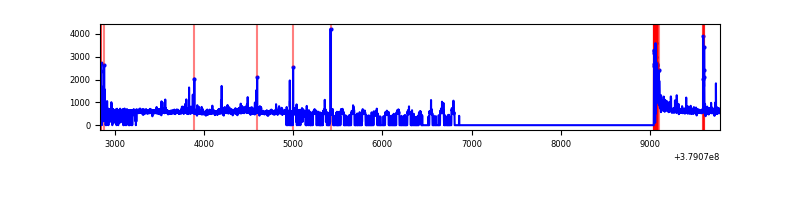 |
| D | 6949 | 3631 | 138 | 138 | 1.99% | 3.80% | 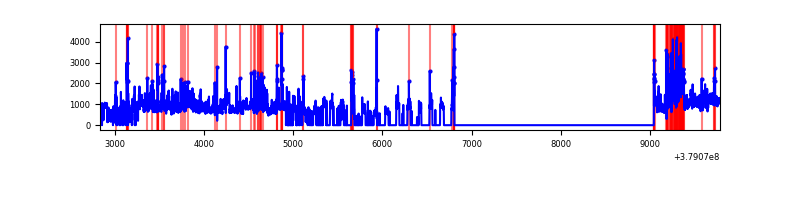 |
Top three noisy pixels from each quadrant. If the there are fewer than three noisy pixels in the level2.evt file, extra rows are filled as -1
| Pixel properties | Quadrant properties | ||||||
|---|---|---|---|---|---|---|---|
| Quadrant | DetID | PixID | Counts | Sigma | Mean | Median | Sigma |
| A | 15 | 169 | 151978 | 1560.57 | 485 | 475 | 97.1 |
| A | 7 | 16 | 15423 | 153.97 | 485 | 475 | 97.1 |
| A | 10 | 83 | 7809 | 75.54 | 485 | 475 | 97.1 |
| B | 4 | 251 | 2074330 | 26207.54 | 419 | 410 | 79.1 |
| B | 5 | 172 | 748260 | 9450.37 | 419 | 410 | 79.1 |
| B | 0 | 219 | 45841 | 574.1 | 419 | 410 | 79.1 |
| C | 15 | 214 | 159694 | 1520.59 | 456 | 461 | 104.7 |
| C | 0 | 10 | 139129 | 1324.21 | 456 | 461 | 104.7 |
| C | 0 | 207 | 103196 | 981.07 | 456 | 461 | 104.7 |
| D | 8 | 195 | 673793 | 6208.92 | 443 | 431 | 108.5 |
| D | 1 | 52 | 336610 | 3099.83 | 443 | 431 | 108.5 |
| D | 2 | 250 | 206464 | 1899.78 | 443 | 431 | 108.5 |
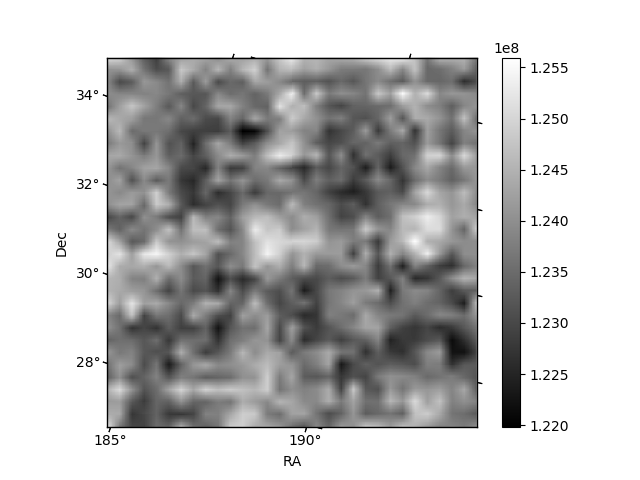
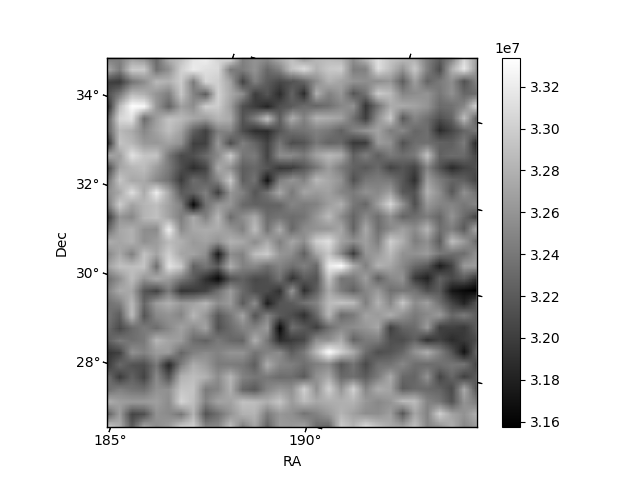
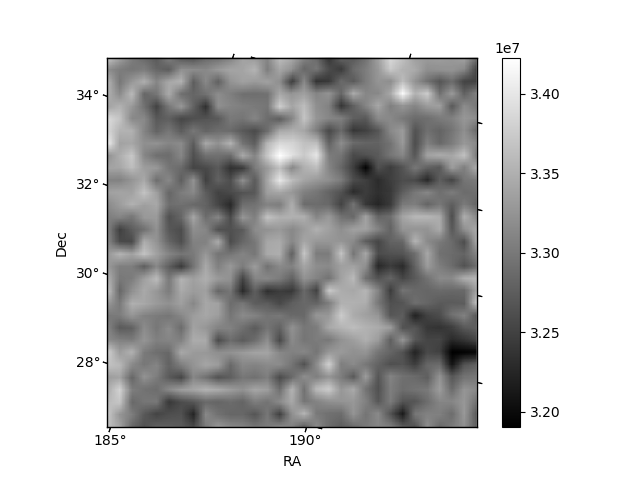
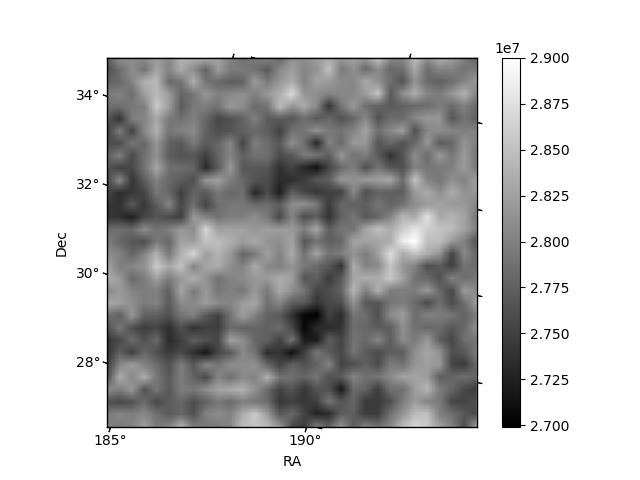
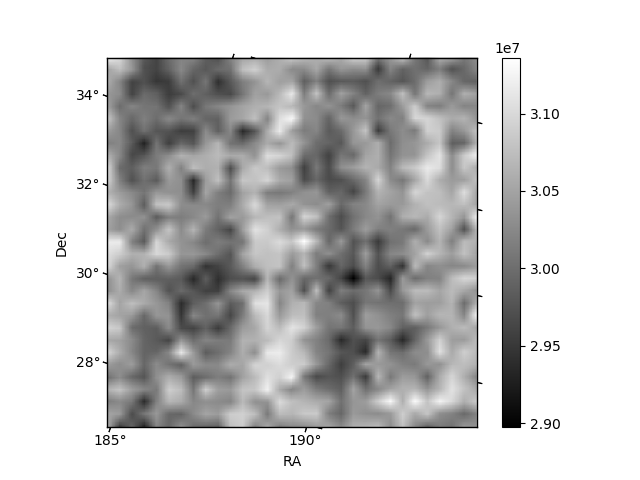
Histogram calculated using DETX and DETY for each event in the final _common_clean file
| Quadrant A | 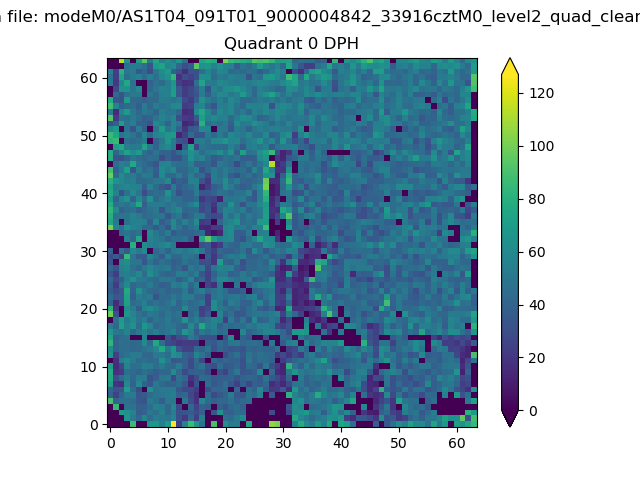 |
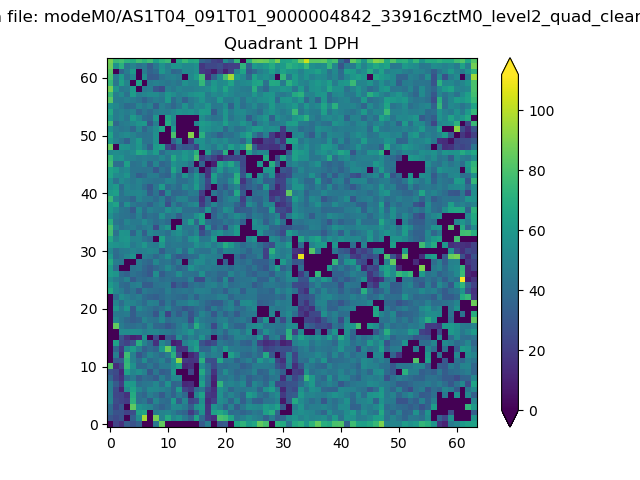 |
Quadrant B |
|---|---|---|---|
| Quadrant D | 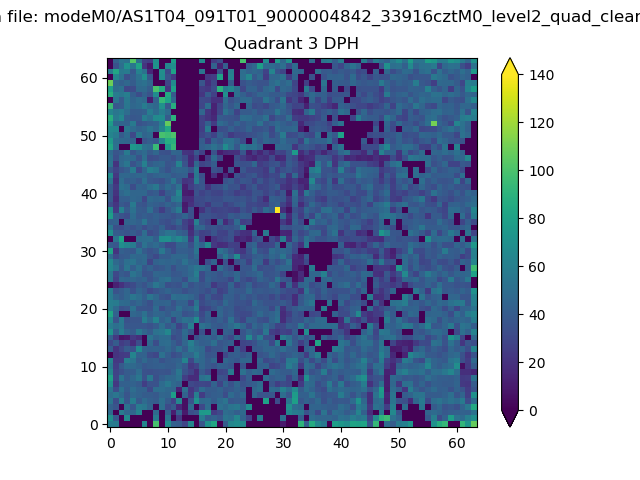 |
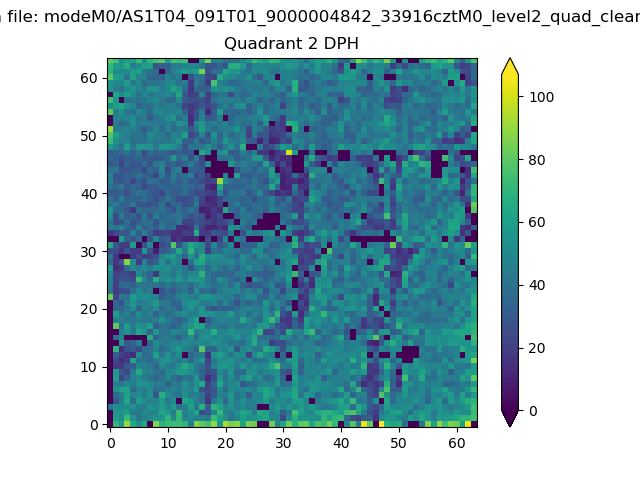 |
Quadrant C |
| Plot type | Count rate plots | Images |
|---|---|---|
| Comparison with Poisson distribution Blue bars denote a histogram of data divided into 1 sec bins. Red curve is a Poisson curve with rate = median count rate of data. |
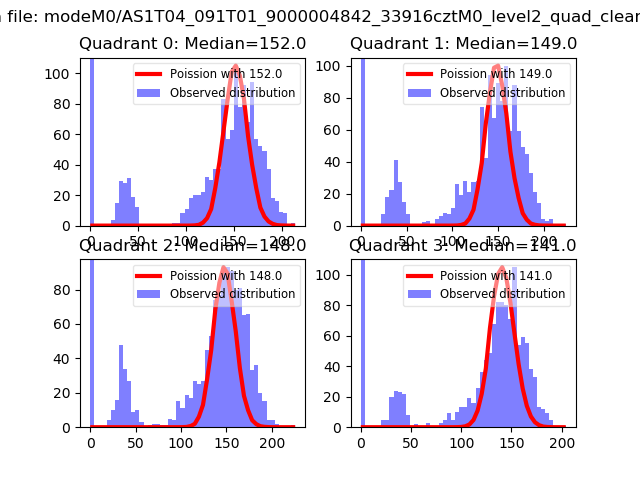 |
 |
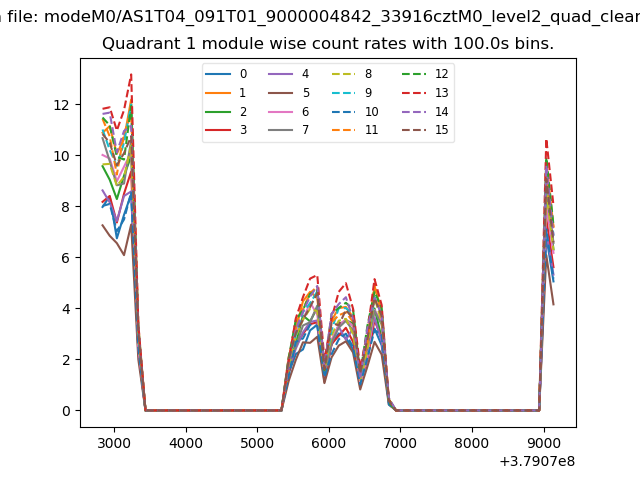
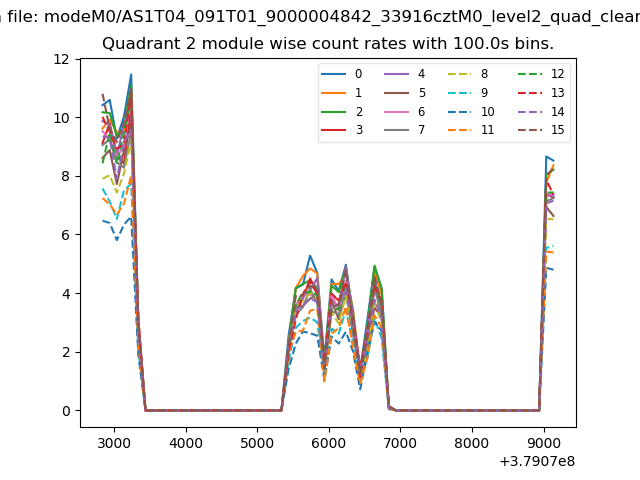
| Quadrant-wise count rates Data is divided into 100 sec bins |
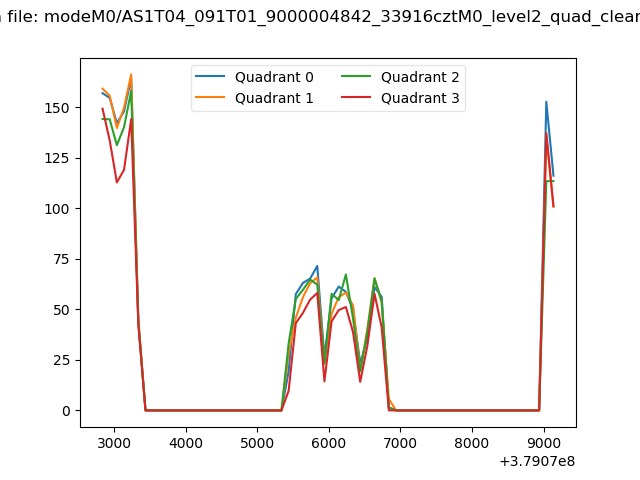 |
|
| Module-wise count rates for Quadrant A Data is divided into 100 sec bins |
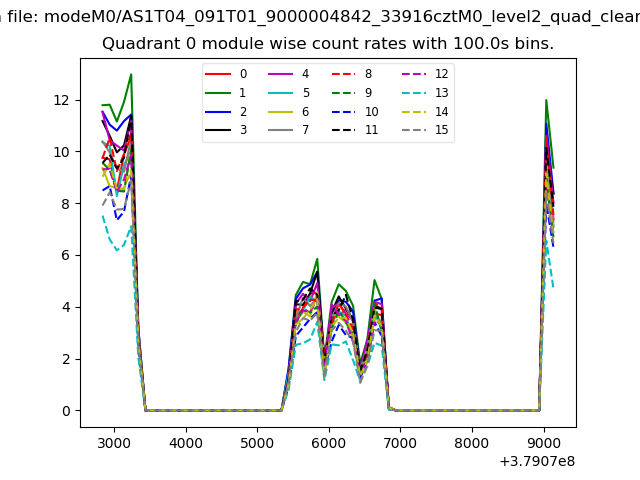 |
 |
| Module-wise count rates for Quadrant B Data is divided into 100 sec bins |
 |
 |
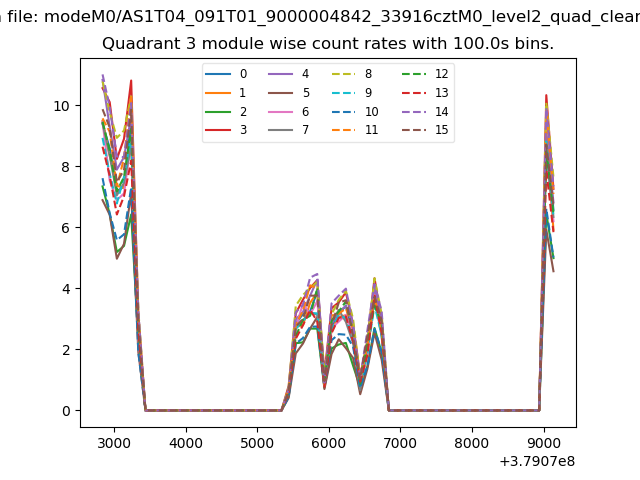
| Module-wise count rates for Quadrant C Data is divided into 100 sec bins |
 |
 |
| Module-wise count rates for Quadrant D Data is divided into 100 sec bins |
 |
 |
| Parameter | Plot |
|---|---|
| CZT HV Monitor | 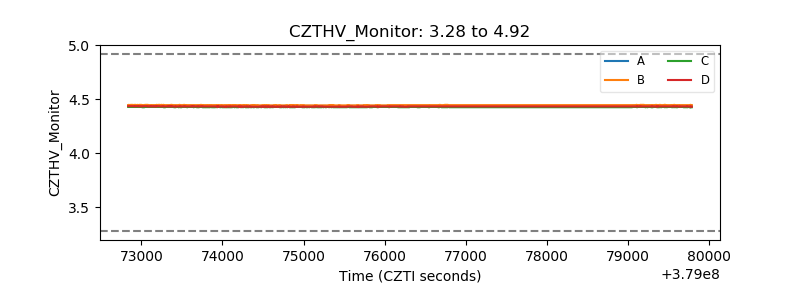 |
| D_VDD | 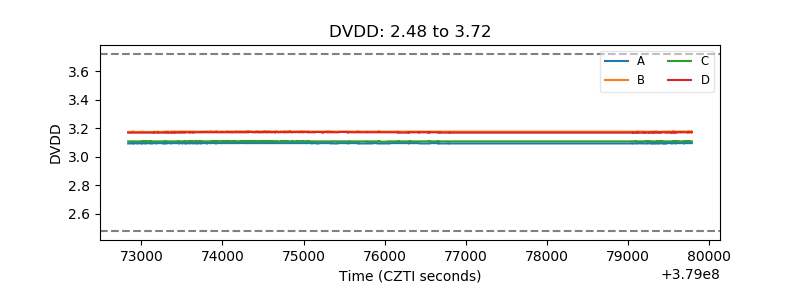 |
| Temperature 1 | 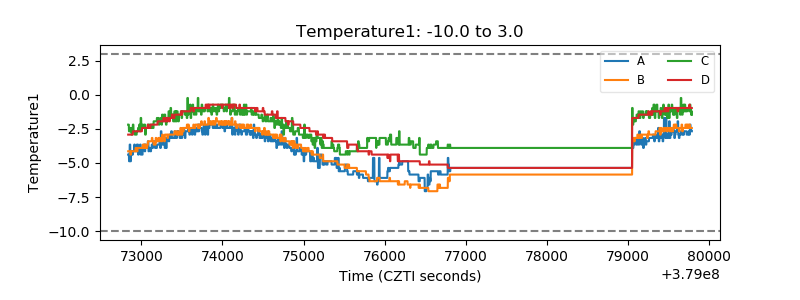 |
| Veto HV Monitor | 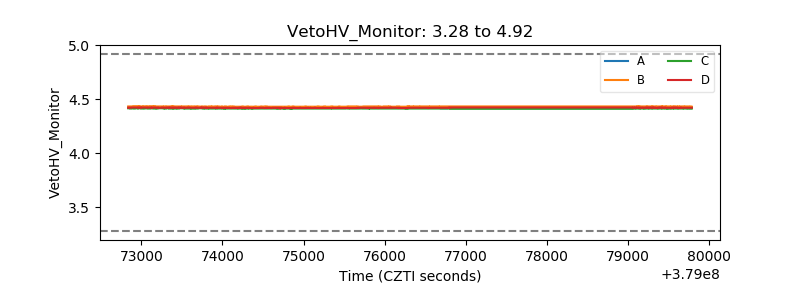 |
| Veto LLD | 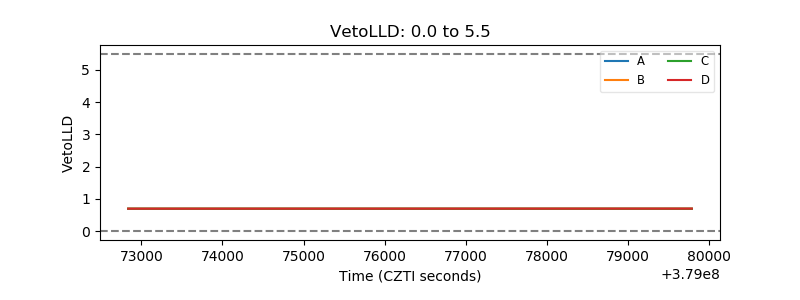 |
| Alpha Counter |  |
| _CPM_Rate | 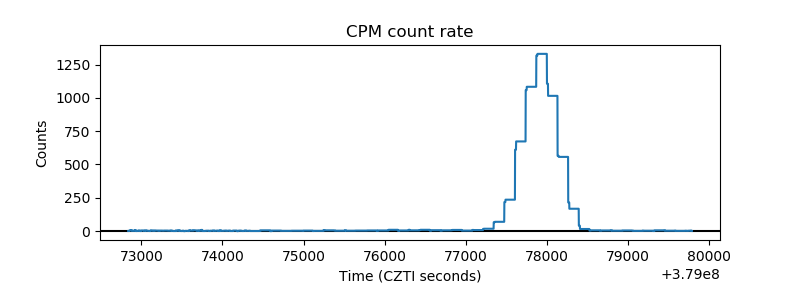 |
| CZT Counter | 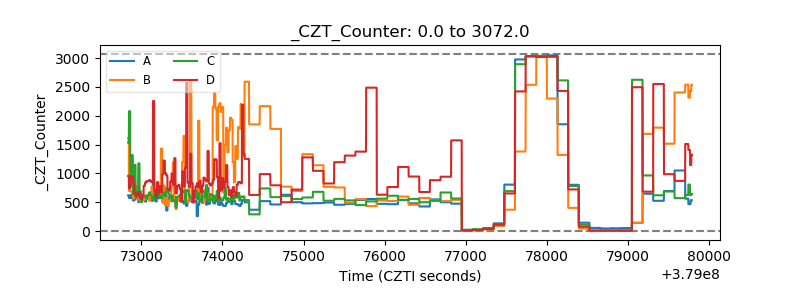 |
| +2.5 Volts monitor |  |
| +5 Volts monitor |  |
| _ROLL_ROT | 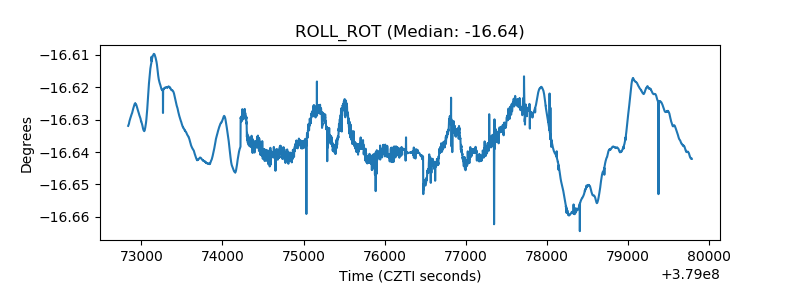 |
| _Roll_DEC | 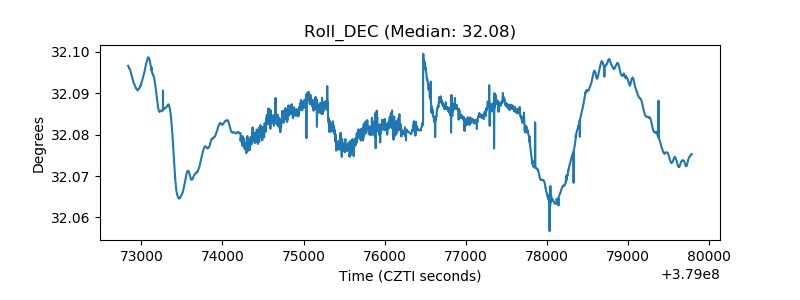 |
| _Roll_RA | 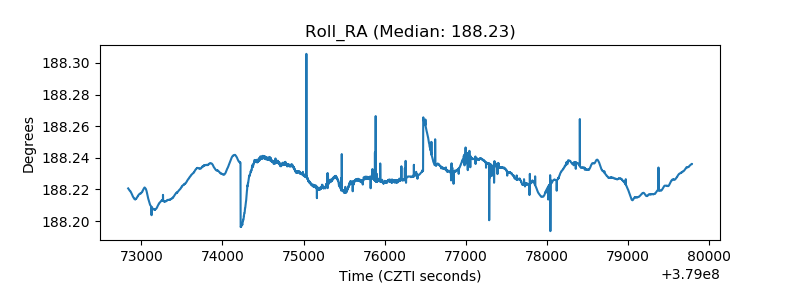 |
| Veto Counter | 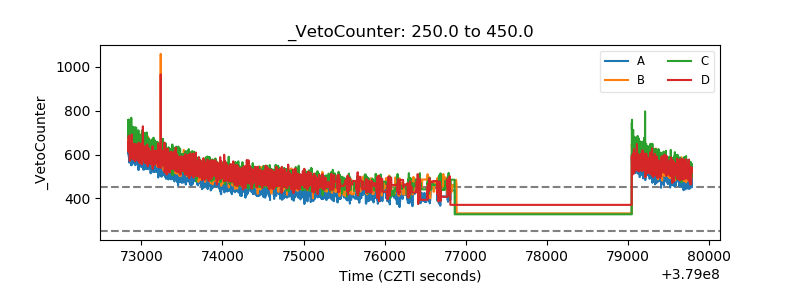 |