| Param | Original file | Final file |
|---|---|---|
| Filename | modeM0/AS1T04_091T01_9000004842_33917cztM0_level2.evt | modeM0/AS1T04_091T01_9000004842_33917cztM0_level2_quad_clean.evt |
| Size (bytes) | 645,151,680 | 47,517,120 |
| Size | 615.3 MB | 45.3 MB |
| Events in quadrant A | 2,754,440 | 288,540 |
| Events in quadrant B | 5,492,864 | 274,109 |
| Events in quadrant C | 3,293,216 | 283,829 |
| Events in quadrant D | 7,644,583 | 225,322 |
| Mode SS | |||
|---|---|---|---|
| Quadrant | BADHDUFLAG | Total packets | Discarded packets |
| A | 0 | 106 | 0 |
| B | 0 | 106 | 0 |
| C | 0 | 106 | 0 |
| D | 0 | 106 | 0 |
| Mode M9 | |||
|---|---|---|---|
| Quadrant | BADHDUFLAG | Total packets | Discarded packets |
| A | 0 | 22 | 0 |
| B | 0 | 22 | 0 |
| C | 0 | 22 | 0 |
| D | 0 | 23 | 0 |
| Mode M0 | |||
|---|---|---|---|
| Quadrant | BADHDUFLAG | Total packets | Discarded packets |
| A | 0 | 11239 | 3 |
| B | 0 | 19623 | 2 |
| C | 0 | 12890 | 2 |
| D | 0 | 26426 | 2 |
| Quadrant | Total seconds | Saturated seconds | Saturation percentage |
|---|---|---|---|
| A | 5229 | 23 | 0.439855% |
| B | 5229 | 1154 | 22.069229% |
| C | 5229 | 97 | 1.855039% |
| D | 5229 | 1588 | 30.369095% |
Noise dominated data is calculated using 1-second bins in cleaned event files. If a bin has >2000 counts, and if more than 50% of those come from <1% of pixels, then it is considered to be noise-dominated and hence unusable.
| Quadrant | # 1 sec bins | Bins with >0 counts | Bins with >2000 counts | High rate bins dominated by noise | Noise dominated (total time) | Noise dominated (detector-on time) | Marked lightcurve |
|---|---|---|---|---|---|---|---|
| A | 7352 | 5230 | 13 | 13 | 0.18% | 0.25% | 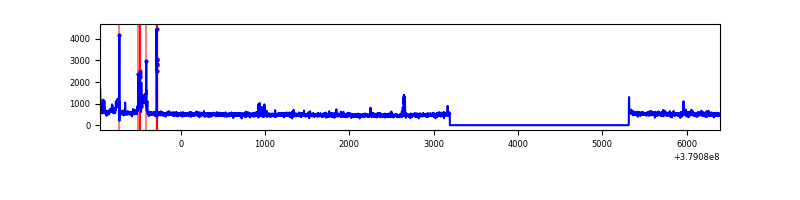 |
| B | 7352 | 5230 | 936 | 936 | 12.73% | 17.90% | 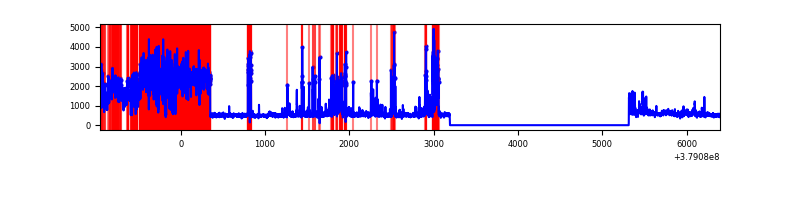 |
| C | 7352 | 5230 | 75 | 75 | 1.02% | 1.43% | 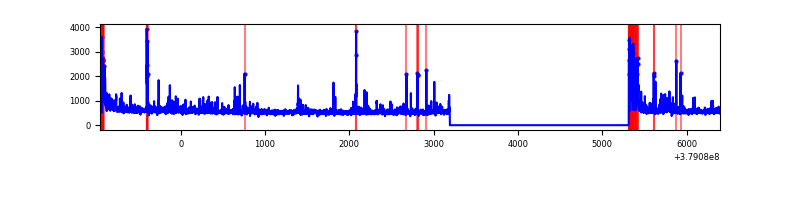 |
| D | 7352 | 5230 | 1174 | 1174 | 15.97% | 22.45% | 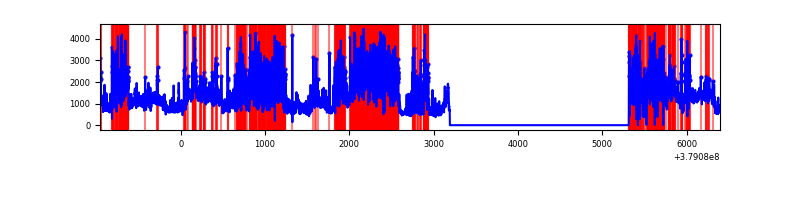 |
Top three noisy pixels from each quadrant. If the there are fewer than three noisy pixels in the level2.evt file, extra rows are filled as -1
| Pixel properties | Quadrant properties | ||||||
|---|---|---|---|---|---|---|---|
| Quadrant | DetID | PixID | Counts | Sigma | Mean | Median | Sigma |
| A | 15 | 169 | 159506 | 1201.56 | 661 | 649 | 132.2 |
| A | 7 | 16 | 15341 | 111.13 | 661 | 649 | 132.2 |
| A | 10 | 83 | 12568 | 90.15 | 661 | 649 | 132.2 |
| B | 4 | 251 | 2545602 | 22763.03 | 591 | 577 | 111.8 |
| B | 5 | 172 | 431284 | 3852.3 | 591 | 577 | 111.8 |
| B | 0 | 219 | 58278 | 516.09 | 591 | 577 | 111.8 |
| C | 0 | 10 | 307280 | 2087.64 | 639 | 646 | 146.9 |
| C | 15 | 214 | 228497 | 1551.26 | 639 | 646 | 146.9 |
| C | 0 | 207 | 157328 | 1066.73 | 639 | 646 | 146.9 |
| D | 10 | 118 | 1574509 | 11647.38 | 548 | 533 | 135.1 |
| D | 8 | 195 | 1379798 | 10206.52 | 548 | 533 | 135.1 |
| D | 12 | 235 | 965718 | 7142.34 | 548 | 533 | 135.1 |
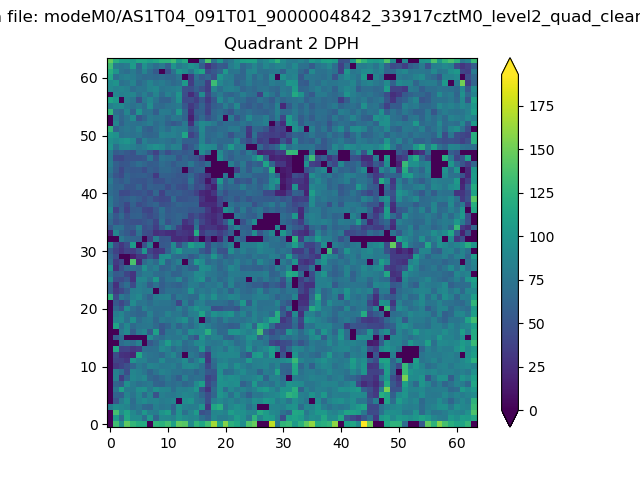
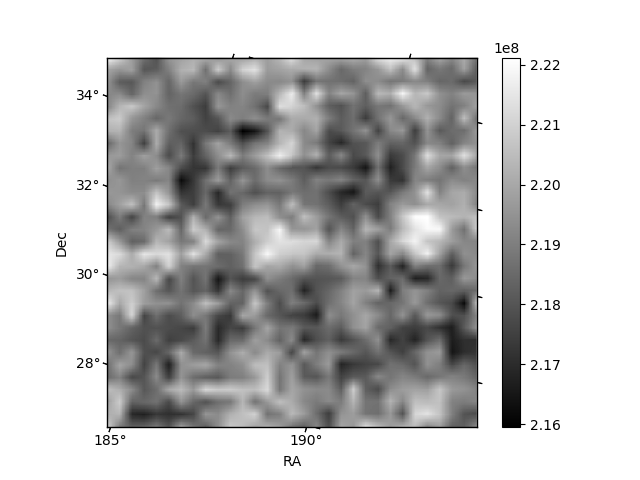
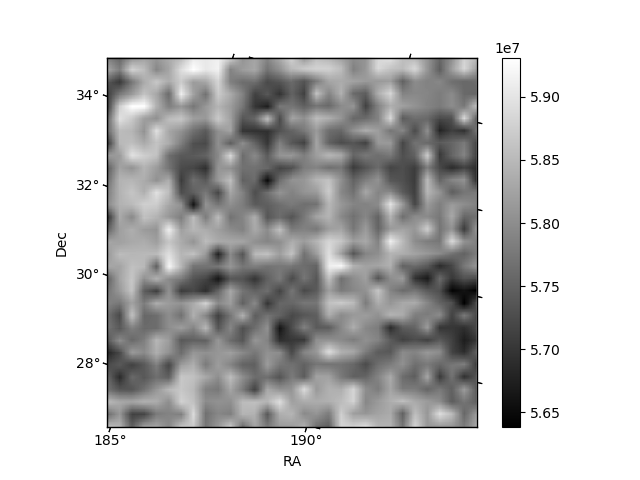
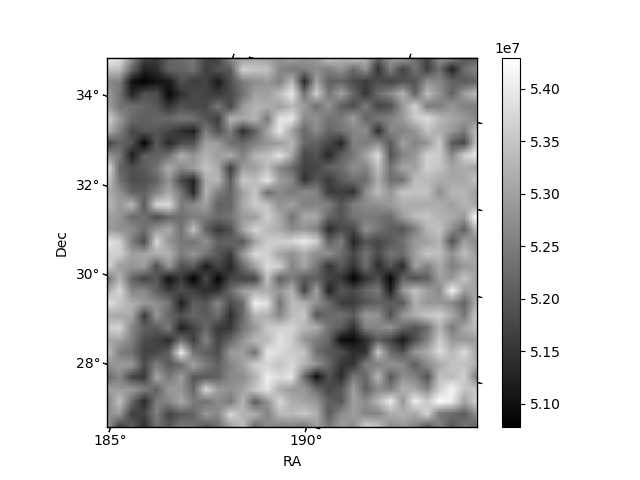
Histogram calculated using DETX and DETY for each event in the final _common_clean file
| Quadrant A | 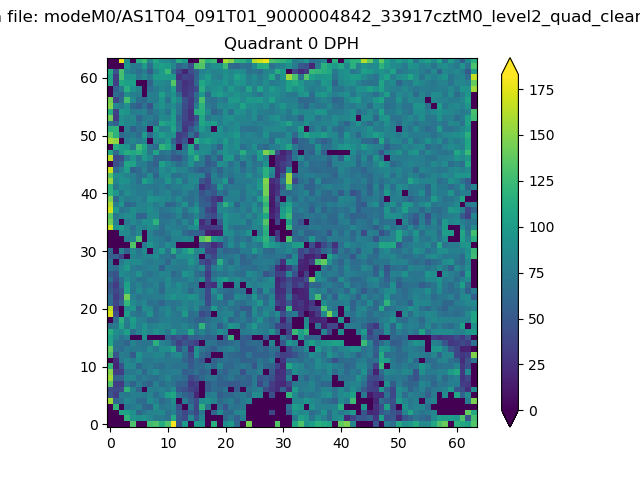 |
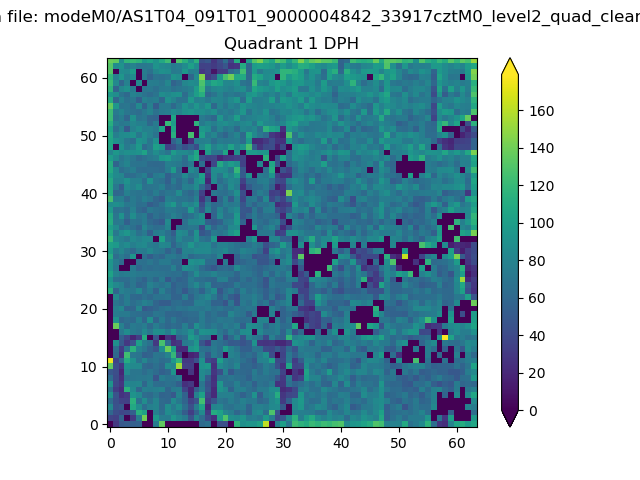 |
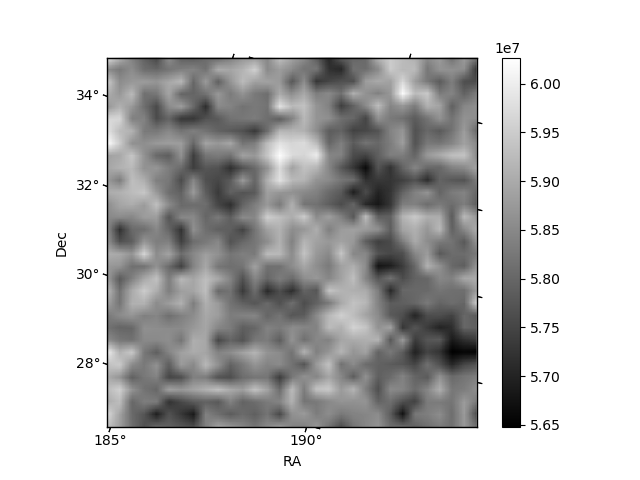
Quadrant B |
|---|---|---|---|
| Quadrant D | 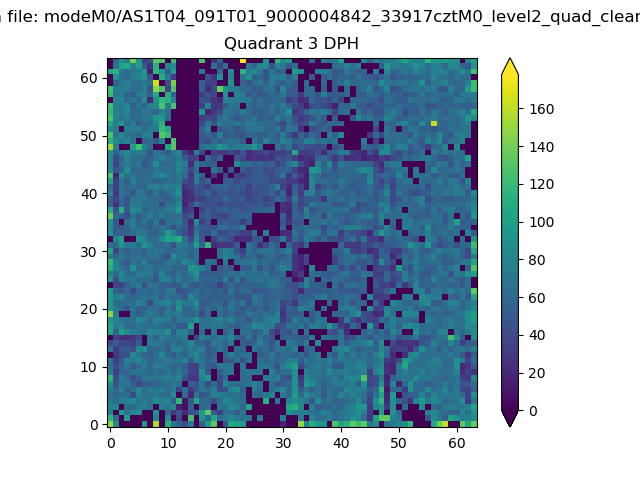 |
 |
Quadrant C |
| Plot type | Count rate plots | Images |
|---|---|---|
| Comparison with Poisson distribution Blue bars denote a histogram of data divided into 1 sec bins. Red curve is a Poisson curve with rate = median count rate of data. |
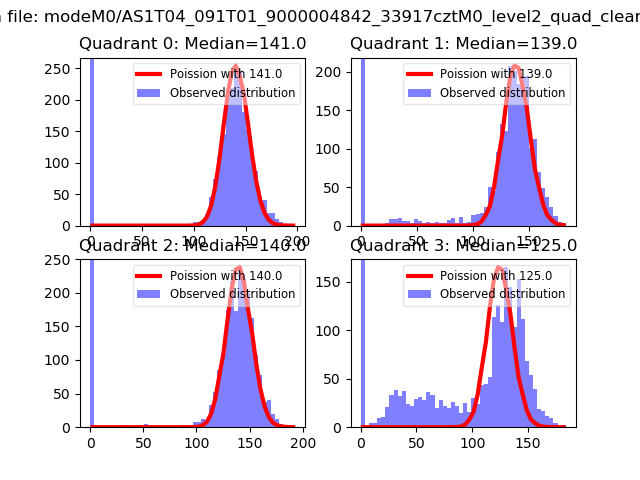 |
 |
| Quadrant-wise count rates Data is divided into 100 sec bins |
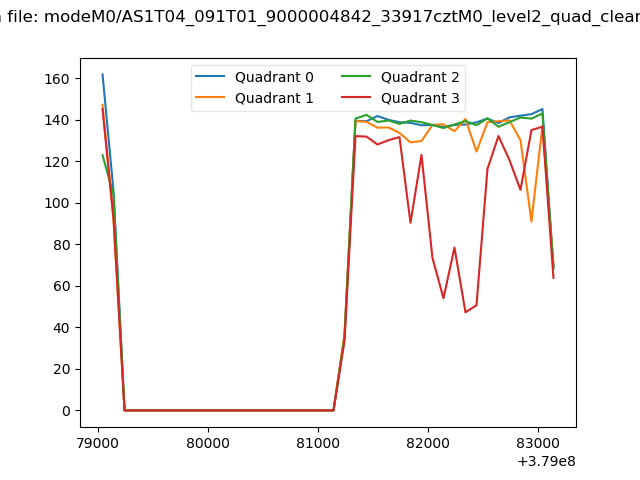 |
|
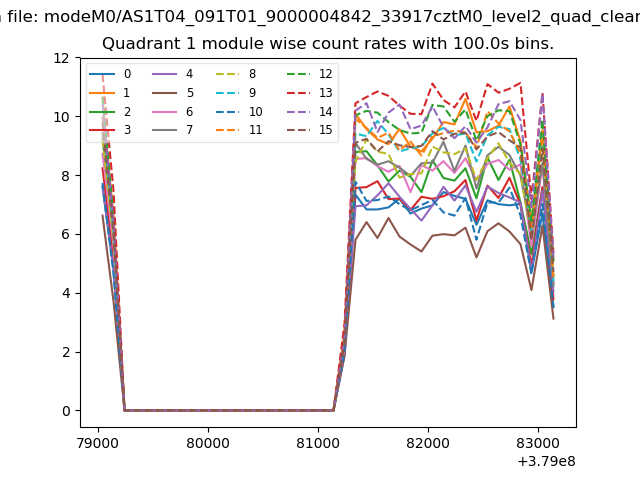
| Module-wise count rates for Quadrant A Data is divided into 100 sec bins |
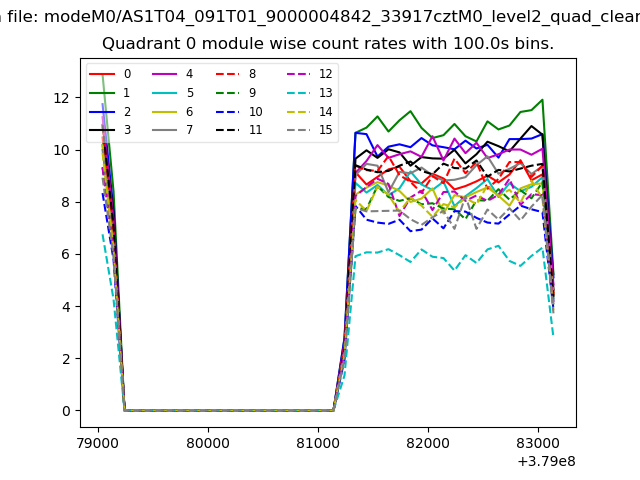 |
 |
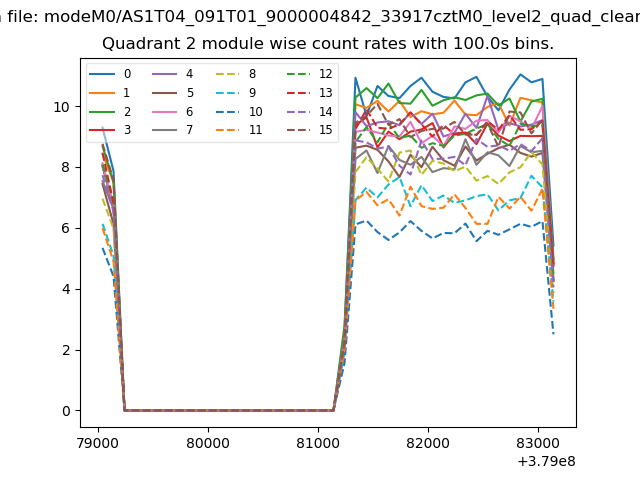
| Module-wise count rates for Quadrant B Data is divided into 100 sec bins |
 |
 |
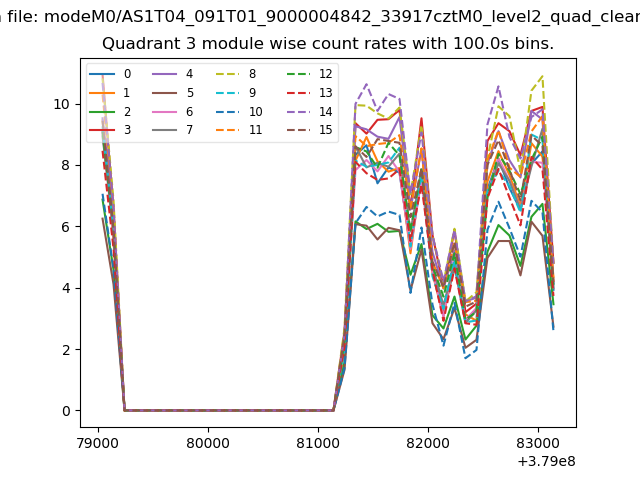
| Module-wise count rates for Quadrant C Data is divided into 100 sec bins |
 |
 |
| Module-wise count rates for Quadrant D Data is divided into 100 sec bins |
 |
 |
| Parameter | Plot |
|---|---|
| CZT HV Monitor |  |
| D_VDD | 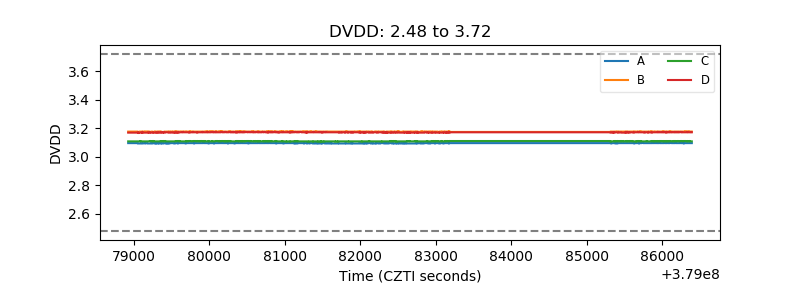 |
| Temperature 1 | 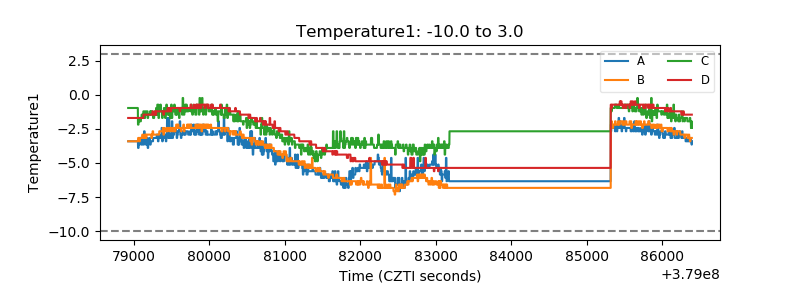 |
| Veto HV Monitor | 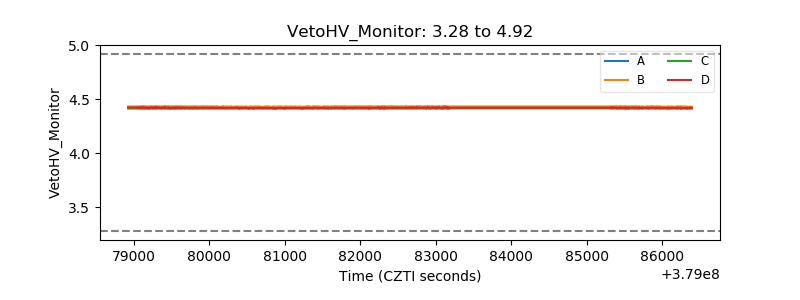 |
| Veto LLD | 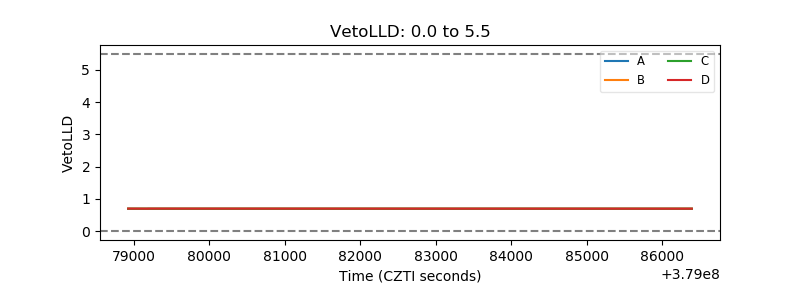 |
| Alpha Counter | 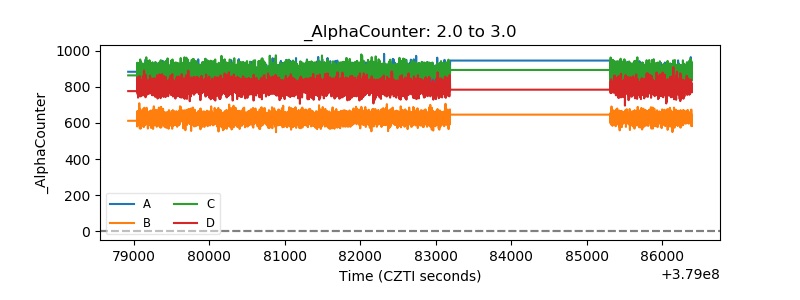 |
| _CPM_Rate | 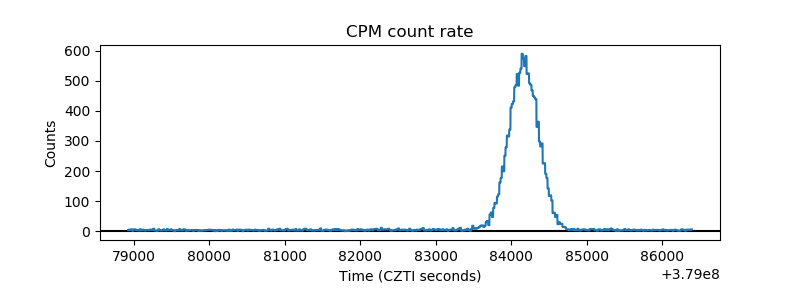 |
| CZT Counter | 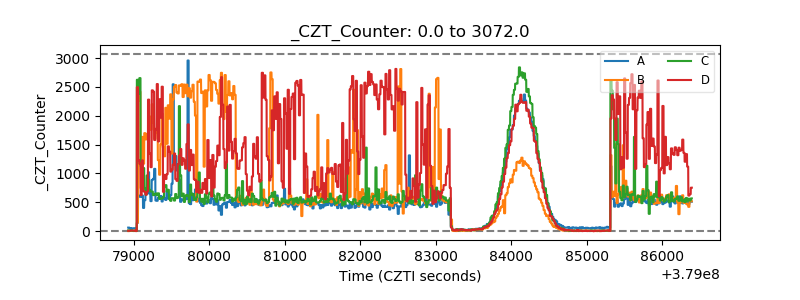 |
| +2.5 Volts monitor |  |
| +5 Volts monitor |  |
| _ROLL_ROT |  |
| _Roll_DEC | 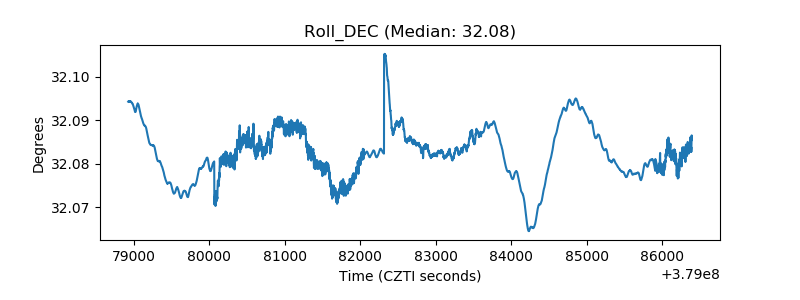 |
| _Roll_RA | 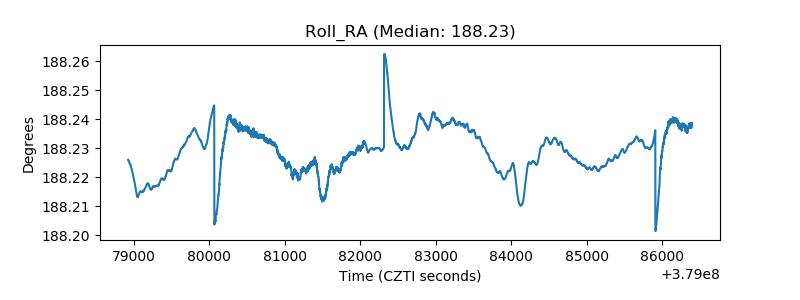 |
| Veto Counter | 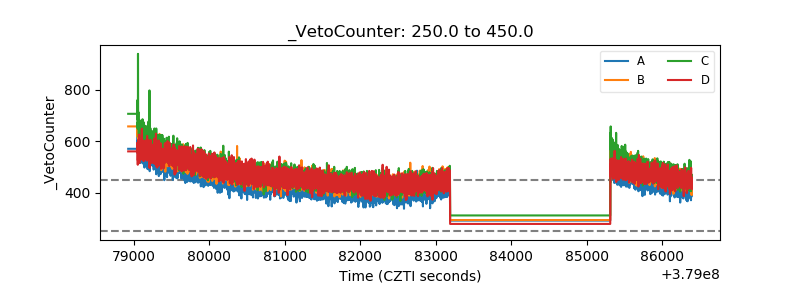 |