| Param | Original file | Final file |
|---|---|---|
| Filename | modeM0/AS1T04_091T01_9000004842_33919cztM0_level2.evt | modeM0/AS1T04_091T01_9000004842_33919cztM0_level2_quad_clean.evt |
| Size (bytes) | 535,354,560 | 66,176,640 |
| Size | 510.6 MB | 63.1 MB |
| Events in quadrant A | 2,992,214 | 410,449 |
| Events in quadrant B | 3,682,618 | 406,325 |
| Events in quadrant C | 3,367,658 | 412,872 |
| Events in quadrant D | 5,798,543 | 389,230 |
| Mode SS | |||
|---|---|---|---|
| Quadrant | BADHDUFLAG | Total packets | Discarded packets |
| A | 0 | 112 | 0 |
| B | 0 | 112 | 0 |
| C | 0 | 112 | 0 |
| D | 0 | 112 | 0 |
| Mode M9 | |||
|---|---|---|---|
| Quadrant | BADHDUFLAG | Total packets | Discarded packets |
| A | 0 | 18 | 0 |
| B | 0 | 18 | 0 |
| C | 0 | 18 | 0 |
| D | 0 | 19 | 0 |
| Mode M0 | |||
|---|---|---|---|
| Quadrant | BADHDUFLAG | Total packets | Discarded packets |
| A | 0 | 12303 | 3 |
| B | 0 | 14385 | 2 |
| C | 0 | 13380 | 2 |
| D | 0 | 21088 | 2 |
| Quadrant | Total seconds | Saturated seconds | Saturation percentage |
|---|---|---|---|
| A | 5499 | 23 | 0.418258% |
| B | 5499 | 341 | 6.201127% |
| C | 5499 | 146 | 2.655028% |
| D | 5499 | 472 | 8.583379% |
Noise dominated data is calculated using 1-second bins in cleaned event files. If a bin has >2000 counts, and if more than 50% of those come from <1% of pixels, then it is considered to be noise-dominated and hence unusable.
| Quadrant | # 1 sec bins | Bins with >0 counts | Bins with >2000 counts | High rate bins dominated by noise | Noise dominated (total time) | Noise dominated (detector-on time) | Marked lightcurve |
|---|---|---|---|---|---|---|---|
| A | 7140 | 5500 | 8 | 8 | 0.11% | 0.15% | 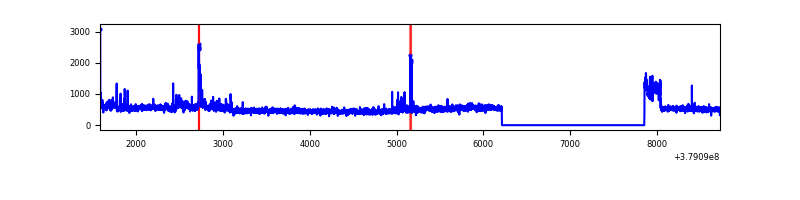 |
| B | 7140 | 5500 | 226 | 226 | 3.17% | 4.11% | 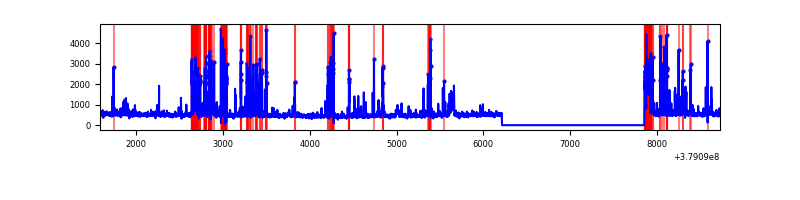 |
| C | 7140 | 5500 | 107 | 107 | 1.50% | 1.95% | 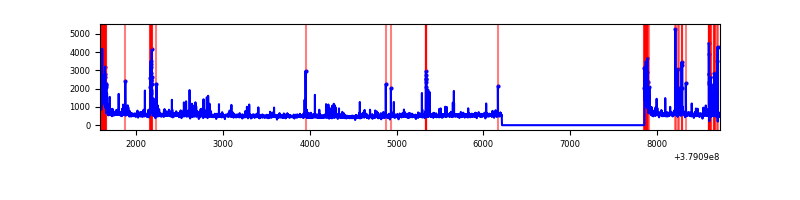 |
| D | 7140 | 5500 | 393 | 393 | 5.50% | 7.15% | 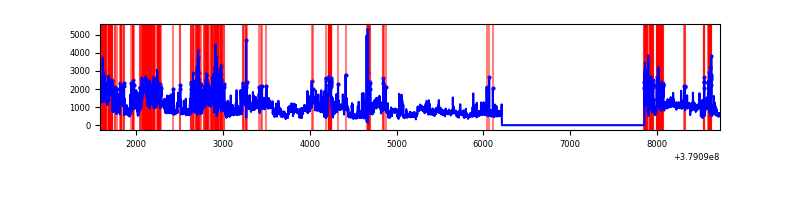 |
Top three noisy pixels from each quadrant. If the there are fewer than three noisy pixels in the level2.evt file, extra rows are filled as -1
| Pixel properties | Quadrant properties | ||||||
|---|---|---|---|---|---|---|---|
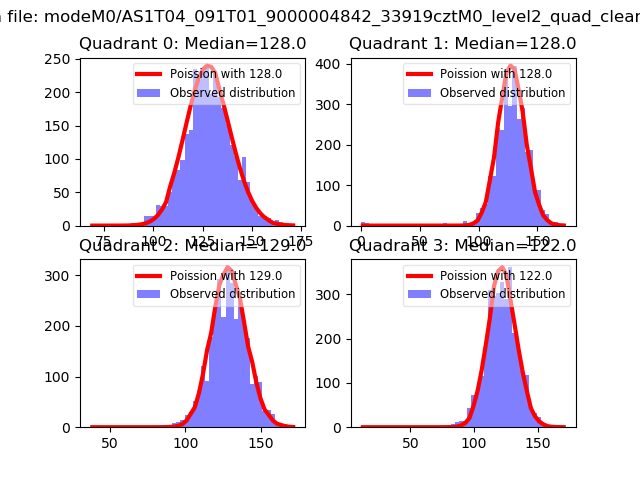
| Quadrant | DetID | PixID | Counts | Sigma | Mean | Median | Sigma |
| A | 15 | 169 | 445604 | 3402.37 | 646 | 633 | 130.8 |
| A | 7 | 16 | 20939 | 155.27 | 646 | 633 | 130.8 |
| A | 10 | 83 | 13424 | 97.8 | 646 | 633 | 130.8 |
| B | 5 | 172 | 908269 | 7553.27 | 627 | 609 | 120.2 |
| B | 0 | 229 | 83989 | 693.86 | 627 | 609 | 120.2 |
| B | 4 | 251 | 43580 | 357.59 | 627 | 609 | 120.2 |
| C | 0 | 207 | 301746 | 2096.56 | 624 | 628 | 143.6 |
| C | 0 | 10 | 279128 | 1939.08 | 624 | 628 | 143.6 |
| C | 15 | 214 | 237849 | 1651.67 | 624 | 628 | 143.6 |
| D | 8 | 195 | 1456487 | 9520.26 | 616 | 597 | 152.9 |
| D | 1 | 52 | 536438 | 3503.93 | 616 | 597 | 152.9 |
| D | 1 | 47 | 514265 | 3358.94 | 616 | 597 | 152.9 |
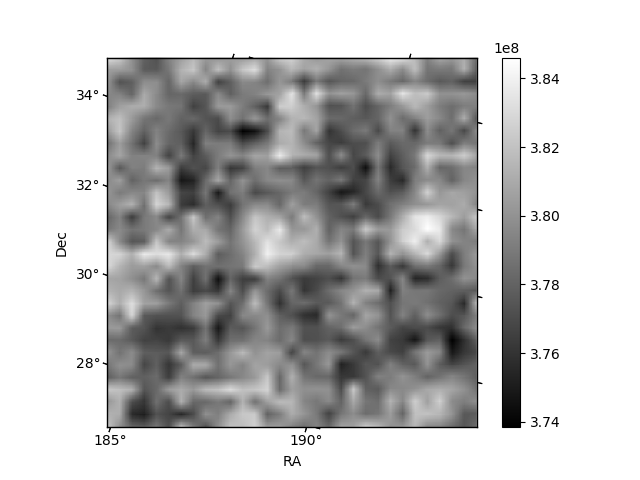
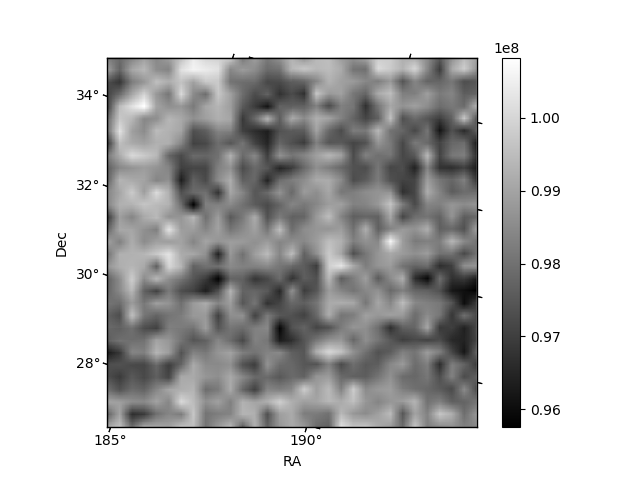
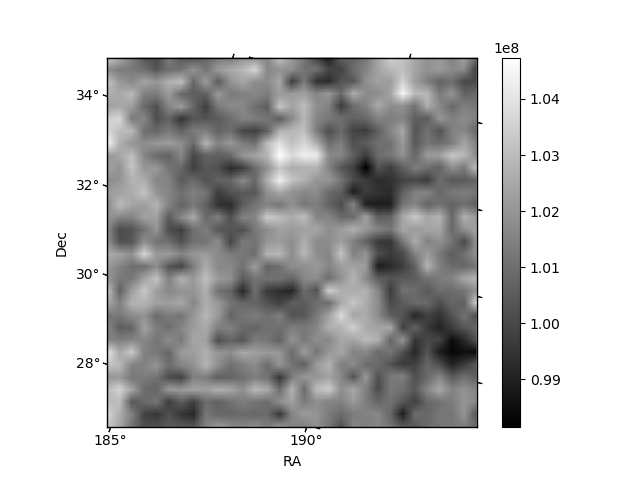
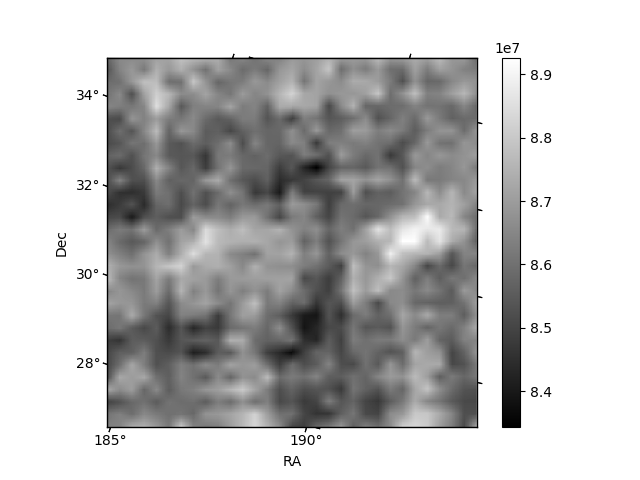
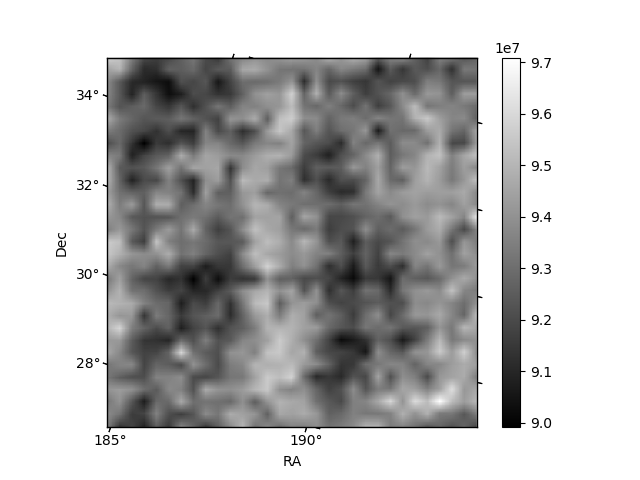
Histogram calculated using DETX and DETY for each event in the final _common_clean file
| Quadrant A | 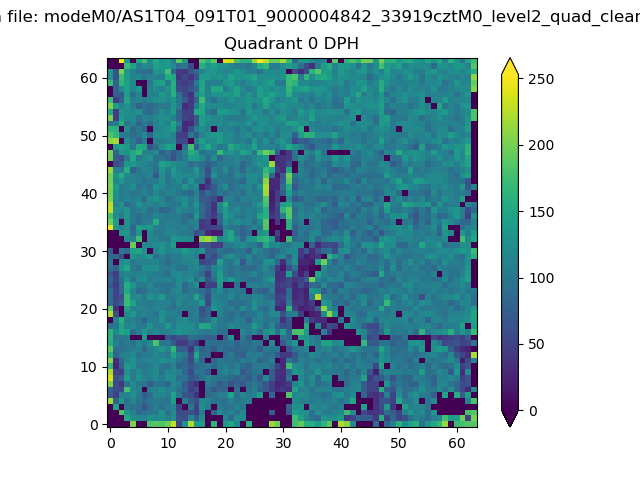 |
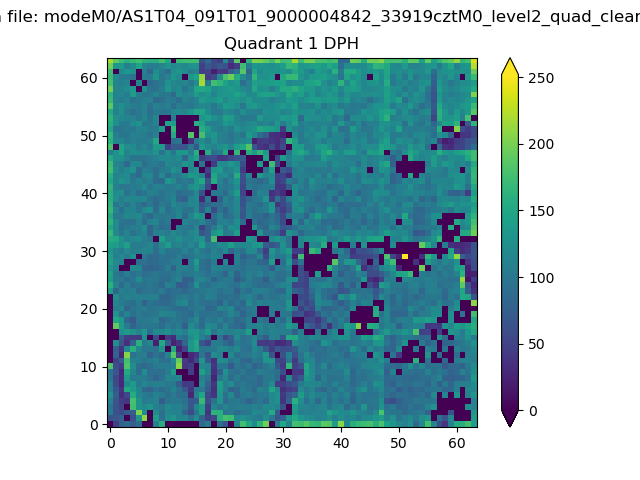 |
Quadrant B |
|---|---|---|---|
| Quadrant D | 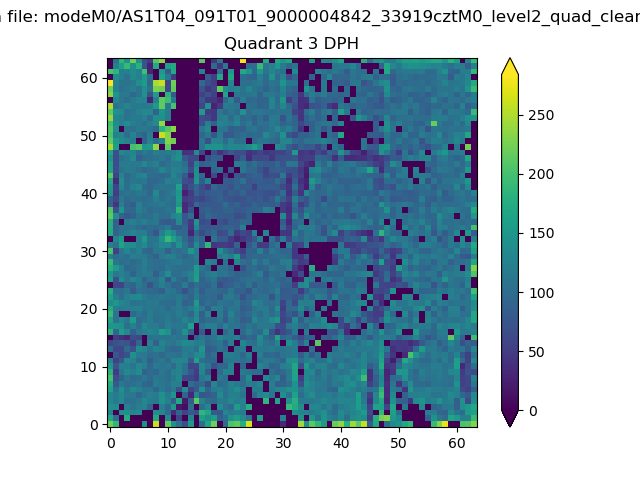 |
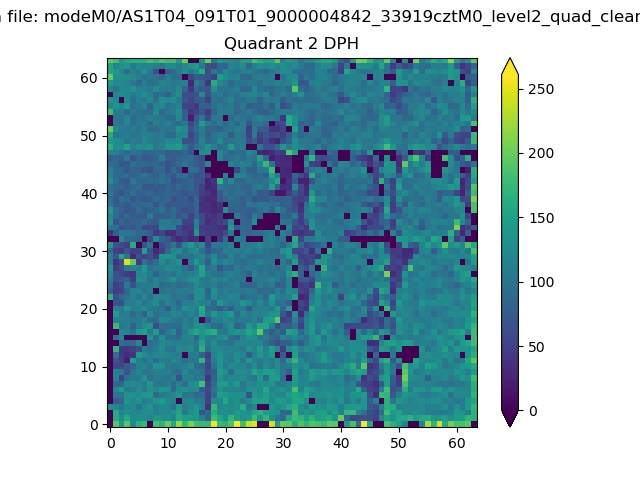 |
Quadrant C |
| Plot type | Count rate plots | Images |
|---|---|---|
| Comparison with Poisson distribution Blue bars denote a histogram of data divided into 1 sec bins. Red curve is a Poisson curve with rate = median count rate of data. |
 |
 |
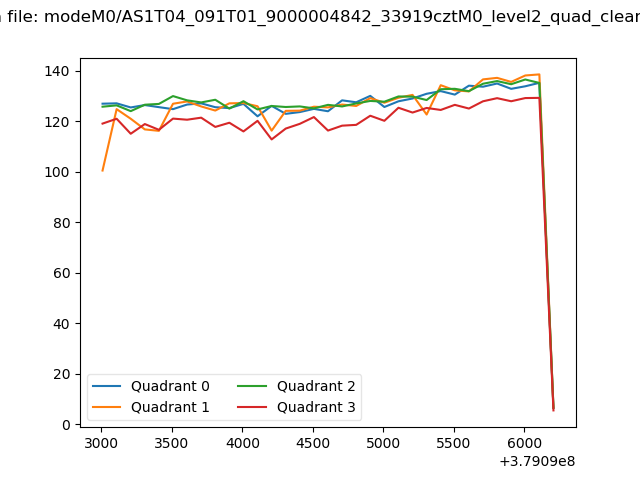
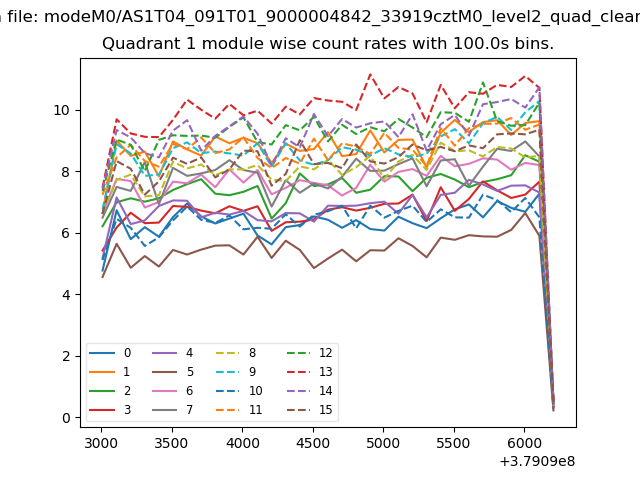
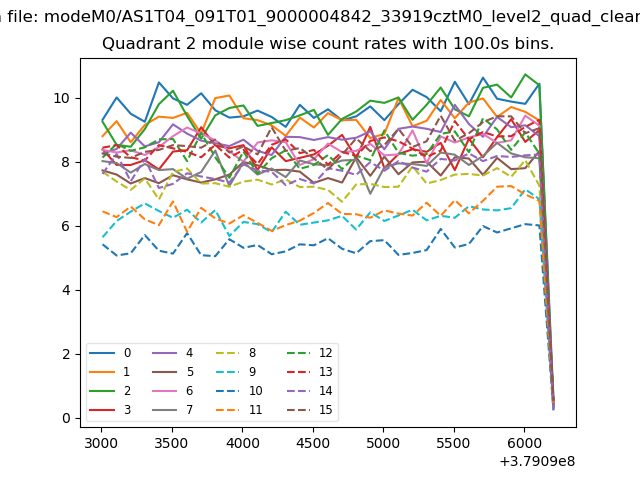
| Quadrant-wise count rates Data is divided into 100 sec bins |
 |
|
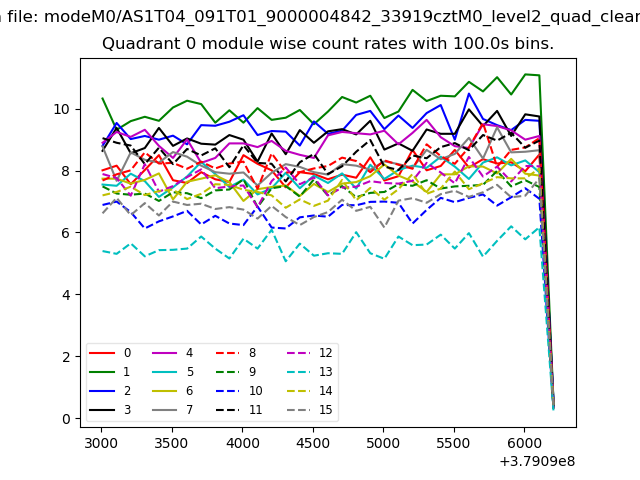
| Module-wise count rates for Quadrant A Data is divided into 100 sec bins |
 |
 |
| Module-wise count rates for Quadrant B Data is divided into 100 sec bins |
 |
 |
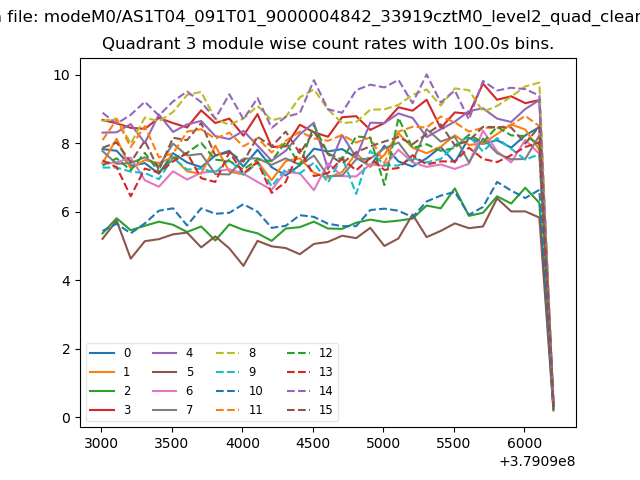
| Module-wise count rates for Quadrant C Data is divided into 100 sec bins |
 |
 |
| Module-wise count rates for Quadrant D Data is divided into 100 sec bins |
 |
 |
| Parameter | Plot |
|---|---|
| CZT HV Monitor | 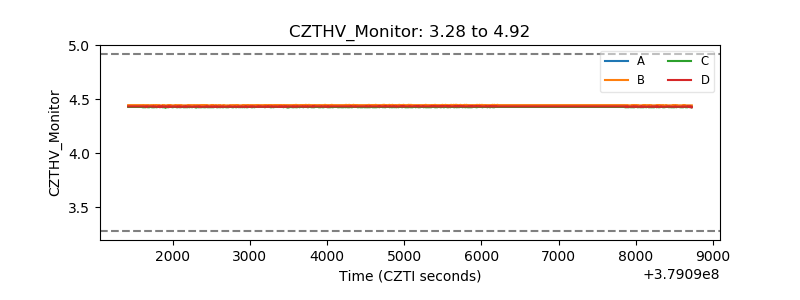 |
| D_VDD | 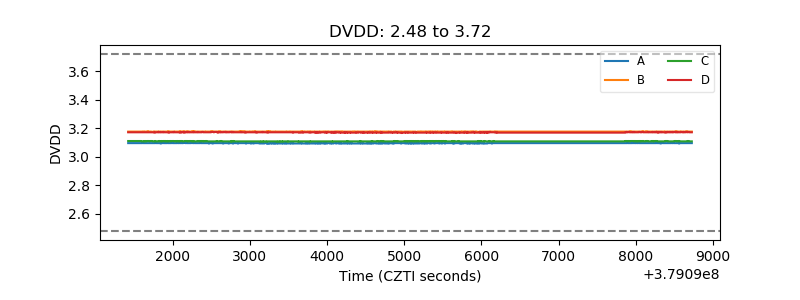 |
| Temperature 1 | 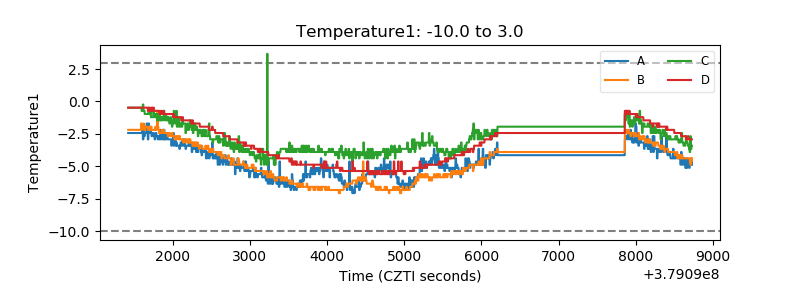 |
| Veto HV Monitor | 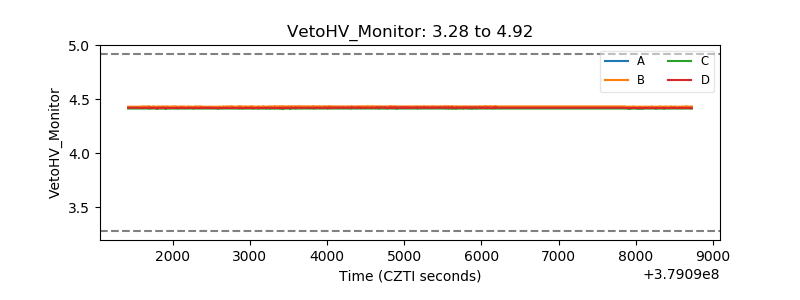 |
| Veto LLD | 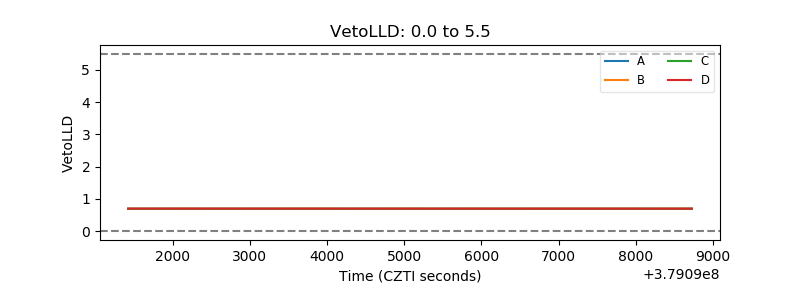 |
| Alpha Counter | 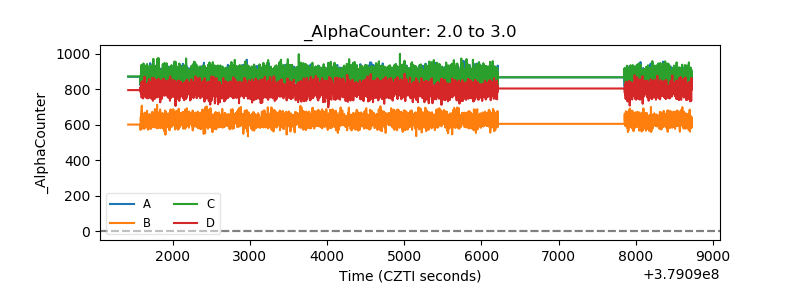 |
| _CPM_Rate | 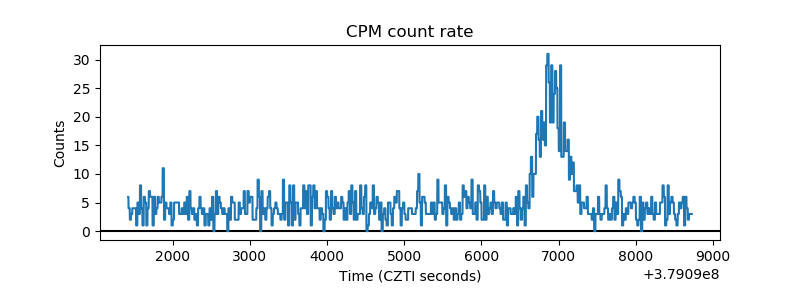 |
| CZT Counter | 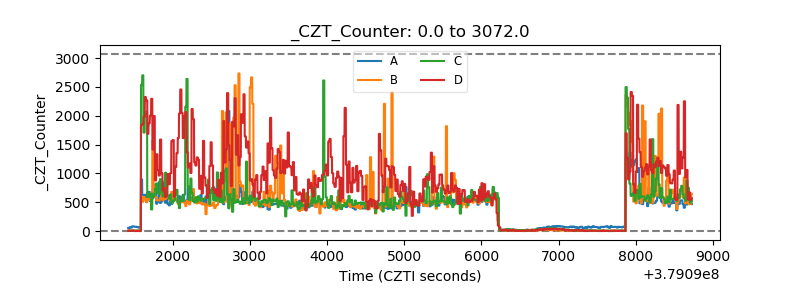 |
| +2.5 Volts monitor |  |
| +5 Volts monitor |  |
| _ROLL_ROT | 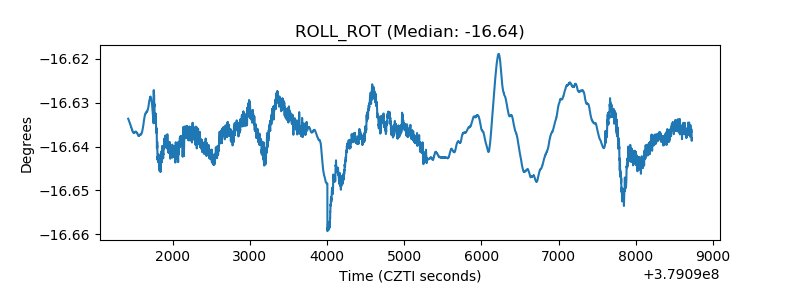 |
| _Roll_DEC | 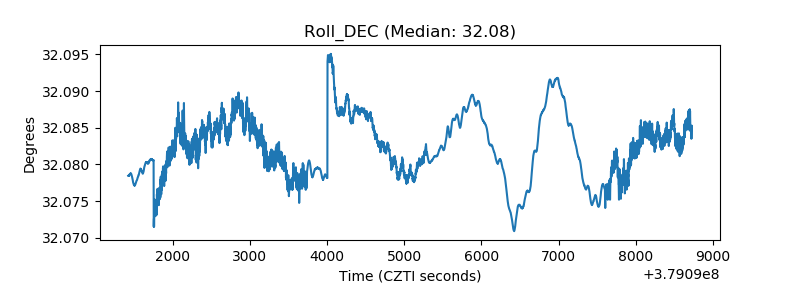 |
| _Roll_RA | 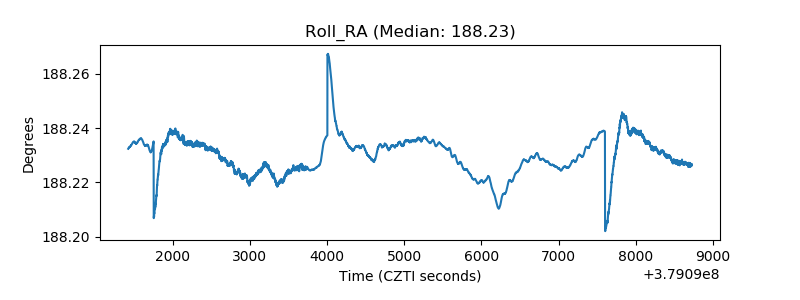 |
| Veto Counter | 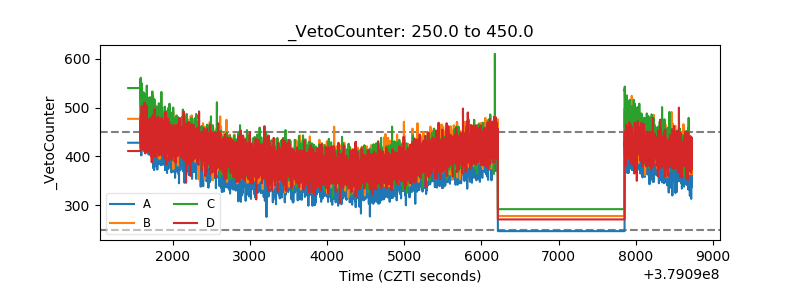 |