| Param | Original file | Final file |
|---|---|---|
| Filename | modeM0/AS1T04_091T01_9000004842_33920cztM0_level2.evt | modeM0/AS1T04_091T01_9000004842_33920cztM0_level2_quad_clean.evt |
| Size (bytes) | 561,674,880 | 77,448,960 |
| Size | 535.7 MB | 73.9 MB |
| Events in quadrant A | 4,076,504 | 493,677 |
| Events in quadrant B | 3,850,755 | 488,163 |
| Events in quadrant C | 3,380,243 | 499,848 |
| Events in quadrant D | 5,318,109 | 465,563 |
| Mode SS | |||
|---|---|---|---|
| Quadrant | BADHDUFLAG | Total packets | Discarded packets |
| A | 0 | 114 | 0 |
| B | 0 | 114 | 0 |
| C | 0 | 114 | 0 |
| D | 0 | 114 | 0 |
| Mode M9 | |||
|---|---|---|---|
| Quadrant | BADHDUFLAG | Total packets | Discarded packets |
| A | 0 | 25 | 0 |
| B | 0 | 25 | 0 |
| C | 0 | 25 | 0 |
| D | 0 | 26 | 0 |
| Mode M0 | |||
|---|---|---|---|
| Quadrant | BADHDUFLAG | Total packets | Discarded packets |
| A | 0 | 15915 | 2 |
| B | 0 | 15088 | 1 |
| C | 0 | 13428 | 1 |
| D | 0 | 19608 | 1 |
| Quadrant | Total seconds | Saturated seconds | Saturation percentage |
|---|---|---|---|
| A | 5695 | 71 | 1.246708% |
| B | 5695 | 365 | 6.409131% |
| C | 5695 | 114 | 2.001756% |
| D | 5695 | 470 | 8.252853% |
Noise dominated data is calculated using 1-second bins in cleaned event files. If a bin has >2000 counts, and if more than 50% of those come from <1% of pixels, then it is considered to be noise-dominated and hence unusable.
| Quadrant | # 1 sec bins | Bins with >0 counts | Bins with >2000 counts | High rate bins dominated by noise | Noise dominated (total time) | Noise dominated (detector-on time) | Marked lightcurve |
|---|---|---|---|---|---|---|---|
| A | 7068 | 5696 | 0 | 0 | 0.00% | 0.00% | 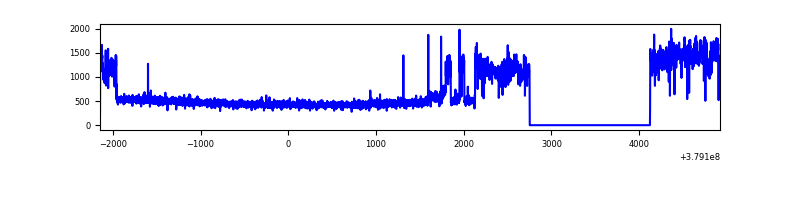 |
| B | 7068 | 5696 | 241 | 241 | 3.41% | 4.23% | 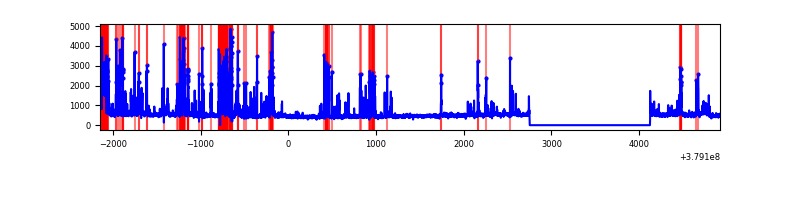 |
| C | 7068 | 5696 | 84 | 84 | 1.19% | 1.47% | 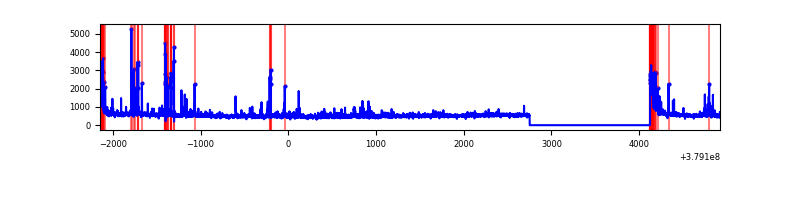 |
| D | 7068 | 5696 | 343 | 343 | 4.85% | 6.02% | 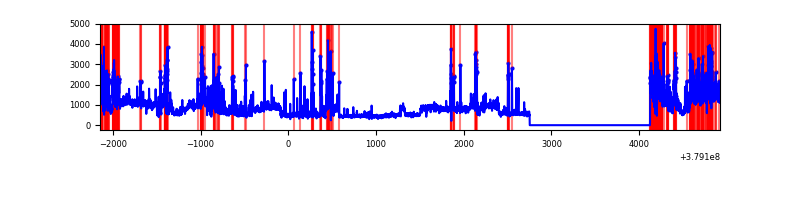 |
Top three noisy pixels from each quadrant. If the there are fewer than three noisy pixels in the level2.evt file, extra rows are filled as -1
| Pixel properties | Quadrant properties | ||||||
|---|---|---|---|---|---|---|---|
| Quadrant | DetID | PixID | Counts | Sigma | Mean | Median | Sigma |
| A | 15 | 169 | 1485484 | 11046.57 | 664 | 650 | 134.4 |
| A | 10 | 83 | 13518 | 95.73 | 664 | 650 | 134.4 |
| A | 13 | 254 | 10499 | 73.27 | 664 | 650 | 134.4 |
| B | 5 | 172 | 901828 | 7333.6 | 642 | 625 | 122.9 |
| B | 0 | 229 | 132501 | 1073.15 | 642 | 625 | 122.9 |
| B | 5 | 255 | 58845 | 473.77 | 642 | 625 | 122.9 |
| C | 0 | 10 | 329016 | 2208.58 | 641 | 647 | 148.7 |
| C | 15 | 214 | 246246 | 1651.87 | 641 | 647 | 148.7 |
| C | 0 | 207 | 175803 | 1178.08 | 641 | 647 | 148.7 |
| D | 8 | 195 | 1430390 | 8444.4 | 624 | 613 | 169.3 |
| D | 1 | 47 | 447259 | 2637.94 | 624 | 613 | 169.3 |
| D | 12 | 235 | 262439 | 1546.37 | 624 | 613 | 169.3 |
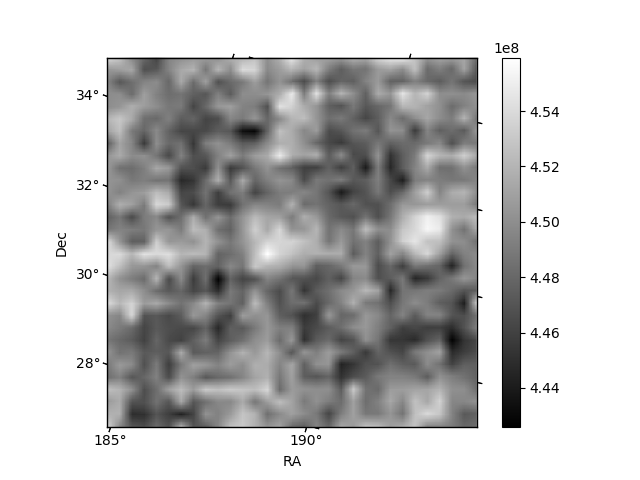
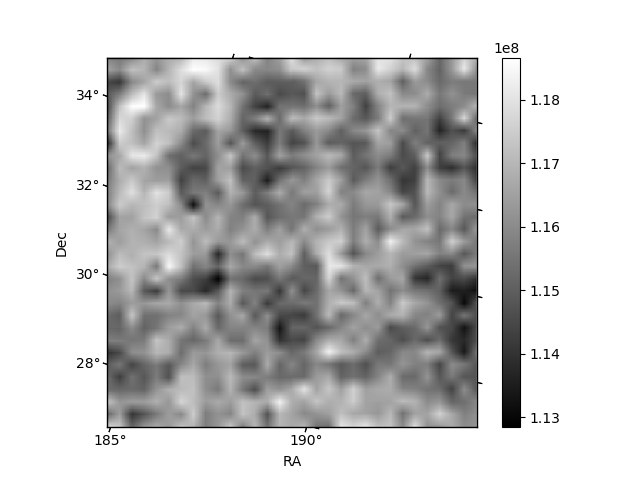
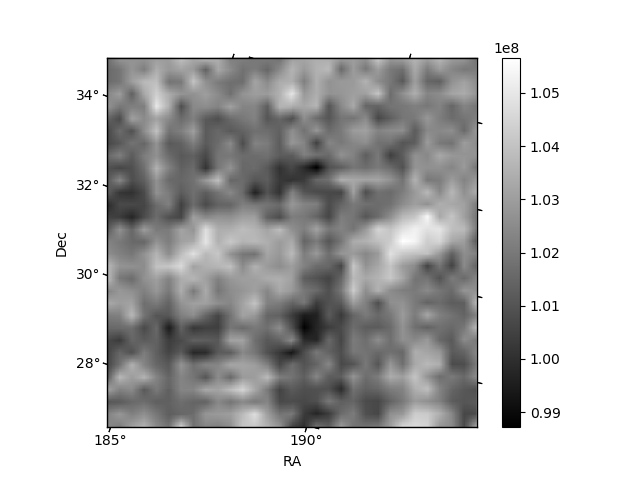
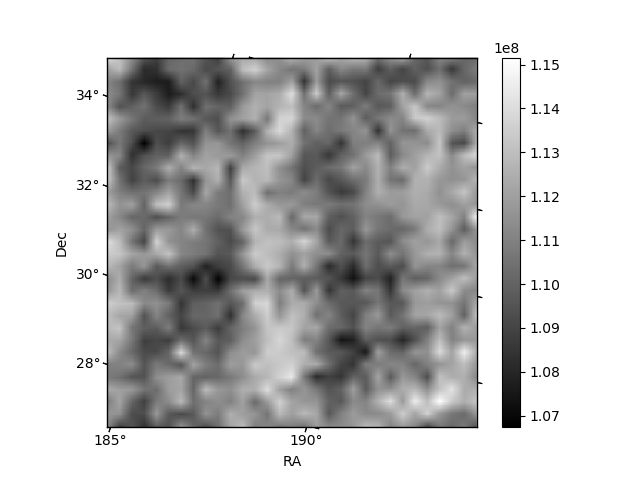
Histogram calculated using DETX and DETY for each event in the final _common_clean file
| Quadrant A | 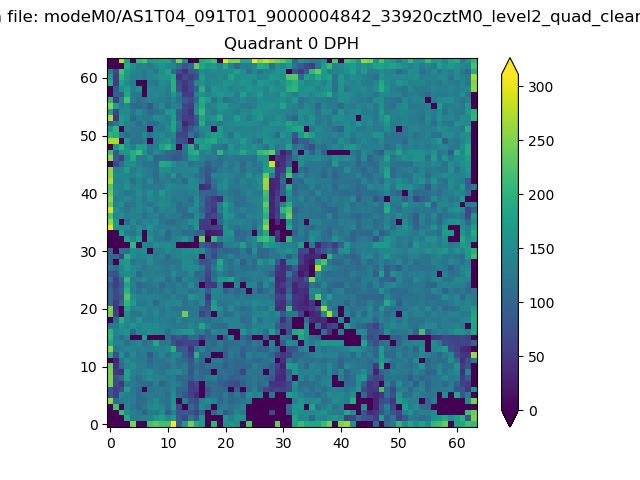 |
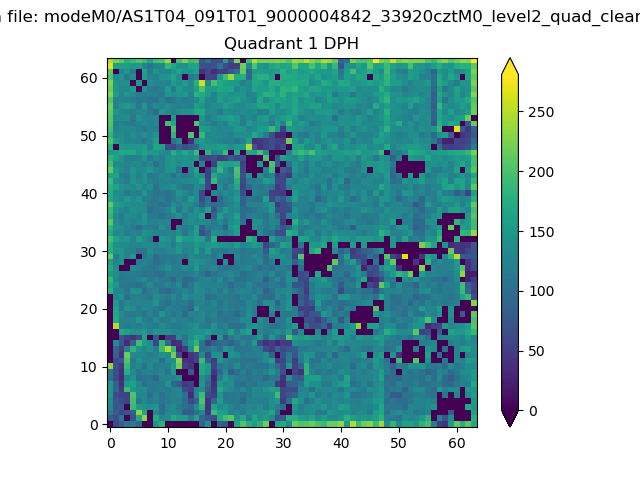 |
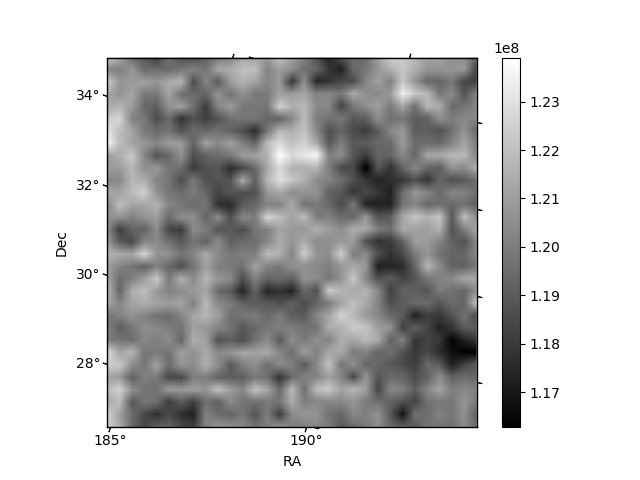
Quadrant B |
|---|---|---|---|
| Quadrant D | 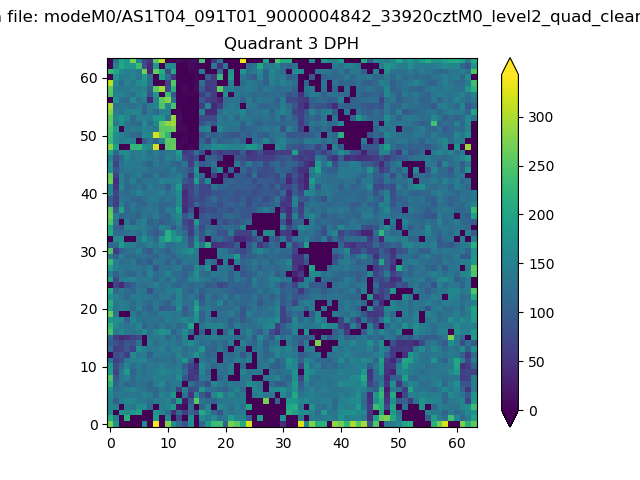 |
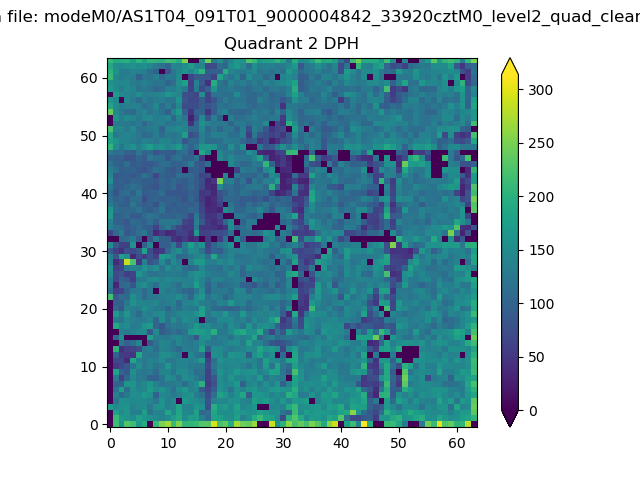 |
Quadrant C |
| Plot type | Count rate plots | Images |
|---|---|---|
| Comparison with Poisson distribution Blue bars denote a histogram of data divided into 1 sec bins. Red curve is a Poisson curve with rate = median count rate of data. |
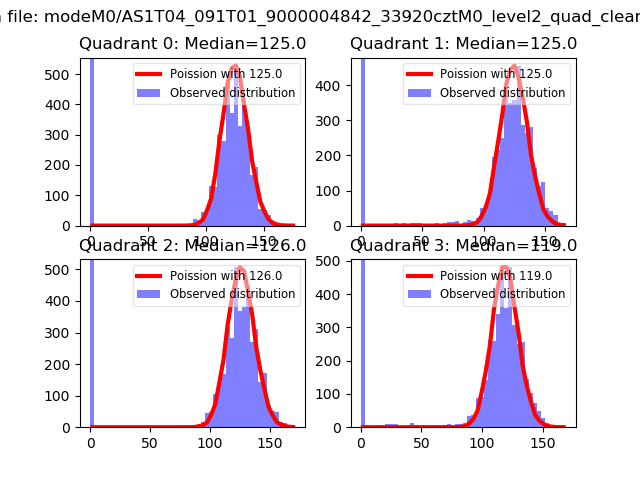 |
 |
| Quadrant-wise count rates Data is divided into 100 sec bins |
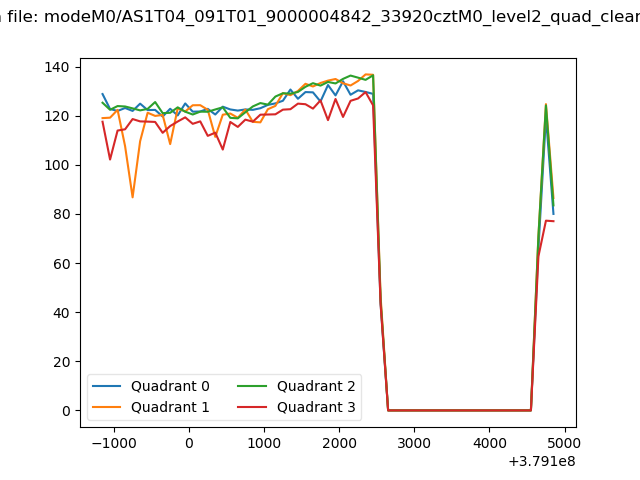 |
|
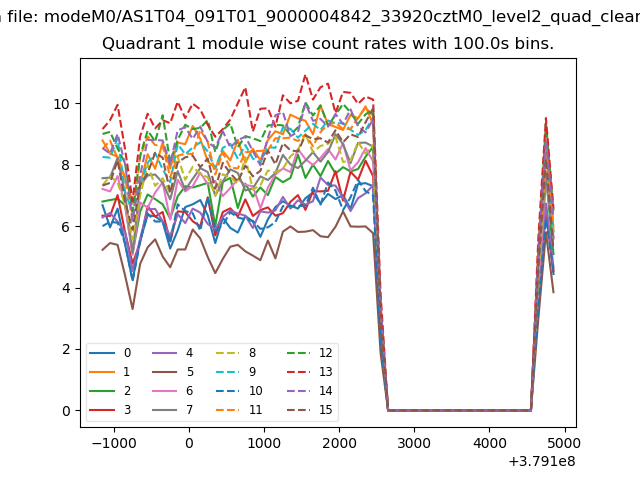
| Module-wise count rates for Quadrant A Data is divided into 100 sec bins |
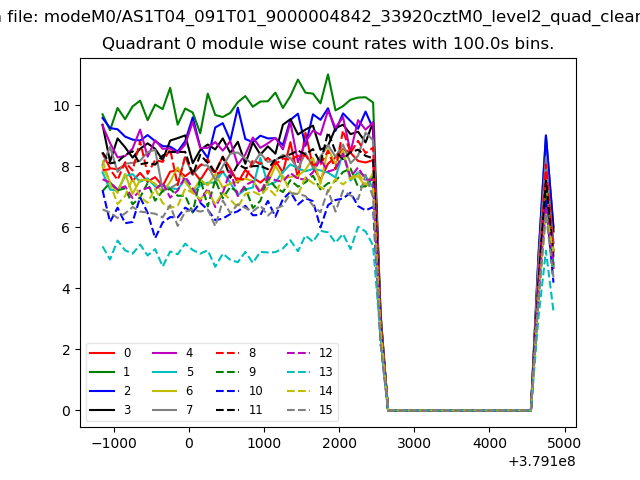 |
 |
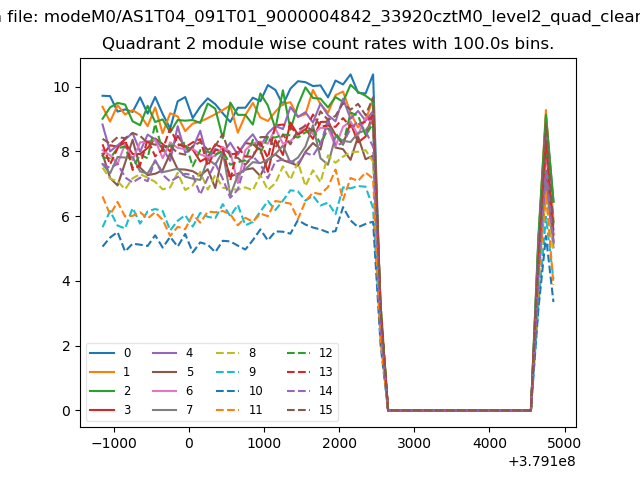
| Module-wise count rates for Quadrant B Data is divided into 100 sec bins |
 |
 |
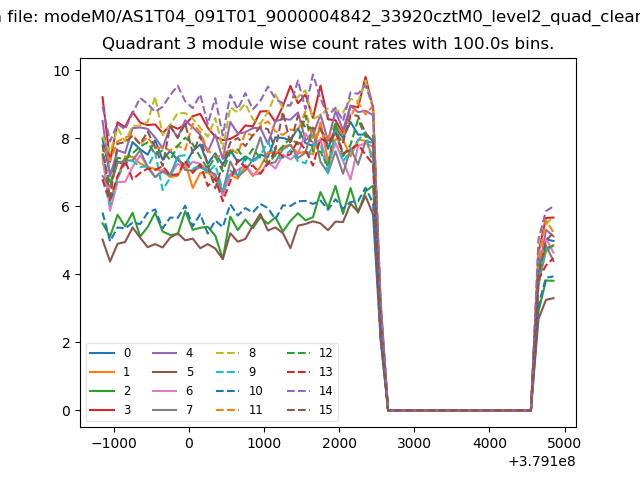
| Module-wise count rates for Quadrant C Data is divided into 100 sec bins |
 |
 |
| Module-wise count rates for Quadrant D Data is divided into 100 sec bins |
 |
 |
| Parameter | Plot |
|---|---|
| CZT HV Monitor | 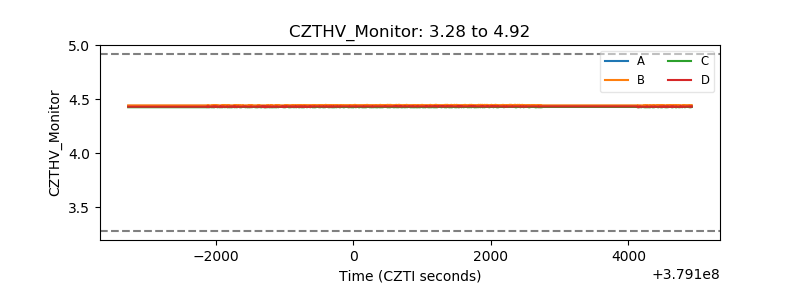 |
| D_VDD | 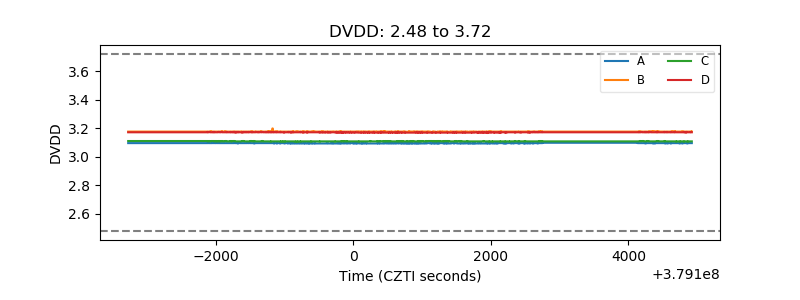 |
| Temperature 1 | 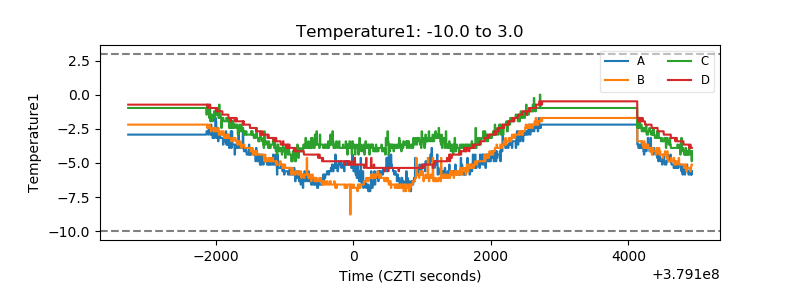 |
| Veto HV Monitor | 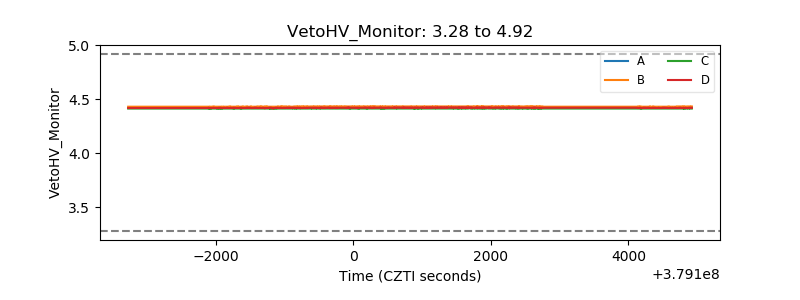 |
| Veto LLD | 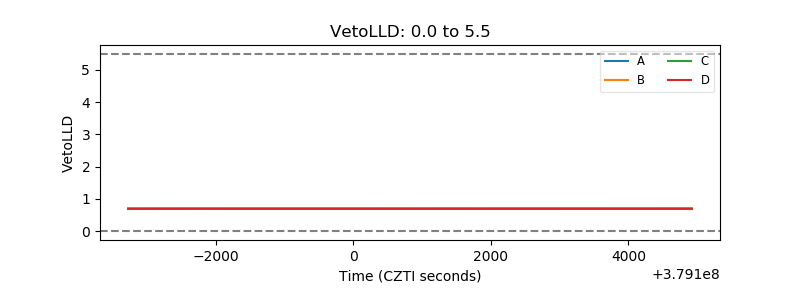 |
| Alpha Counter | 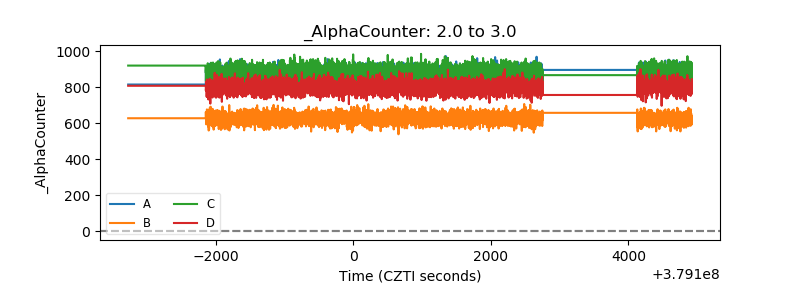 |
| _CPM_Rate | 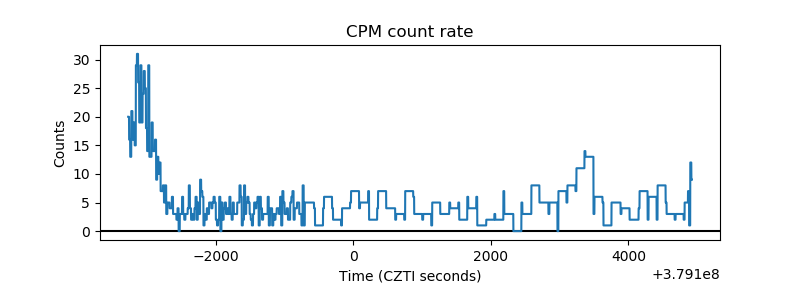 |
| CZT Counter | 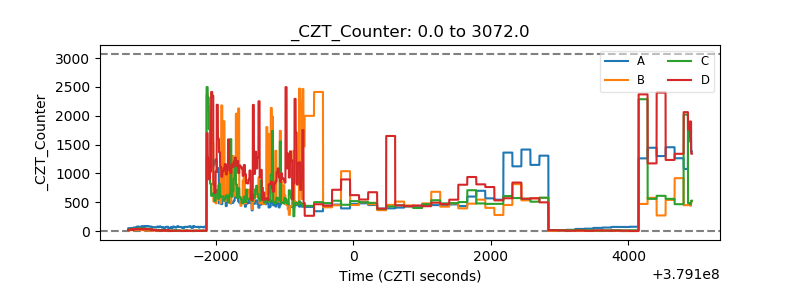 |
| +2.5 Volts monitor |  |
| +5 Volts monitor | 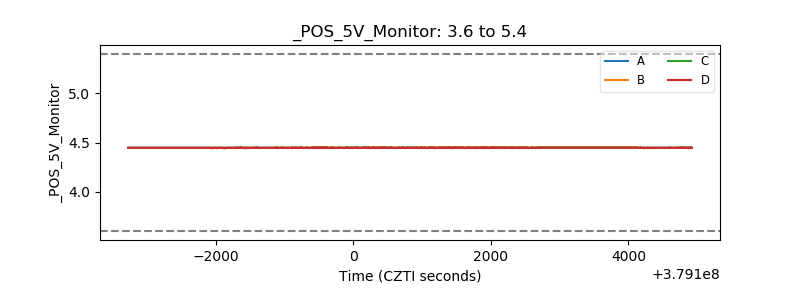 |
| _ROLL_ROT | 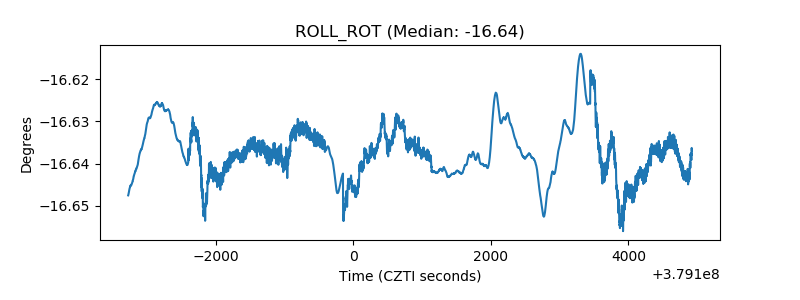 |
| _Roll_DEC | 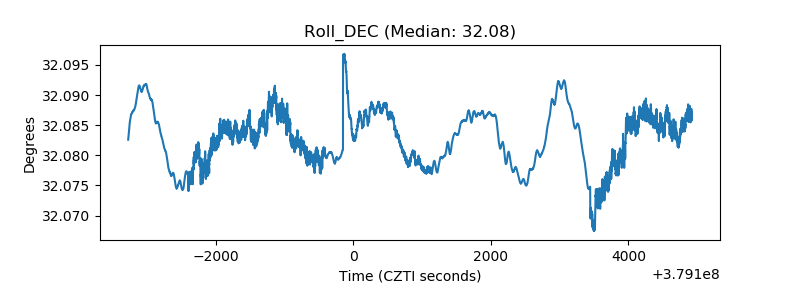 |
| _Roll_RA | 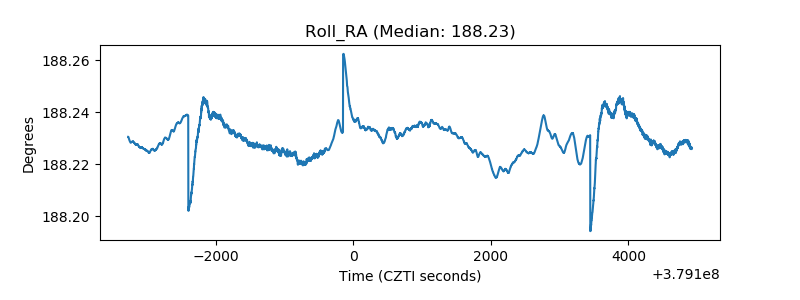 |
| Veto Counter | 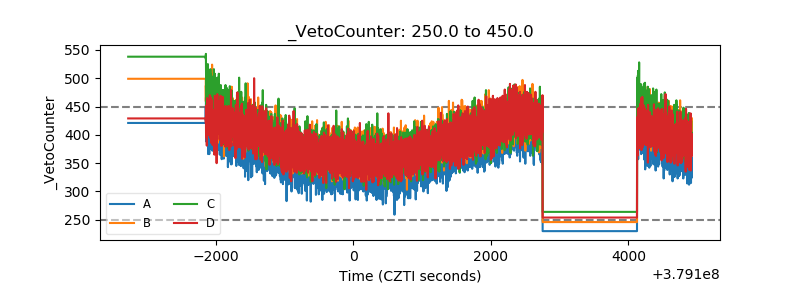 |