| Param | Original file | Final file |
|---|---|---|
| Filename | modeM0/AS1T04_088T01_9000004844_33930cztM0_level2.evt | modeM0/AS1T04_088T01_9000004844_33930cztM0_level2_quad_clean.evt |
| Size (bytes) | 460,036,800 | 80,781,120 |
| Size | 438.7 MB | 77.0 MB |
| Events in quadrant A | 2,901,091 | 543,090 |
| Events in quadrant B | 3,133,756 | 536,840 |
| Events in quadrant C | 3,349,615 | 513,984 |
| Events in quadrant D | 4,209,661 | 502,480 |
| Mode SS | |||
|---|---|---|---|
| Quadrant | BADHDUFLAG | Total packets | Discarded packets |
| A | 0 | 102 | 0 |
| B | 0 | 102 | 0 |
| C | 0 | 102 | 0 |
| D | 0 | 102 | 0 |
| Mode M9 | |||
|---|---|---|---|
| Quadrant | BADHDUFLAG | Total packets | Discarded packets |
| A | 0 | 22 | 0 |
| B | 0 | 22 | 0 |
| C | 0 | 22 | 0 |
| D | 0 | 23 | 0 |
| Mode M0 | |||
|---|---|---|---|
| Quadrant | BADHDUFLAG | Total packets | Discarded packets |
| A | 0 | 11555 | 3 |
| B | 0 | 12286 | 2 |
| C | 0 | 12983 | 2 |
| D | 0 | 15879 | 2 |
| Quadrant | Total seconds | Saturated seconds | Saturation percentage |
|---|---|---|---|
| A | 4988 | 50 | 1.002406% |
| B | 4988 | 135 | 2.706496% |
| C | 4988 | 152 | 3.047314% |
| D | 4988 | 97 | 1.944667% |
Noise dominated data is calculated using 1-second bins in cleaned event files. If a bin has >2000 counts, and if more than 50% of those come from <1% of pixels, then it is considered to be noise-dominated and hence unusable.
| Quadrant | # 1 sec bins | Bins with >0 counts | Bins with >2000 counts | High rate bins dominated by noise | Noise dominated (total time) | Noise dominated (detector-on time) | Marked lightcurve |
|---|---|---|---|---|---|---|---|
| A | 7110 | 4989 | 34 | 34 | 0.48% | 0.68% | 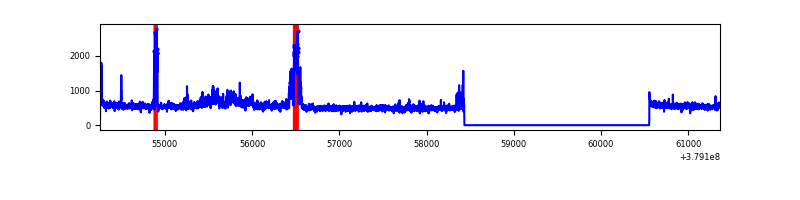 |
| B | 7110 | 4989 | 84 | 84 | 1.18% | 1.68% | 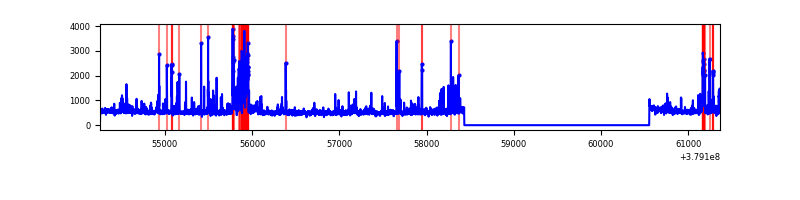 |
| C | 7110 | 4989 | 139 | 139 | 1.95% | 2.79% | 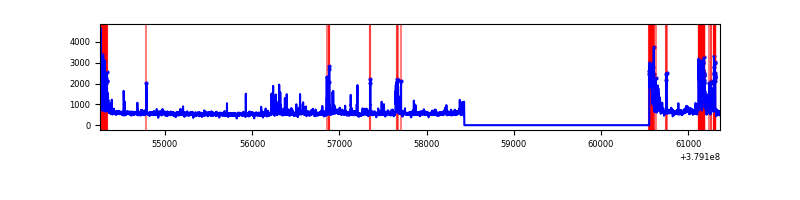 |
| D | 7110 | 4989 | 77 | 77 | 1.08% | 1.54% | 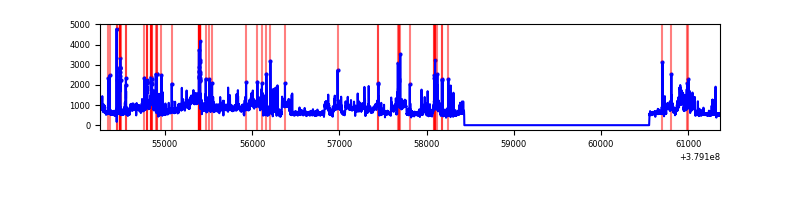 |
Top three noisy pixels from each quadrant. If the there are fewer than three noisy pixels in the level2.evt file, extra rows are filled as -1
| Pixel properties | Quadrant properties | ||||||
|---|---|---|---|---|---|---|---|
| Quadrant | DetID | PixID | Counts | Sigma | Mean | Median | Sigma |
| A | 15 | 169 | 372623 | 2878.87 | 650 | 638 | 129.2 |
| A | 10 | 83 | 12871 | 94.67 | 650 | 638 | 129.2 |
| A | 13 | 254 | 8996 | 64.68 | 650 | 638 | 129.2 |
| B | 5 | 172 | 424754 | 3653.07 | 627 | 614 | 116.1 |
| B | 0 | 190 | 49413 | 420.3 | 627 | 614 | 116.1 |
| B | 0 | 189 | 30529 | 257.65 | 627 | 614 | 116.1 |
| C | 9 | 187 | 314610 | 2265.64 | 608 | 612 | 138.6 |
| C | 0 | 10 | 238289 | 1714.95 | 608 | 612 | 138.6 |
| C | 15 | 214 | 218452 | 1571.81 | 608 | 612 | 138.6 |
| D | 8 | 195 | 978060 | 6427.82 | 627 | 612 | 152.1 |
| D | 10 | 118 | 241735 | 1585.66 | 627 | 612 | 152.1 |
| D | 2 | 250 | 214363 | 1405.65 | 627 | 612 | 152.1 |
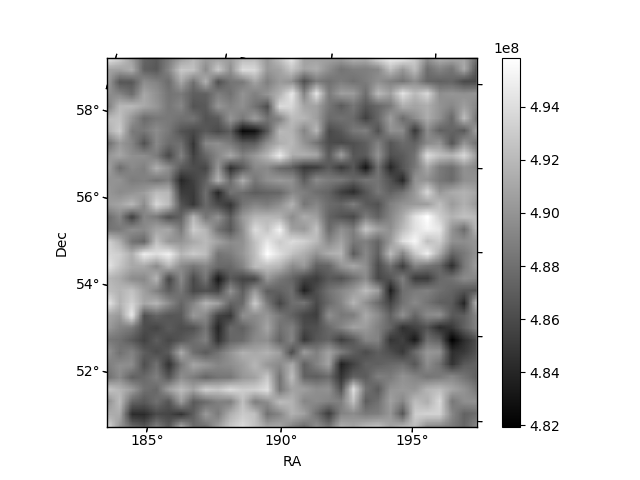
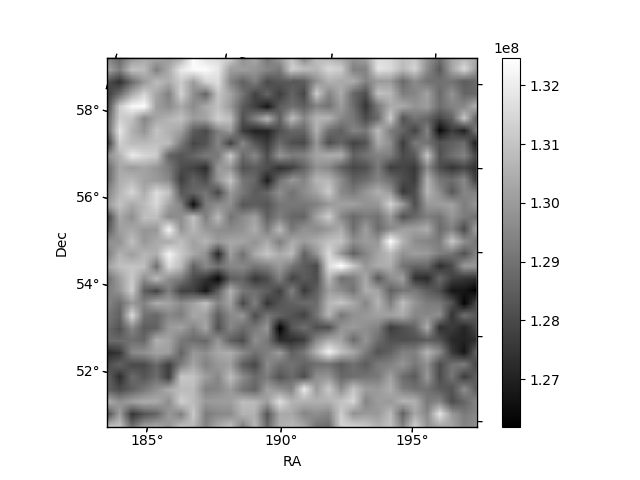
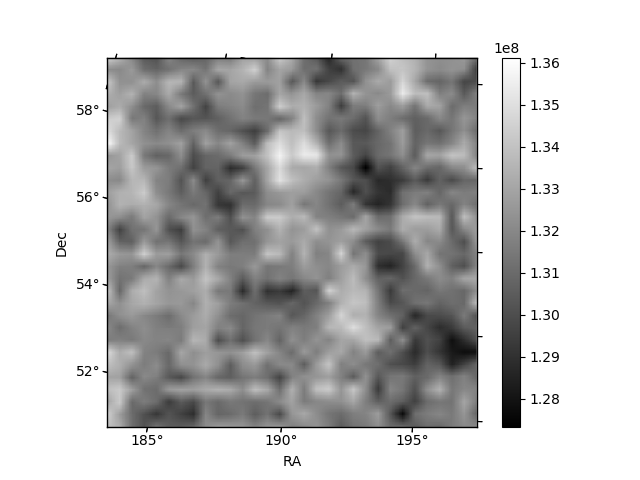
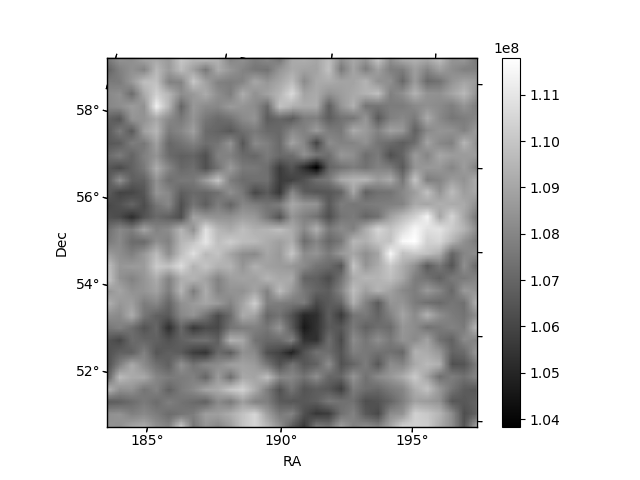
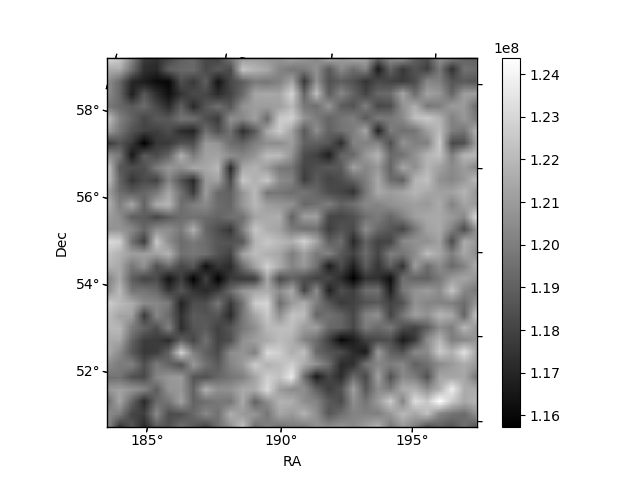
Histogram calculated using DETX and DETY for each event in the final _common_clean file
| Quadrant A | 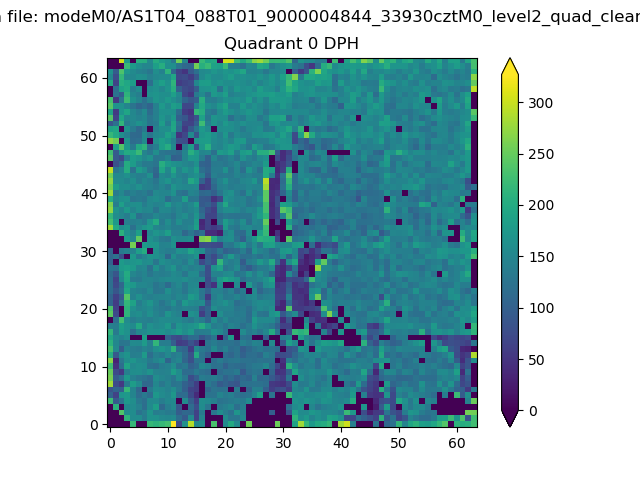 |
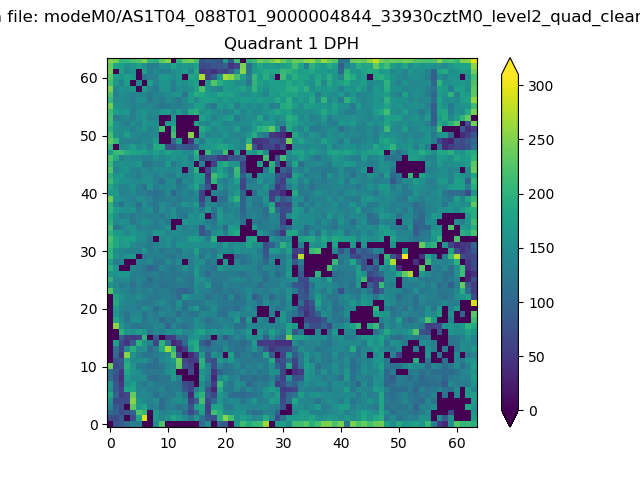 |
Quadrant B |
|---|---|---|---|
| Quadrant D | 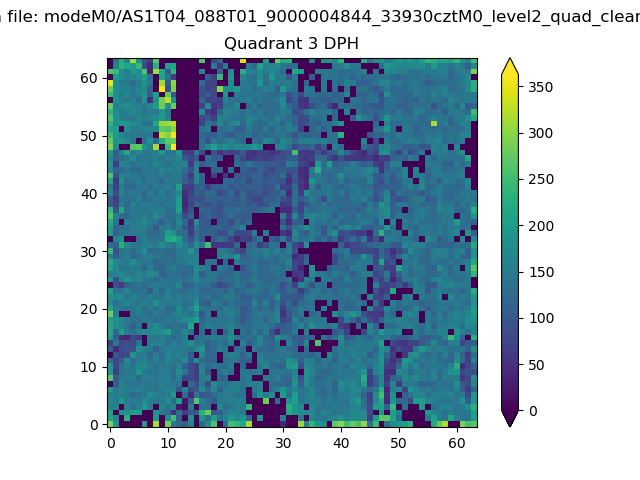 |
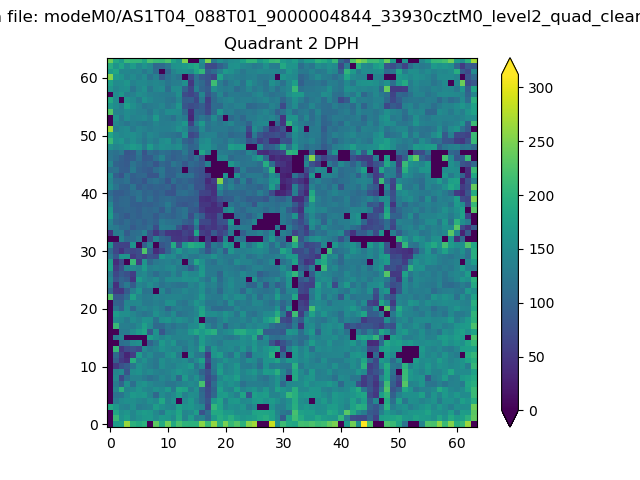 |
Quadrant C |
| Plot type | Count rate plots | Images |
|---|---|---|
| Comparison with Poisson distribution Blue bars denote a histogram of data divided into 1 sec bins. Red curve is a Poisson curve with rate = median count rate of data. |
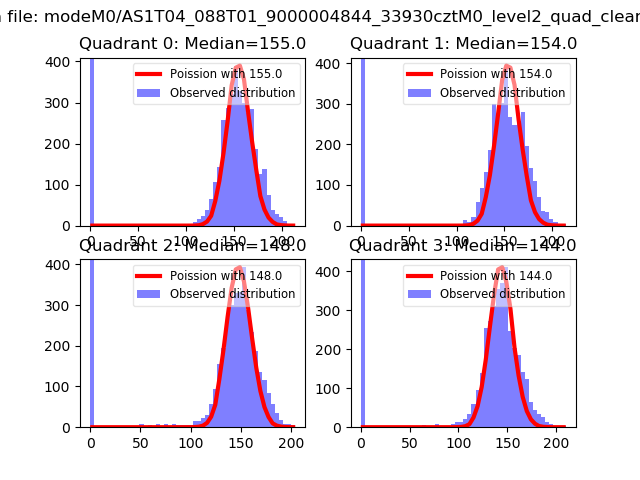 |
 |
| Quadrant-wise count rates Data is divided into 100 sec bins |
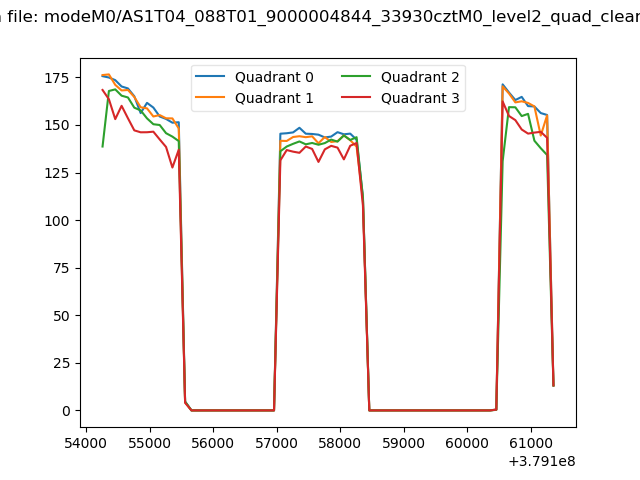 |
|
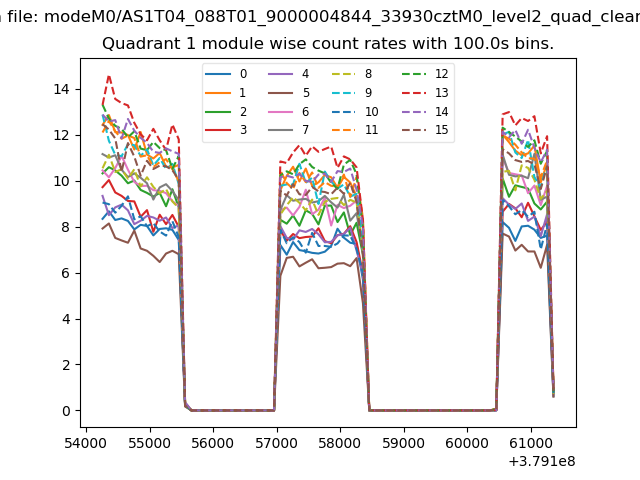
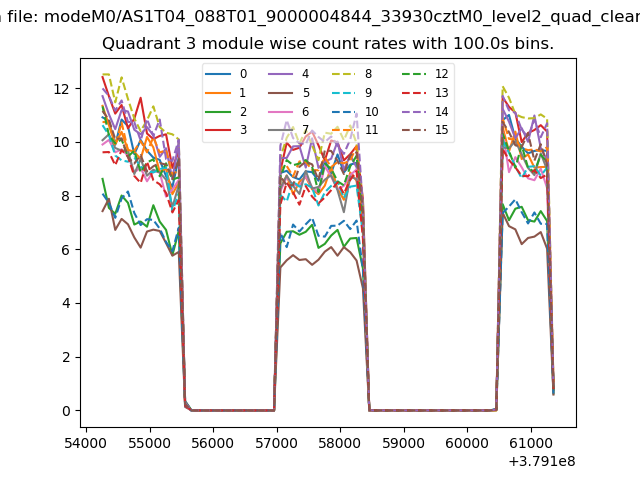
| Module-wise count rates for Quadrant A Data is divided into 100 sec bins |
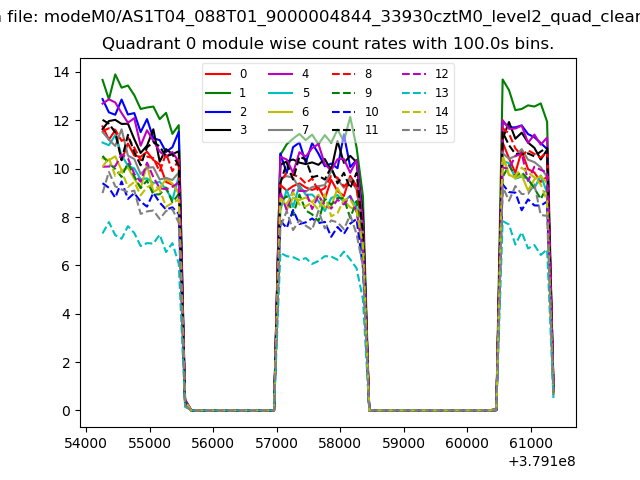 |
 |
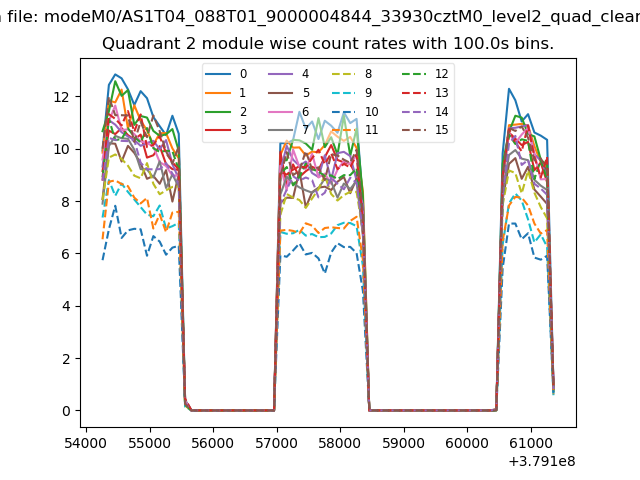
| Module-wise count rates for Quadrant B Data is divided into 100 sec bins |
 |
 |
| Module-wise count rates for Quadrant C Data is divided into 100 sec bins |
 |
 |
| Module-wise count rates for Quadrant D Data is divided into 100 sec bins |
 |
 |
| Parameter | Plot |
|---|---|
| CZT HV Monitor |  |
| D_VDD | 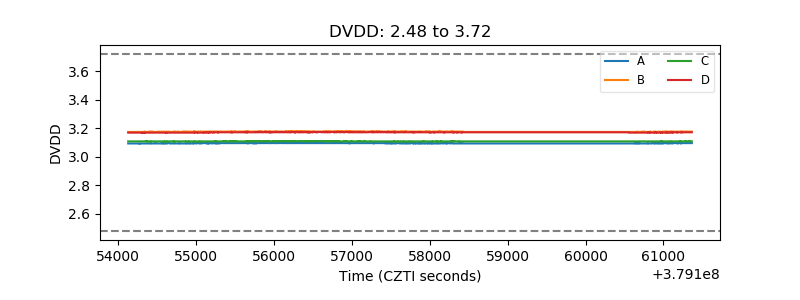 |
| Temperature 1 | 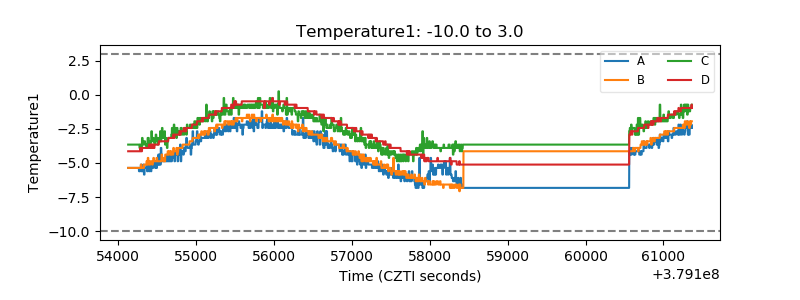 |
| Veto HV Monitor | 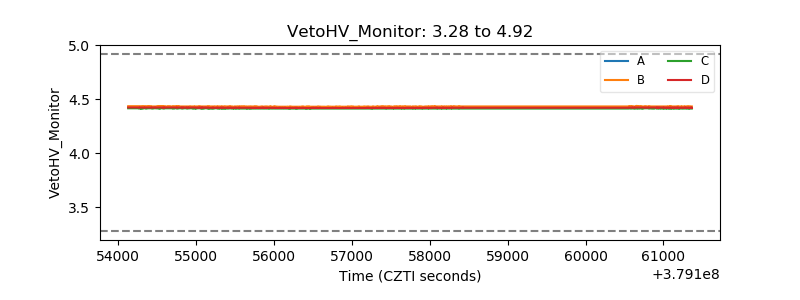 |
| Veto LLD | 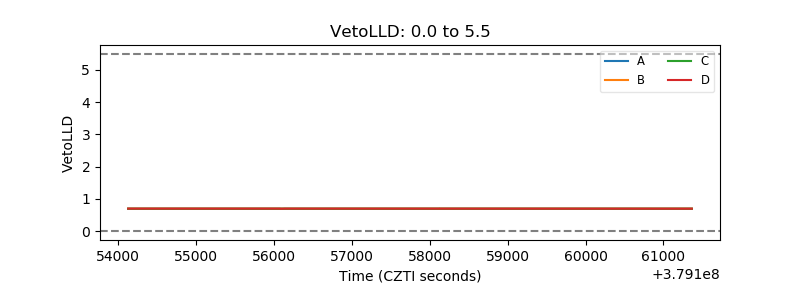 |
| Alpha Counter | 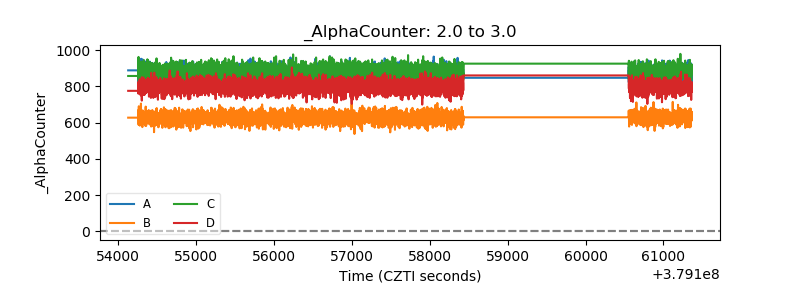 |
| _CPM_Rate | 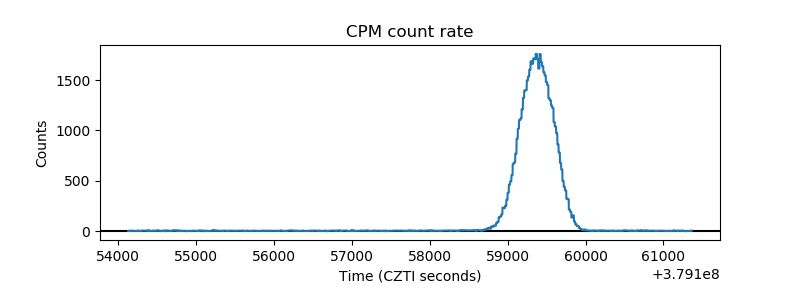 |
| CZT Counter | 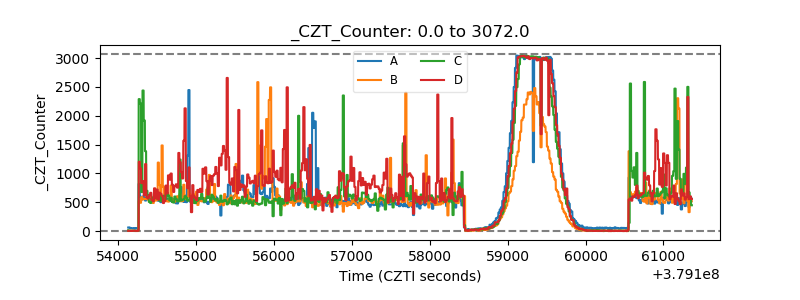 |
| +2.5 Volts monitor |  |
| +5 Volts monitor |  |
| _ROLL_ROT | 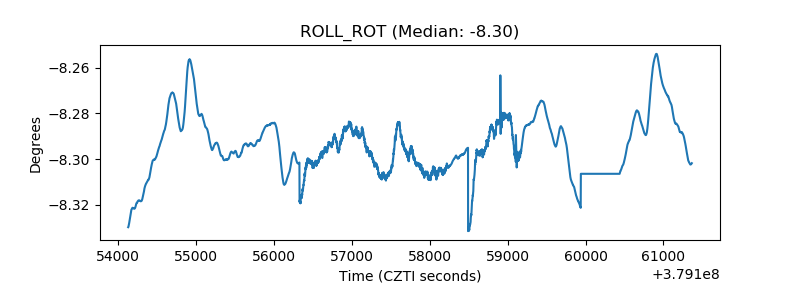 |
| _Roll_DEC | 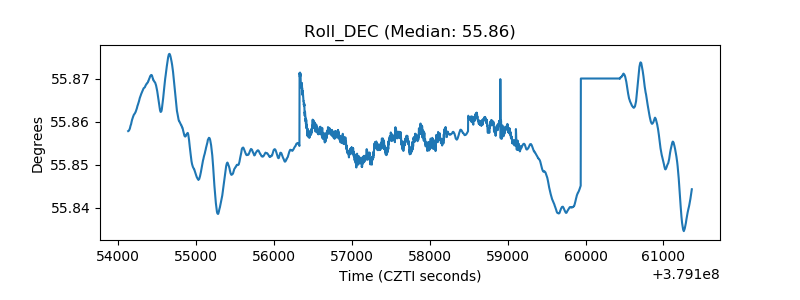 |
| _Roll_RA | 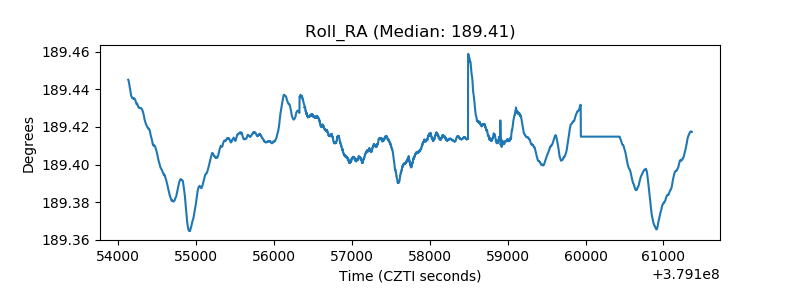 |
| Veto Counter | 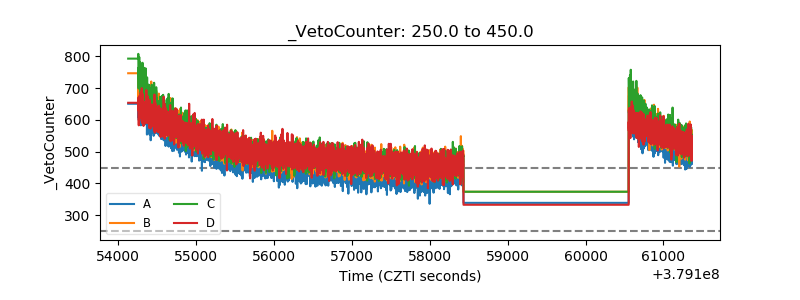 |