| Param | Original file | Final file |
|---|---|---|
| Filename | modeM0/AS1T04_088T01_9000004844_33931cztM0_level2.evt | modeM0/AS1T04_088T01_9000004844_33931cztM0_level2_quad_clean.evt |
| Size (bytes) | 451,342,080 | 68,155,200 |
| Size | 430.4 MB | 65.0 MB |
| Events in quadrant A | 2,459,603 | 453,808 |
| Events in quadrant B | 3,322,086 | 440,434 |
| Events in quadrant C | 3,641,236 | 416,789 |
| Events in quadrant D | 3,918,449 | 413,580 |
| Mode SS | |||
|---|---|---|---|
| Quadrant | BADHDUFLAG | Total packets | Discarded packets |
| A | 0 | 98 | 0 |
| B | 0 | 98 | 0 |
| C | 0 | 98 | 0 |
| D | 0 | 98 | 0 |
| Mode M9 | |||
|---|---|---|---|
| Quadrant | BADHDUFLAG | Total packets | Discarded packets |
| A | 0 | 22 | 0 |
| B | 0 | 22 | 0 |
| C | 0 | 22 | 0 |
| D | 0 | 23 | 0 |
| Mode M0 | |||
|---|---|---|---|
| Quadrant | BADHDUFLAG | Total packets | Discarded packets |
| A | 0 | 10099 | 2 |
| B | 0 | 12951 | 1 |
| C | 0 | 13883 | 1 |
| D | 0 | 14802 | 1 |
| Quadrant | Total seconds | Saturated seconds | Saturation percentage |
|---|---|---|---|
| A | 4831 | 7 | 0.144898% |
| B | 4831 | 172 | 3.560339% |
| C | 4831 | 319 | 6.603188% |
| D | 4831 | 167 | 3.456841% |
Noise dominated data is calculated using 1-second bins in cleaned event files. If a bin has >2000 counts, and if more than 50% of those come from <1% of pixels, then it is considered to be noise-dominated and hence unusable.
| Quadrant | # 1 sec bins | Bins with >0 counts | Bins with >2000 counts | High rate bins dominated by noise | Noise dominated (total time) | Noise dominated (detector-on time) | Marked lightcurve |
|---|---|---|---|---|---|---|---|
| A | 6984 | 4832 | 0 | 0 | 0.00% | 0.00% | 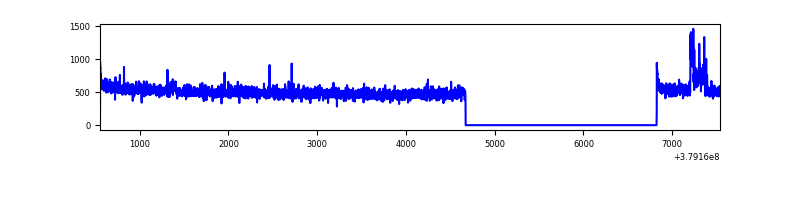 |
| B | 6984 | 4832 | 107 | 107 | 1.53% | 2.21% | 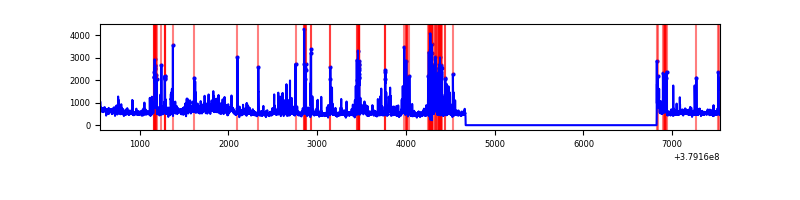 |
| C | 6984 | 4832 | 227 | 227 | 3.25% | 4.70% | 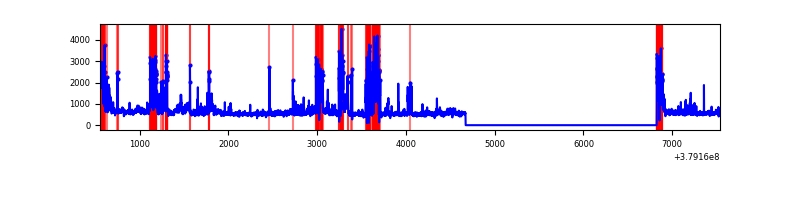 |
| D | 6984 | 4832 | 115 | 115 | 1.65% | 2.38% | 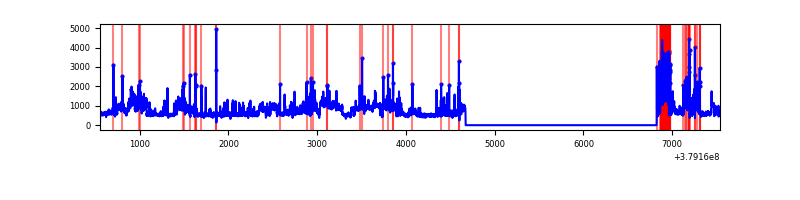 |
Top three noisy pixels from each quadrant. If the there are fewer than three noisy pixels in the level2.evt file, extra rows are filled as -1
| Pixel properties | Quadrant properties | ||||||
|---|---|---|---|---|---|---|---|
| Quadrant | DetID | PixID | Counts | Sigma | Mean | Median | Sigma |
| A | 15 | 169 | 64390 | 524.96 | 614 | 604 | 121.5 |
| A | 10 | 83 | 13328 | 104.72 | 614 | 604 | 121.5 |
| A | 13 | 6 | 11563 | 90.19 | 614 | 604 | 121.5 |
| B | 5 | 172 | 639412 | 5729.53 | 594 | 580 | 111.5 |
| B | 0 | 219 | 99161 | 884.15 | 594 | 580 | 111.5 |
| B | 3 | 112 | 66378 | 590.13 | 594 | 580 | 111.5 |
| C | 9 | 187 | 842225 | 6515.32 | 570 | 575 | 129.2 |
| C | 0 | 10 | 234192 | 1808.46 | 570 | 575 | 129.2 |
| C | 15 | 214 | 208235 | 1607.52 | 570 | 575 | 129.2 |
| D | 8 | 195 | 815563 | 5616.53 | 587 | 571 | 145.1 |
| D | 2 | 250 | 335738 | 2309.81 | 587 | 571 | 145.1 |
| D | 13 | 249 | 188646 | 1296.12 | 587 | 571 | 145.1 |
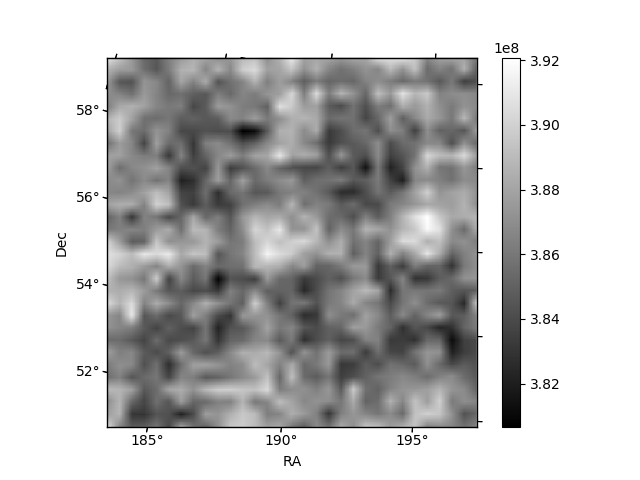
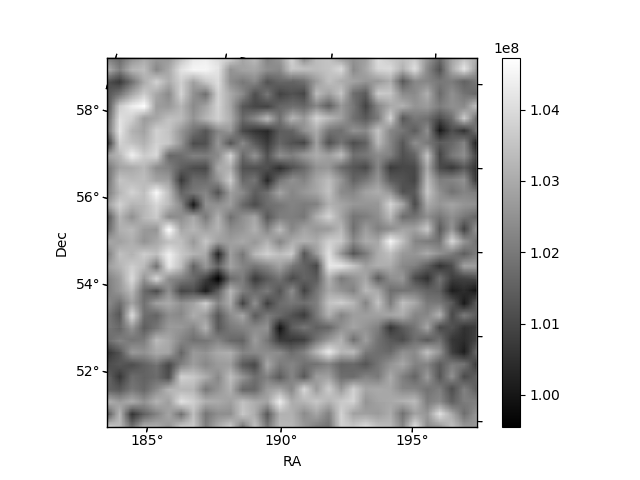
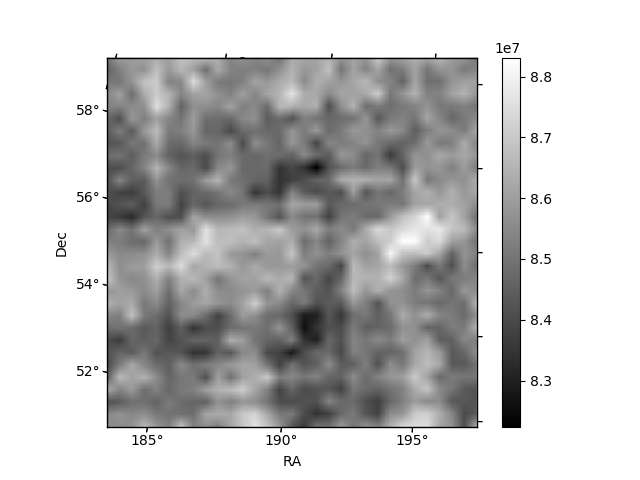
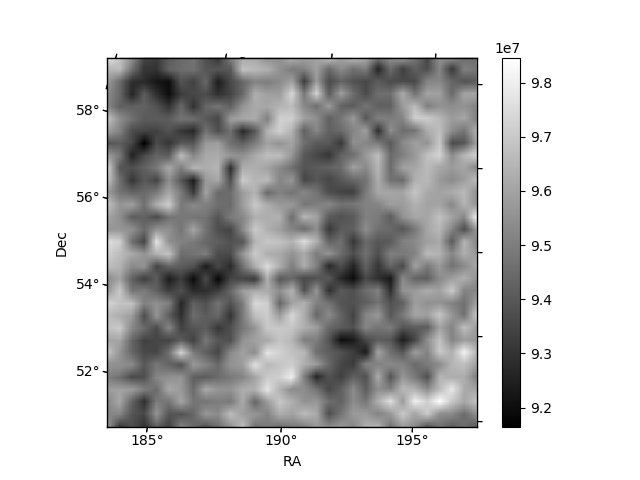
Histogram calculated using DETX and DETY for each event in the final _common_clean file
| Quadrant A | 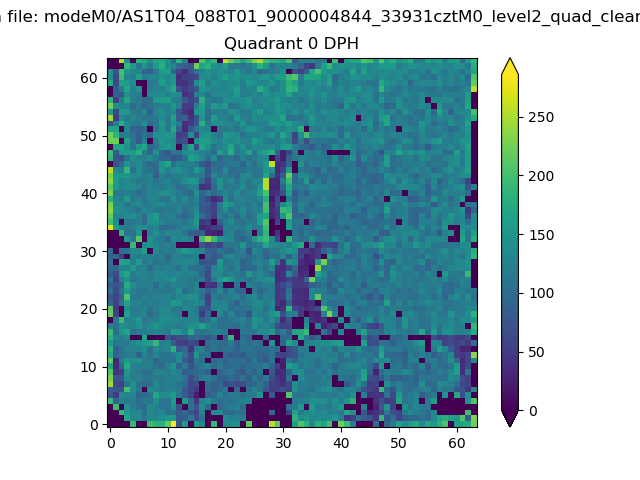 |
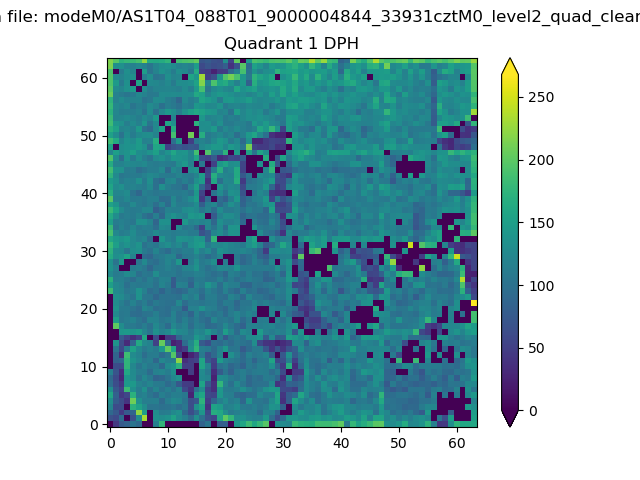 |
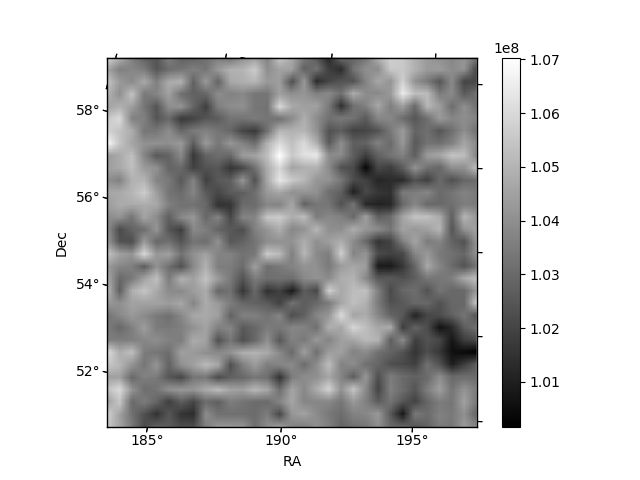
Quadrant B |
|---|---|---|---|
| Quadrant D | 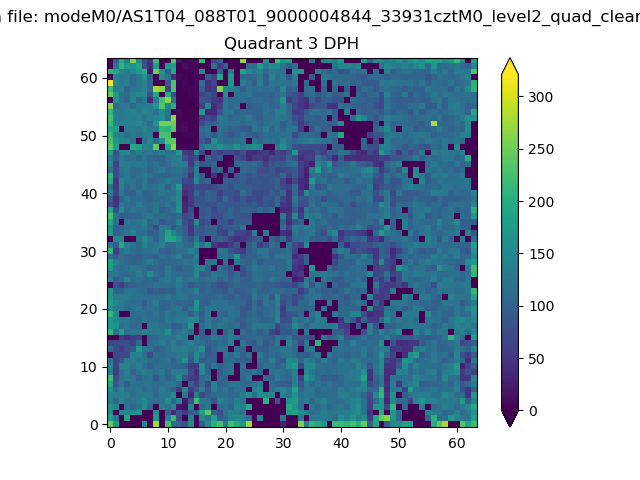 |
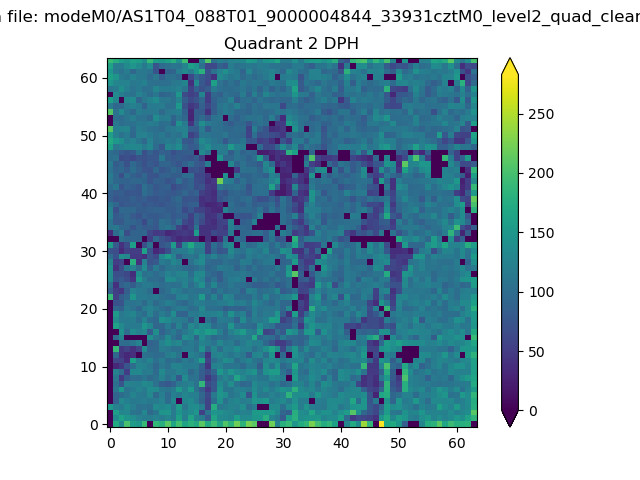 |
Quadrant C |
| Plot type | Count rate plots | Images |
|---|---|---|
| Comparison with Poisson distribution Blue bars denote a histogram of data divided into 1 sec bins. Red curve is a Poisson curve with rate = median count rate of data. |
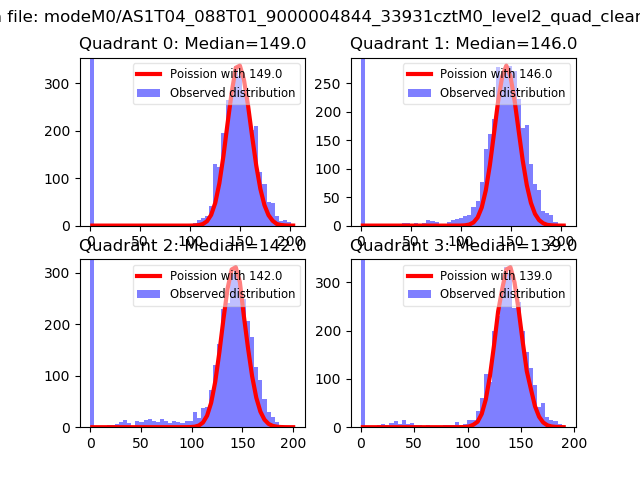 |
 |
| Quadrant-wise count rates Data is divided into 100 sec bins |
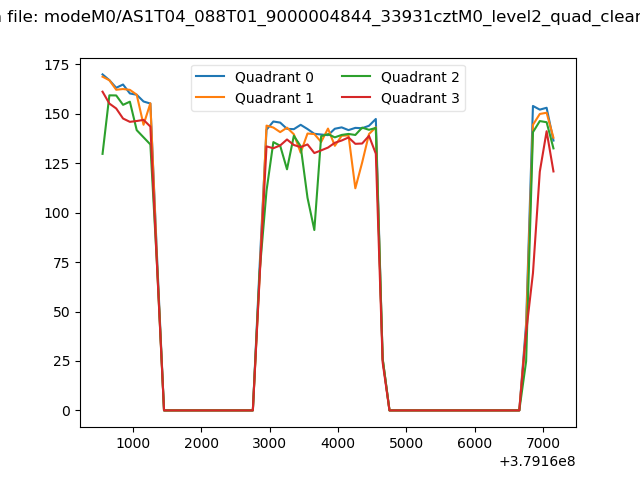 |
|
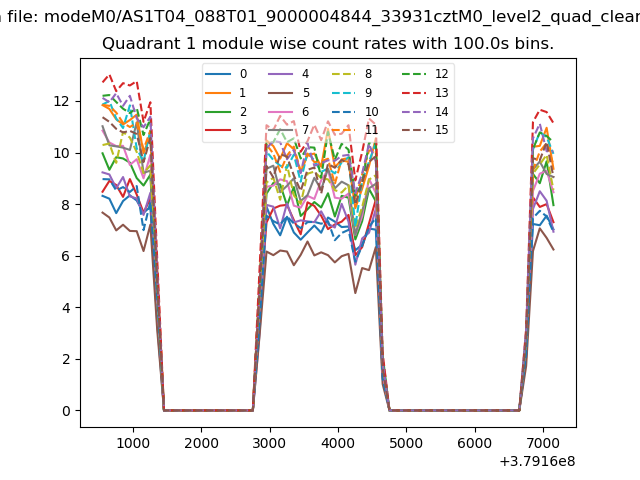
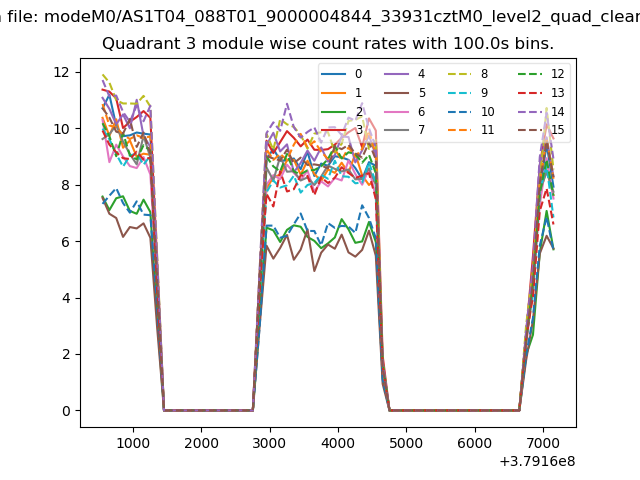
| Module-wise count rates for Quadrant A Data is divided into 100 sec bins |
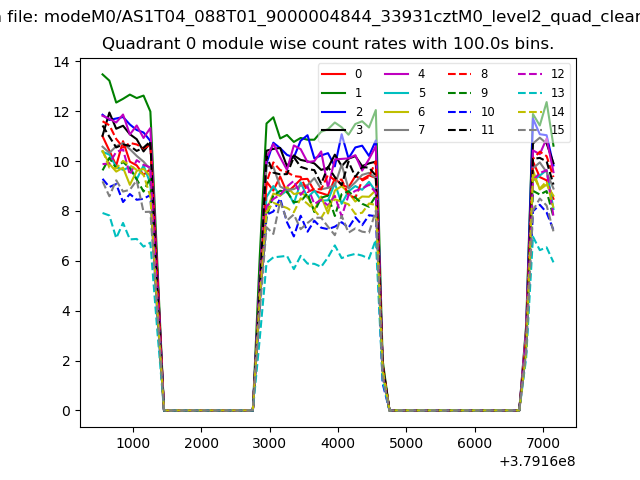 |
 |
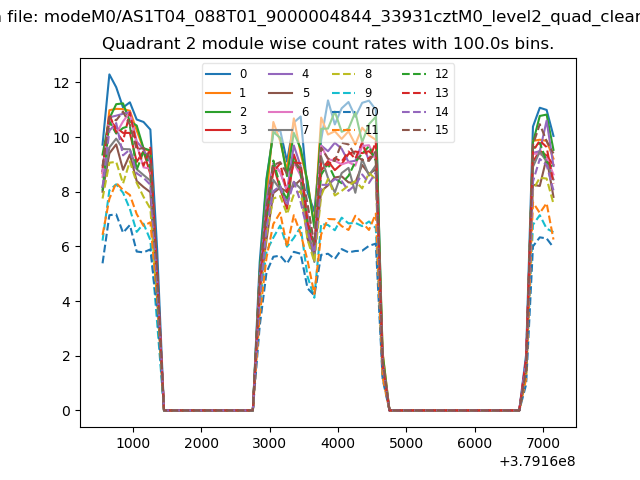
| Module-wise count rates for Quadrant B Data is divided into 100 sec bins |
 |
 |
| Module-wise count rates for Quadrant C Data is divided into 100 sec bins |
 |
 |
| Module-wise count rates for Quadrant D Data is divided into 100 sec bins |
 |
 |
| Parameter | Plot |
|---|---|
| CZT HV Monitor |  |
| D_VDD |  |
| Temperature 1 | 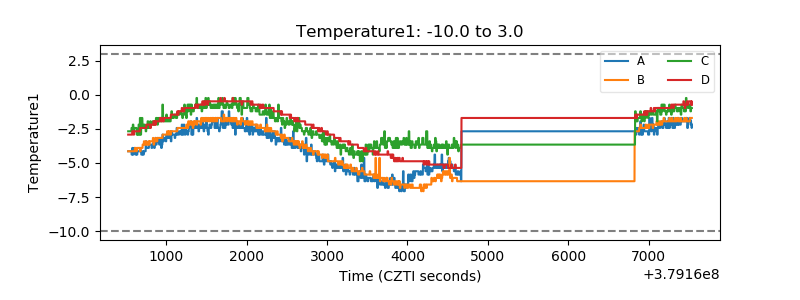 |
| Veto HV Monitor | 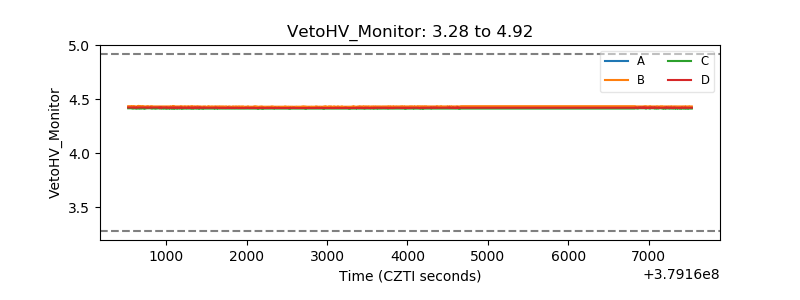 |
| Veto LLD |  |
| Alpha Counter | 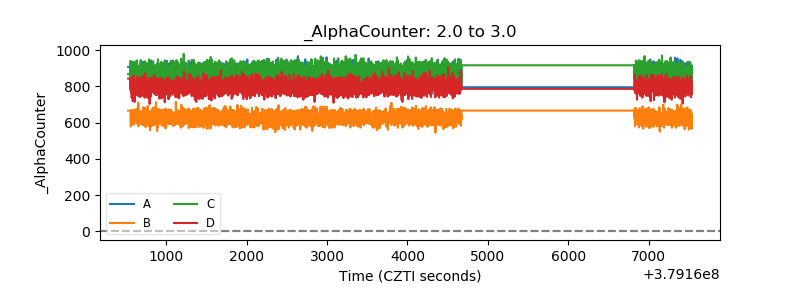 |
| _CPM_Rate | 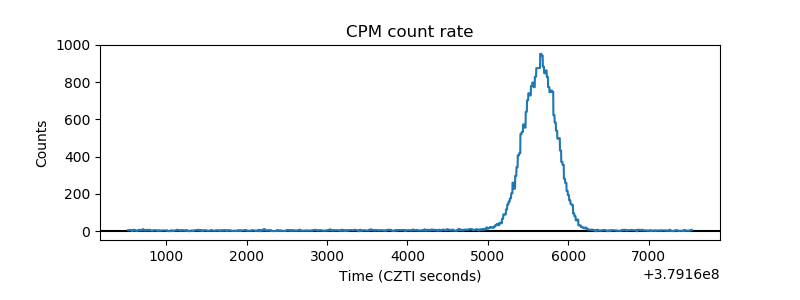 |
| CZT Counter | 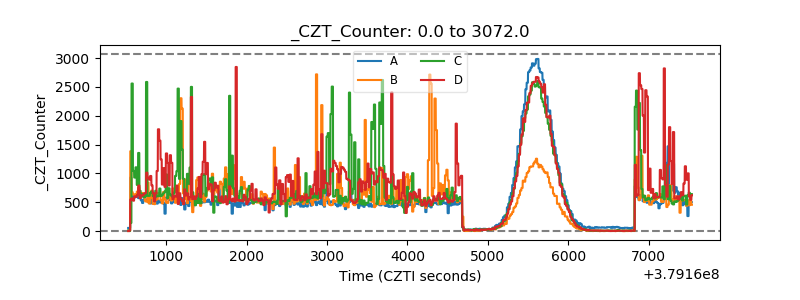 |
| +2.5 Volts monitor |  |
| +5 Volts monitor | 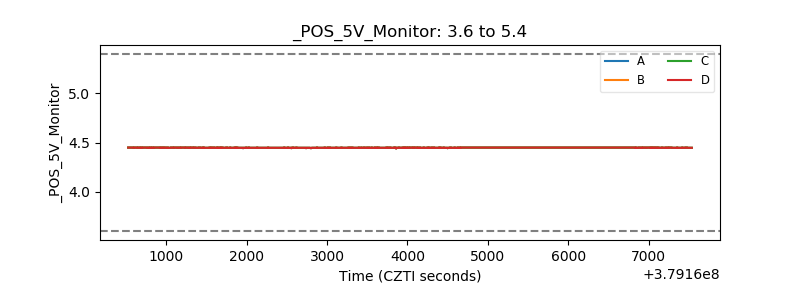 |
| _ROLL_ROT |  |
| _Roll_DEC | 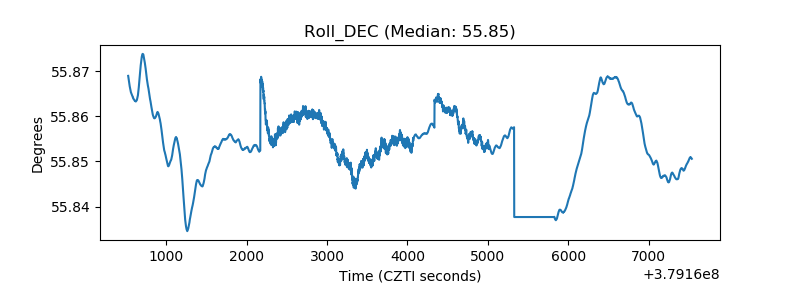 |
| _Roll_RA | 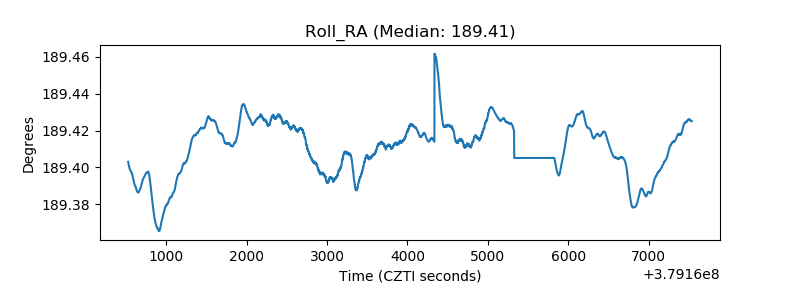 |
| Veto Counter | 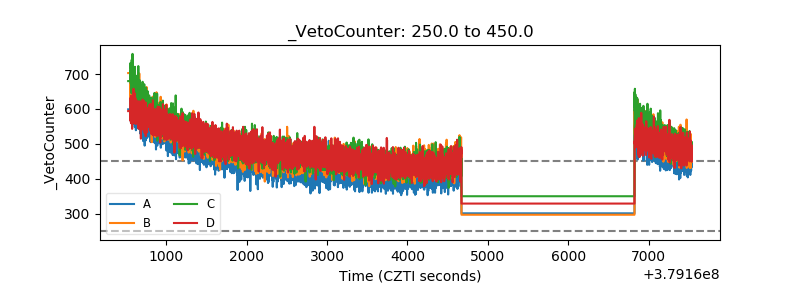 |