| Param | Original file | Final file |
|---|---|---|
| Filename | modeM0/AS1T04_088T01_9000004844_33933cztM0_level2.evt | modeM0/AS1T04_088T01_9000004844_33933cztM0_level2_quad_clean.evt |
| Size (bytes) | 269,475,840 | 20,949,120 |
| Size | 257.0 MB | 20.0 MB |
| Events in quadrant A | 2,392,713 | 50,377 |
| Events in quadrant B | 1,796,917 | 136,747 |
| Events in quadrant C | 1,475,163 | 133,895 |
| Events in quadrant D | 2,320,218 | 128,048 |
| Mode SS | |||
|---|---|---|---|
| Quadrant | BADHDUFLAG | Total packets | Discarded packets |
| A | 0 | 52 | 0 |
| B | 0 | 52 | 0 |
| C | 0 | 52 | 0 |
| D | 0 | 52 | 0 |
| Mode M0 | |||
|---|---|---|---|
| Quadrant | BADHDUFLAG | Total packets | Discarded packets |
| A | 0 | 8780 | 1 |
| B | 0 | 7008 | 1 |
| C | 0 | 5808 | 1 |
| D | 0 | 8696 | 1 |
| Quadrant | Total seconds | Saturated seconds | Saturation percentage |
|---|---|---|---|
| A | 2565 | 953 | 37.153996% |
| B | 2565 | 182 | 7.095517% |
| C | 2565 | 49 | 1.910331% |
| D | 2565 | 56 | 2.183236% |
Noise dominated data is calculated using 1-second bins in cleaned event files. If a bin has >2000 counts, and if more than 50% of those come from <1% of pixels, then it is considered to be noise-dominated and hence unusable.
| Quadrant | # 1 sec bins | Bins with >0 counts | Bins with >2000 counts | High rate bins dominated by noise | Noise dominated (total time) | Noise dominated (detector-on time) | Marked lightcurve |
|---|---|---|---|---|---|---|---|
| A | 2565 | 2565 | 236 | 236 | 9.20% | 9.20% |  |
| B | 2565 | 2565 | 126 | 126 | 4.91% | 4.91% | 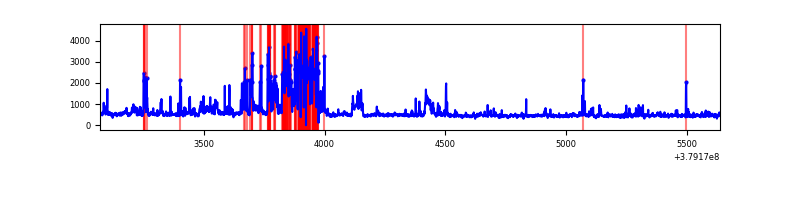 |
| C | 2565 | 2565 | 36 | 36 | 1.40% | 1.40% | 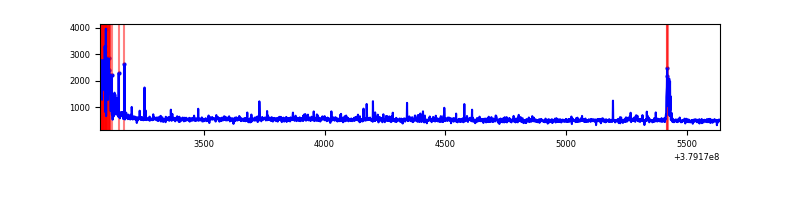 |
| D | 2565 | 2565 | 41 | 41 | 1.60% | 1.60% | 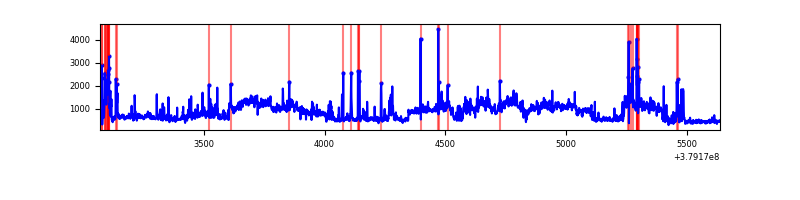 |
Top three noisy pixels from each quadrant. If the there are fewer than three noisy pixels in the level2.evt file, extra rows are filled as -1
| Pixel properties | Quadrant properties | ||||||
|---|---|---|---|---|---|---|---|
| Quadrant | DetID | PixID | Counts | Sigma | Mean | Median | Sigma |
| A | 15 | 169 | 1536900 | 34350.94 | 218 | 214 | 44.7 |
| A | 10 | 83 | 5466 | 117.4 | 218 | 214 | 44.7 |
| A | 0 | 127 | 4573 | 97.44 | 218 | 214 | 44.7 |
| B | 5 | 172 | 544985 | 9719.14 | 289 | 283 | 56.0 |
| B | 0 | 190 | 43573 | 772.43 | 289 | 283 | 56.0 |
| B | 15 | 35 | 14148 | 247.39 | 289 | 283 | 56.0 |
| C | 0 | 10 | 127336 | 1851.88 | 293 | 294 | 68.6 |
| C | 15 | 214 | 111338 | 1618.68 | 293 | 294 | 68.6 |
| C | 3 | 233 | 36891 | 533.47 | 293 | 294 | 68.6 |
| D | 8 | 195 | 851343 | 10490.98 | 294 | 287 | 81.1 |
| D | 2 | 250 | 100595 | 1236.5 | 294 | 287 | 81.1 |
| D | 7 | 223 | 76823 | 943.46 | 294 | 287 | 81.1 |
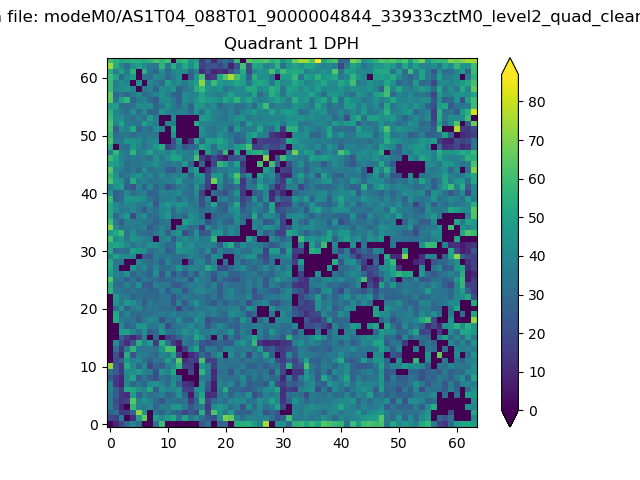
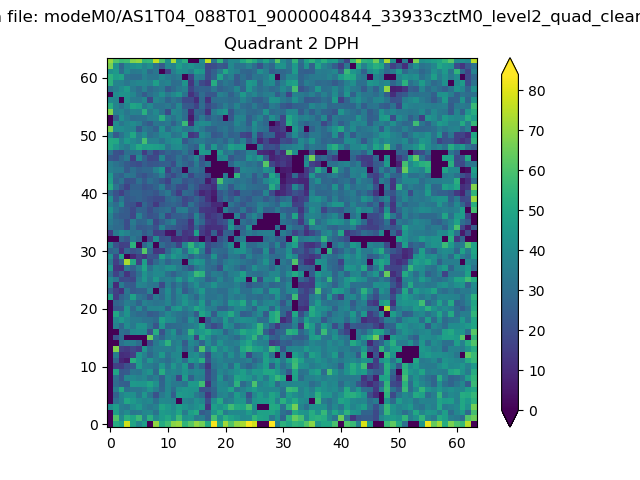
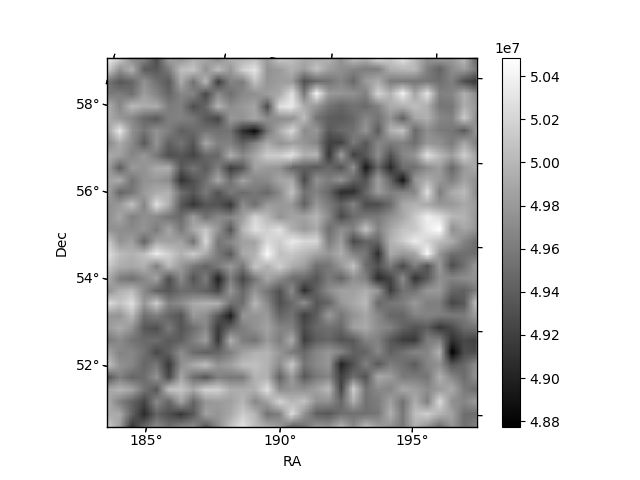
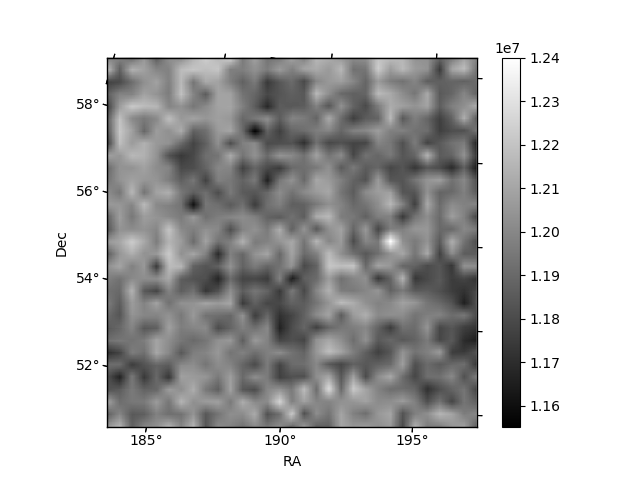
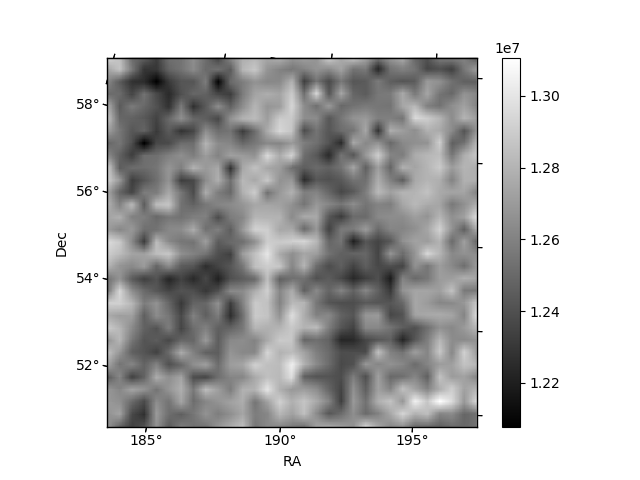
Histogram calculated using DETX and DETY for each event in the final _common_clean file
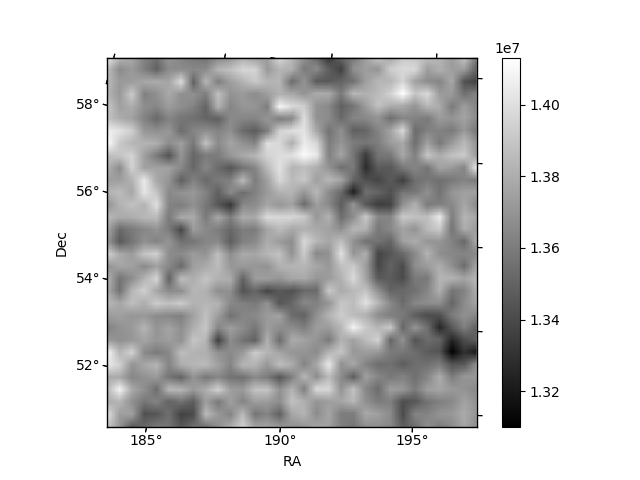
| Quadrant A | 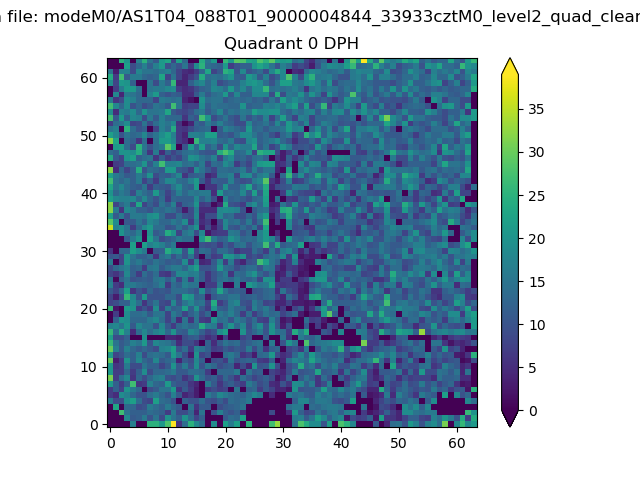 |
 |
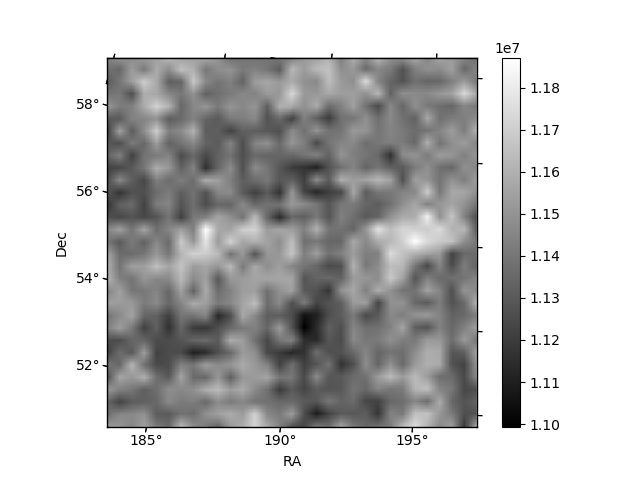
Quadrant B |
|---|---|---|---|
| Quadrant D | 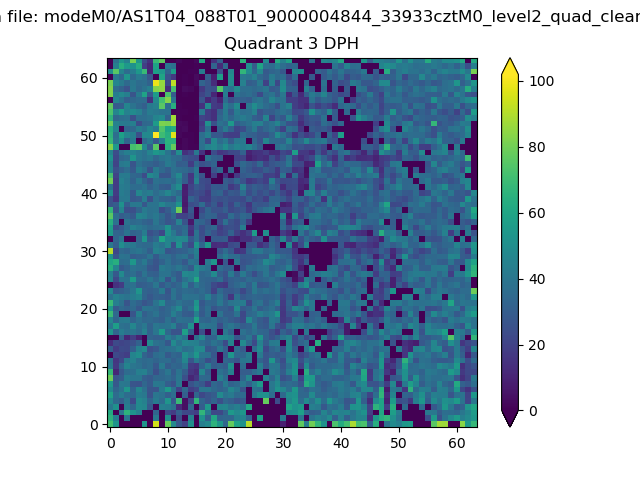 |
 |
Quadrant C |
| Plot type | Count rate plots | Images |
|---|---|---|
| Comparison with Poisson distribution Blue bars denote a histogram of data divided into 1 sec bins. Red curve is a Poisson curve with rate = median count rate of data. |
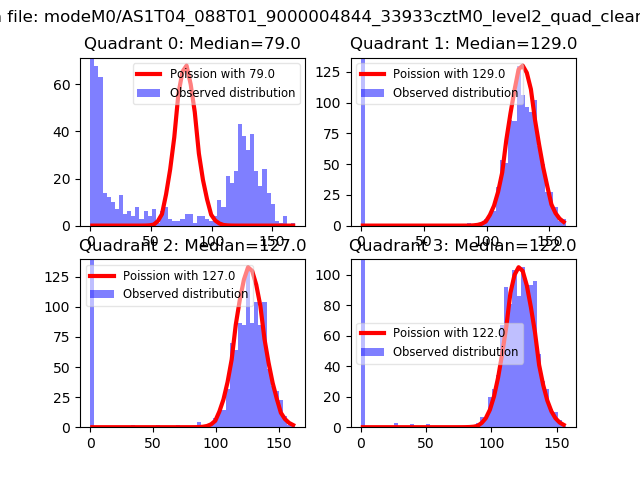 |
 |
| Quadrant-wise count rates Data is divided into 100 sec bins |
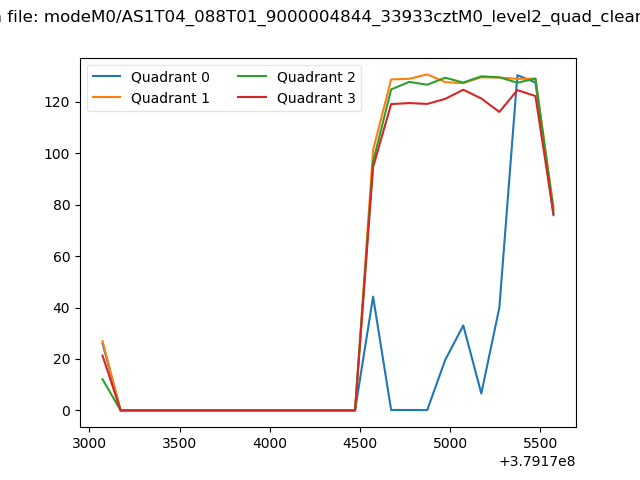 |
|
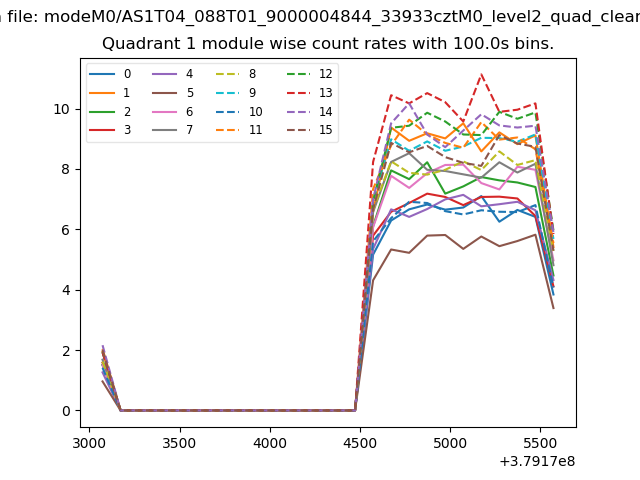
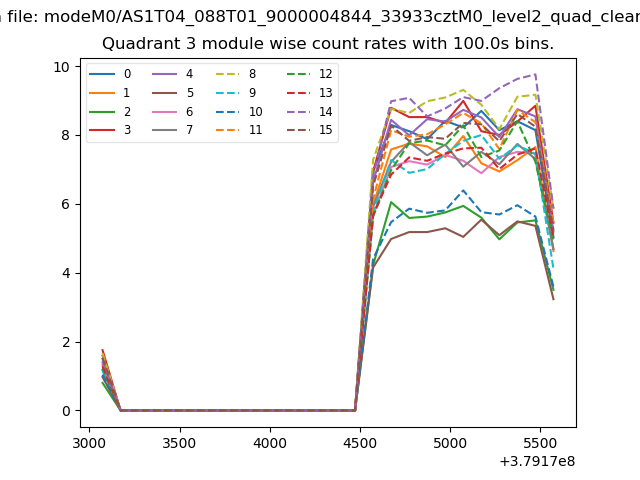
| Module-wise count rates for Quadrant A Data is divided into 100 sec bins |
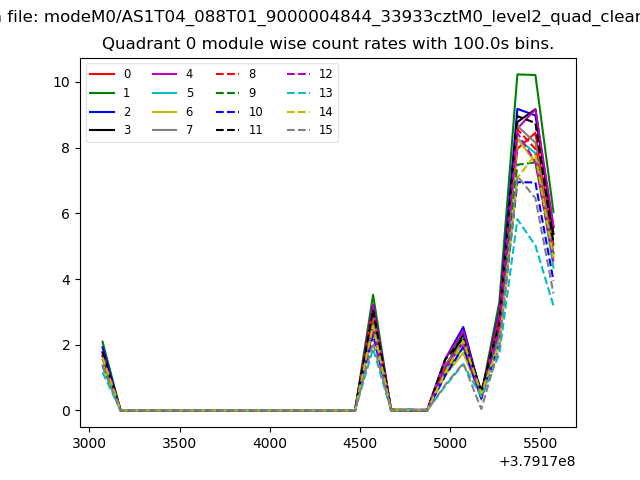 |
 |
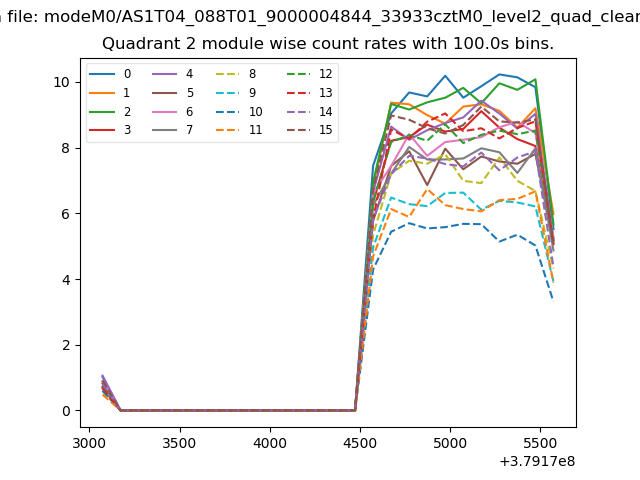
| Module-wise count rates for Quadrant B Data is divided into 100 sec bins |
 |
 |
| Module-wise count rates for Quadrant C Data is divided into 100 sec bins |
 |
 |
| Module-wise count rates for Quadrant D Data is divided into 100 sec bins |
 |
 |
| Parameter | Plot |
|---|---|
| CZT HV Monitor |  |
| D_VDD | 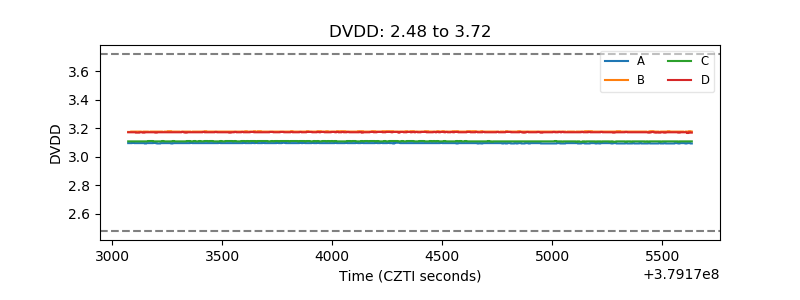 |
| Temperature 1 | 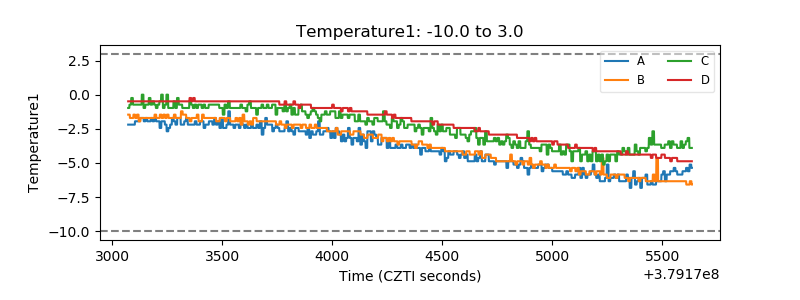 |
| Veto HV Monitor | 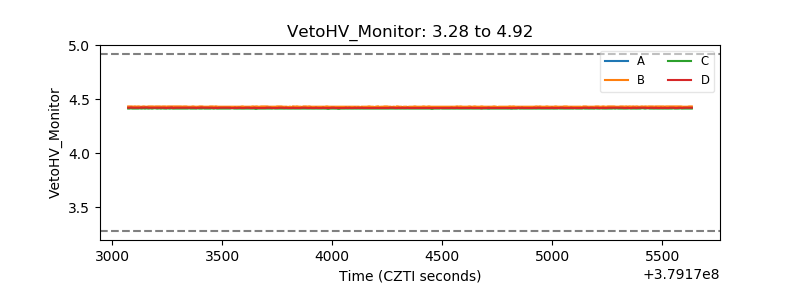 |
| Veto LLD | 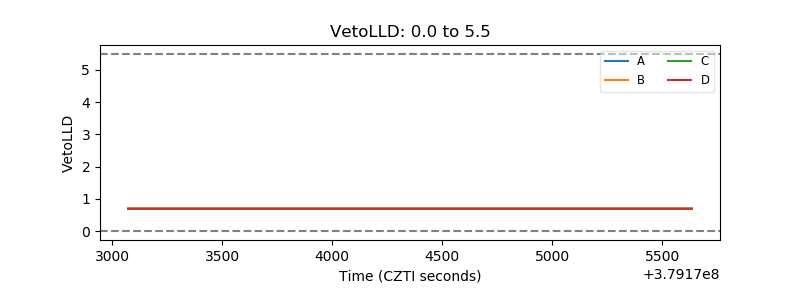 |
| Alpha Counter | 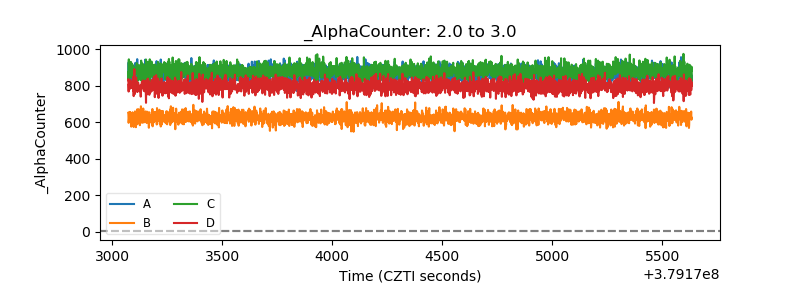 |
| _CPM_Rate | 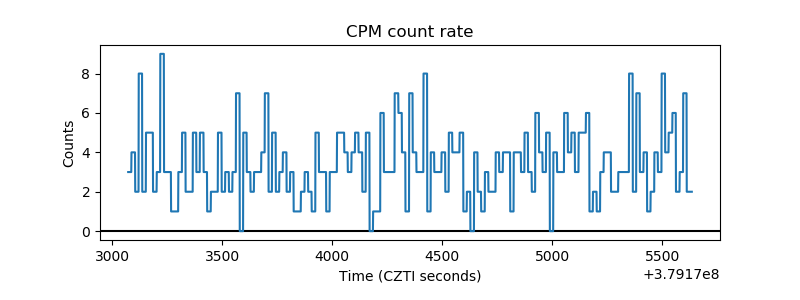 |
| CZT Counter | 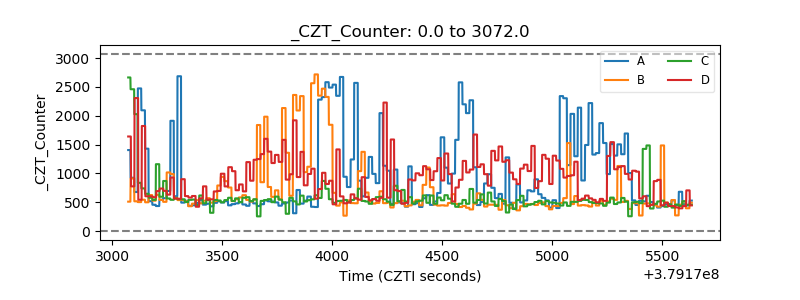 |
| +2.5 Volts monitor |  |
| +5 Volts monitor |  |
| _ROLL_ROT | 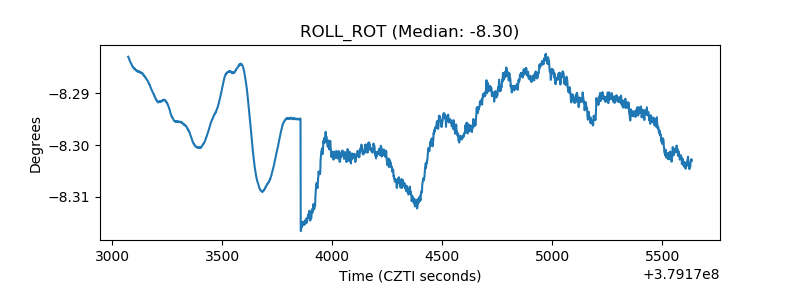 |
| _Roll_DEC | 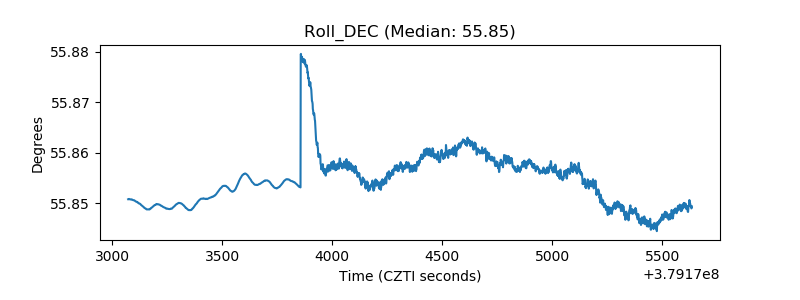 |
| _Roll_RA | 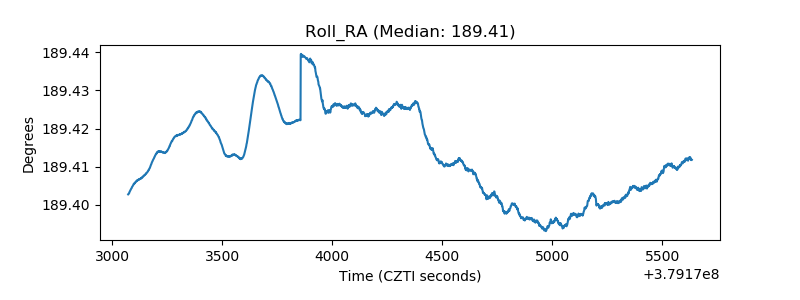 |
| Veto Counter | 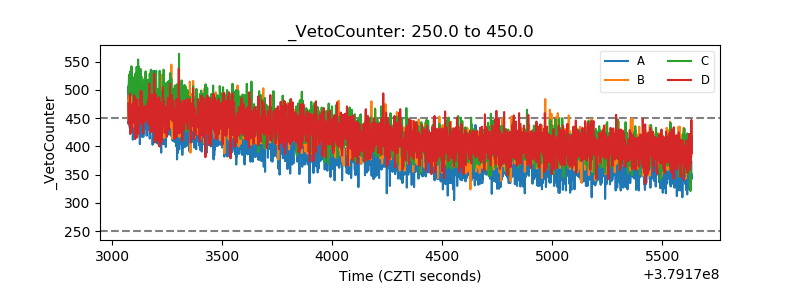 |