| Param | Original file | Final file |
|---|---|---|
| Filename | modeM0/AS1A11_046T03_9000004848cztM0_level2.fits | modeM0/AS1A11_046T03_9000004848cztM0_level2_quad_clean.evt |
| Size (bytes) | 417,291,840 | 363,225,600 |
| Size | 398.0 MB | 346.4 MB |
| Events in quadrant A | 2,563,472 | 2,033,551 |
| Events in quadrant B | 2,431,554 | 2,114,457 |
| Events in quadrant C | 2,511,930 | 2,035,530 |
| Events in quadrant D | 2,119,662 | 1,806,134 |
| Mode SS | |||
|---|---|---|---|
| Quadrant | BADHDUFLAG | Total packets | Discarded packets |
| A | 0 | 890 | 0 |
| B | 0 | 902 | 0 |
| C | 0 | 906 | 0 |
| D | 0 | 900 | 0 |
| Mode M9 | |||
|---|---|---|---|
| Quadrant | BADHDUFLAG | Total packets | Discarded packets |
| A | 0 | 165 | 0 |
| B | 0 | 166 | 0 |
| C | 0 | 166 | 0 |
| D | 0 | 166 | 0 |
| Mode M0 | |||
|---|---|---|---|
| Quadrant | BADHDUFLAG | Total packets | Discarded packets |
| A | 0 | 103552 | 0 |
| B | 0 | 103504 | 0 |
| C | 0 | 100401 | 0 |
| D | 0 | 131170 | 0 |
| Quadrant | Total seconds | Saturated seconds | Saturation percentage |
|---|---|---|---|
| A | 43698 | 1253 | 2.867408% |
| B | 43949 | 1191 | 2.709959% |
| C | 43965 | 374 | 0.850677% |
| D | 43710 | 2107 | 4.820407% |
Noise dominated data is calculated using 1-second bins in cleaned event files. If a bin has >2000 counts, and if more than 50% of those come from <1% of pixels, then it is considered to be noise-dominated and hence unusable.
| Quadrant | # 1 sec bins | Bins with >0 counts | Bins with >2000 counts | High rate bins dominated by noise | Noise dominated (total time) | Noise dominated (detector-on time) | Marked lightcurve |
|---|---|---|---|---|---|---|---|
| A | 57144 | 43394 | 0 | 0 | 0.00% | 0.00% | 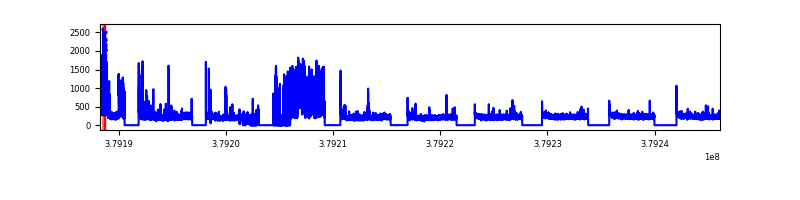 |
| B | 57144 | 43616 | 0 | 0 | 0.00% | 0.00% |  |
| C | 57144 | 43656 | 0 | 0 | 0.00% | 0.00% |  |
| D | 57144 | 43401 | 0 | 0 | 0.00% | 0.00% |  |
Top three noisy pixels from each quadrant. If the there are fewer than three noisy pixels in the level2.evt file, extra rows are filled as -1
| Pixel properties | Quadrant properties | ||||||
|---|---|---|---|---|---|---|---|
| Quadrant | DetID | PixID | Counts | Sigma | Mean | Median | Sigma |
| A | 7 | 110 | 2061 | 8.69 | 669 | 629 | 164.7 |
| A | 9 | 19 | 2043 | 8.58 | 669 | 629 | 164.7 |
| A | 0 | 29 | 2038 | 8.55 | 669 | 629 | 164.7 |
| B | 2 | 9 | 2160 | 12.09 | 645 | 615 | 127.8 |
| B | 3 | 80 | 1845 | 9.62 | 645 | 615 | 127.8 |
| B | 2 | 8 | 1722 | 8.66 | 645 | 615 | 127.8 |
| C | 1 | 81 | 2145 | 8.93 | 664 | 624 | 170.3 |
| C | 1 | 80 | 2019 | 8.19 | 664 | 624 | 170.3 |
| C | 1 | 65 | 1730 | 6.49 | 664 | 624 | 170.3 |
| D | 10 | 189 | 1580 | 6.24 | 608 | 555 | 164.3 |
| D | 10 | 113 | 1554 | 6.08 | 608 | 555 | 164.3 |
| D | 4 | 160 | 1534 | 5.96 | 608 | 555 | 164.3 |
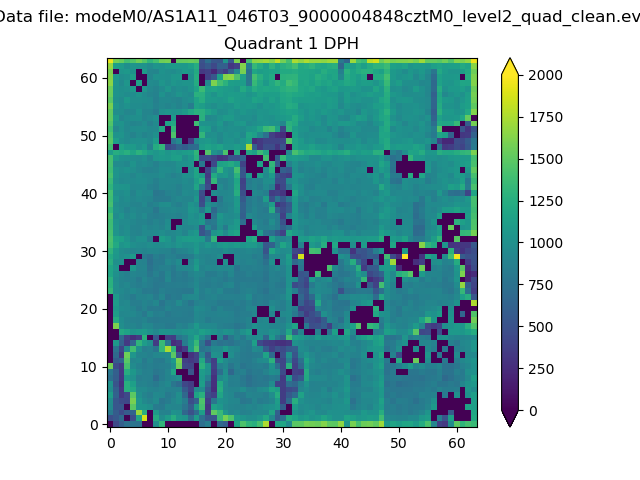
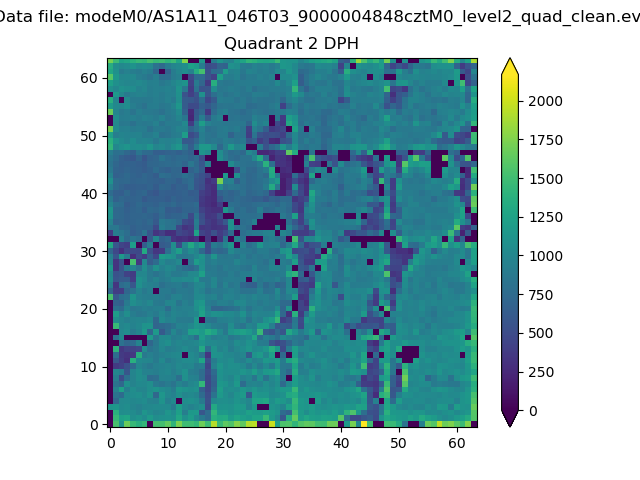
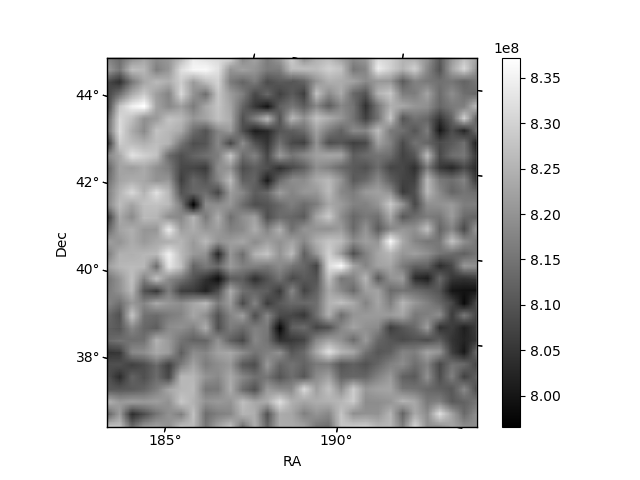
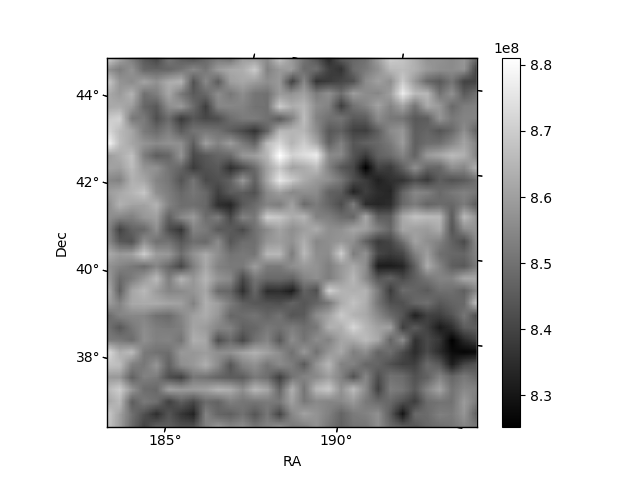
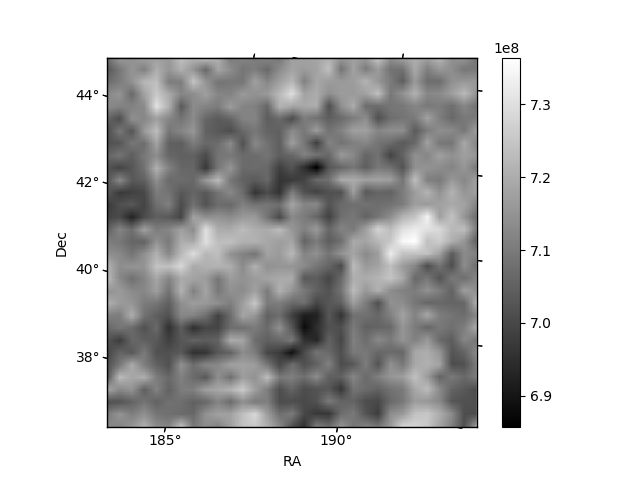
Histogram calculated using DETX and DETY for each event in the final _common_clean file
| Quadrant A |  |
 |
Quadrant B |
|---|---|---|---|
| Quadrant D |  |
 |
Quadrant C |
| Plot type | Count rate plots | Images |
|---|---|---|
| Comparison with Poisson distribution Blue bars denote a histogram of data divided into 1 sec bins. Red curve is a Poisson curve with rate = median count rate of data. |
 |
 |
| Quadrant-wise count rates Data is divided into 100 sec bins |
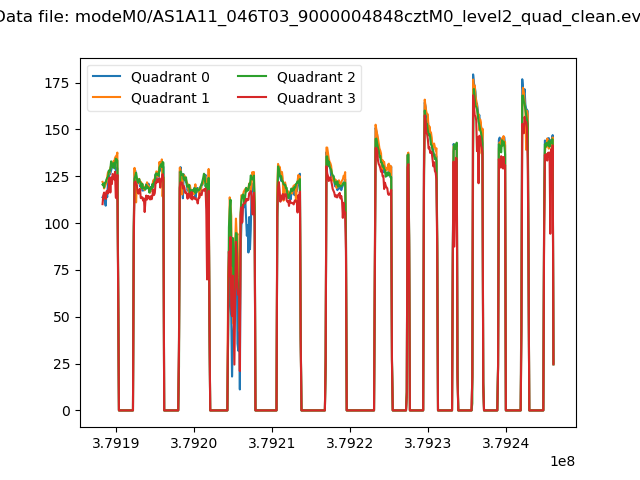 |
|
| Module-wise count rates for Quadrant A Data is divided into 100 sec bins |
 |
 |
| Module-wise count rates for Quadrant B Data is divided into 100 sec bins |
 |
 |
| Module-wise count rates for Quadrant C Data is divided into 100 sec bins |
 |
 |
| Module-wise count rates for Quadrant D Data is divided into 100 sec bins |
 |
 |
| Parameter | Plot |
|---|---|
| CZT HV Monitor |  |
| D_VDD | 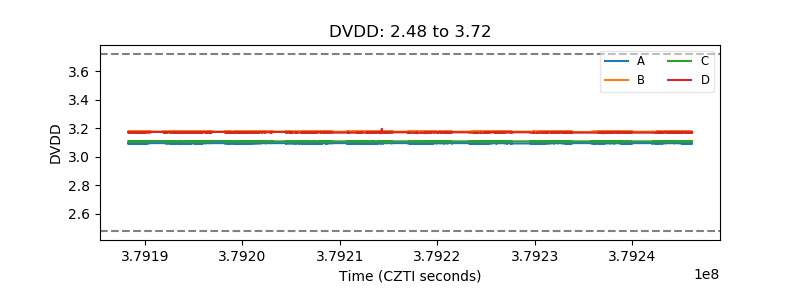 |
| Temperature 1 |  |
| Veto HV Monitor |  |
| Veto LLD |  |
| Alpha Counter |  |
| _CPM_Rate |  |
| CZT Counter |  |
| +2.5 Volts monitor |  |
| +5 Volts monitor |  |
| _ROLL_ROT |  |
| _Roll_DEC |  |
| _Roll_RA |  |
| Veto Counter |  |