| Param | Original file | Final file |
|---|---|---|
| Filename | modeM0/AS1A11_046T03_9000004848_33935cztM0_level2.evt | modeM0/AS1A11_046T03_9000004848_33935cztM0_level2_quad_clean.evt |
| Size (bytes) | 299,496,960 | 48,225,600 |
| Size | 285.6 MB | 46.0 MB |
| Events in quadrant A | 2,613,929 | 307,395 |
| Events in quadrant B | 1,922,137 | 316,241 |
| Events in quadrant C | 1,797,131 | 315,766 |
| Events in quadrant D | 2,522,609 | 296,919 |
| Mode SS | |||
|---|---|---|---|
| Quadrant | BADHDUFLAG | Total packets | Discarded packets |
| A | 0 | 66 | 0 |
| B | 0 | 66 | 0 |
| C | 0 | 66 | 0 |
| D | 0 | 66 | 0 |
| Mode M9 | |||
|---|---|---|---|
| Quadrant | BADHDUFLAG | Total packets | Discarded packets |
| A | 0 | 13 | 0 |
| B | 0 | 13 | 0 |
| C | 0 | 13 | 0 |
| D | 0 | 13 | 0 |
| Mode M0 | |||
|---|---|---|---|
| Quadrant | BADHDUFLAG | Total packets | Discarded packets |
| A | 0 | 9765 | 2 |
| B | 0 | 7742 | 1 |
| C | 0 | 7298 | 1 |
| D | 0 | 9651 | 1 |
| Quadrant | Total seconds | Saturated seconds | Saturation percentage |
|---|---|---|---|
| A | 3141 | 159 | 5.062082% |
| B | 3141 | 116 | 3.693091% |
| C | 3141 | 49 | 1.560013% |
| D | 3141 | 124 | 3.947787% |
Noise dominated data is calculated using 1-second bins in cleaned event files. If a bin has >2000 counts, and if more than 50% of those come from <1% of pixels, then it is considered to be noise-dominated and hence unusable.
| Quadrant | # 1 sec bins | Bins with >0 counts | Bins with >2000 counts | High rate bins dominated by noise | Noise dominated (total time) | Noise dominated (detector-on time) | Marked lightcurve |
|---|---|---|---|---|---|---|---|
| A | 4454 | 3142 | 116 | 116 | 2.60% | 3.69% | 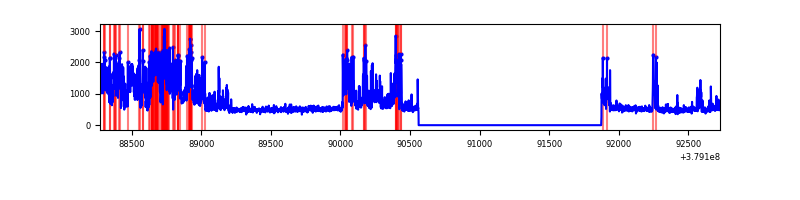 |
| B | 4454 | 3142 | 67 | 67 | 1.50% | 2.13% | 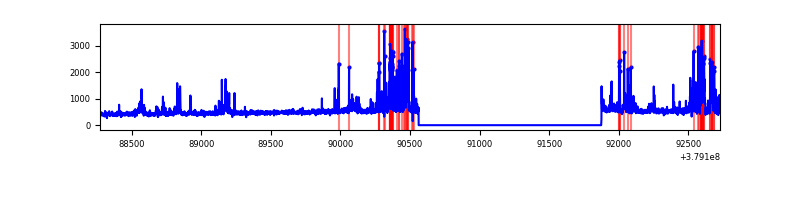 |
| C | 4454 | 3142 | 28 | 28 | 0.63% | 0.89% | 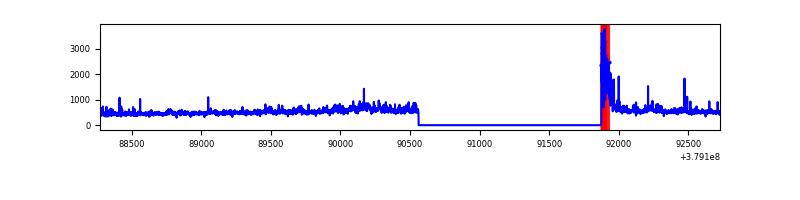 |
| D | 4454 | 3142 | 91 | 91 | 2.04% | 2.90% | 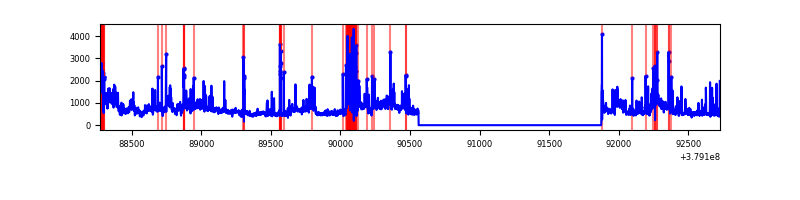 |
Top three noisy pixels from each quadrant. If the there are fewer than three noisy pixels in the level2.evt file, extra rows are filled as -1
| Pixel properties | Quadrant properties | ||||||
|---|---|---|---|---|---|---|---|
| Quadrant | DetID | PixID | Counts | Sigma | Mean | Median | Sigma |
| A | 15 | 169 | 1156406 | 15382.18 | 371 | 364 | 75.2 |
| A | 0 | 31 | 9456 | 120.98 | 371 | 364 | 75.2 |
| A | 10 | 83 | 7439 | 94.14 | 371 | 364 | 75.2 |
| B | 5 | 172 | 340226 | 4718.16 | 366 | 356 | 72.0 |
| B | 3 | 112 | 38399 | 528.12 | 366 | 356 | 72.0 |
| B | 0 | 229 | 28334 | 388.39 | 366 | 356 | 72.0 |
| C | 15 | 214 | 135398 | 1594.61 | 359 | 361 | 84.7 |
| C | 0 | 10 | 129046 | 1519.6 | 359 | 361 | 84.7 |
| C | 14 | 67 | 71692 | 842.32 | 359 | 361 | 84.7 |
| D | 8 | 195 | 465734 | 4856.08 | 354 | 347 | 95.8 |
| D | 8 | 230 | 213501 | 2224.15 | 354 | 347 | 95.8 |
| D | 13 | 249 | 188212 | 1960.28 | 354 | 347 | 95.8 |
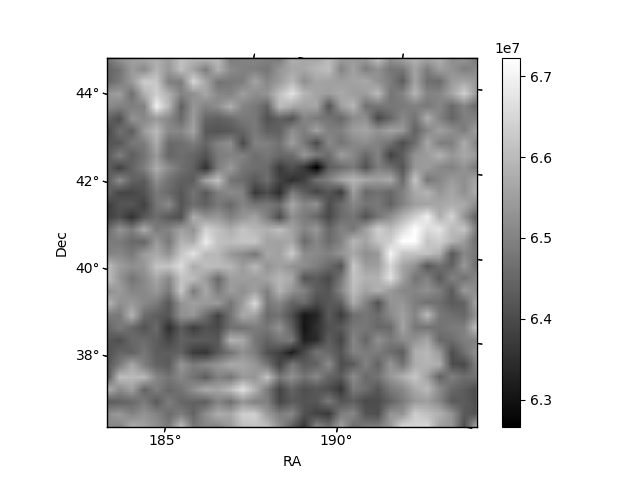
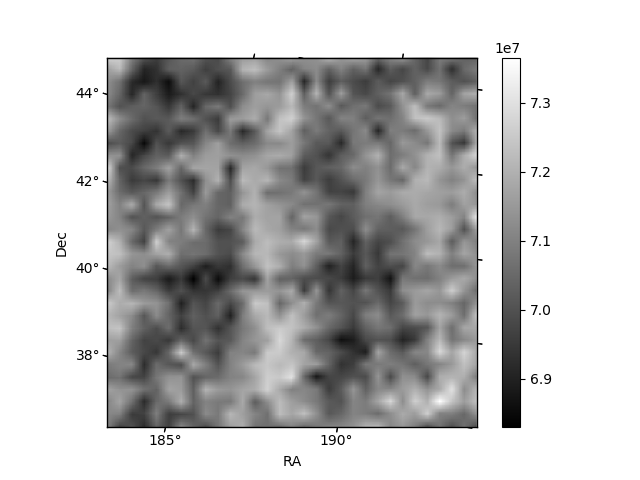
Histogram calculated using DETX and DETY for each event in the final _common_clean file
| Quadrant A | 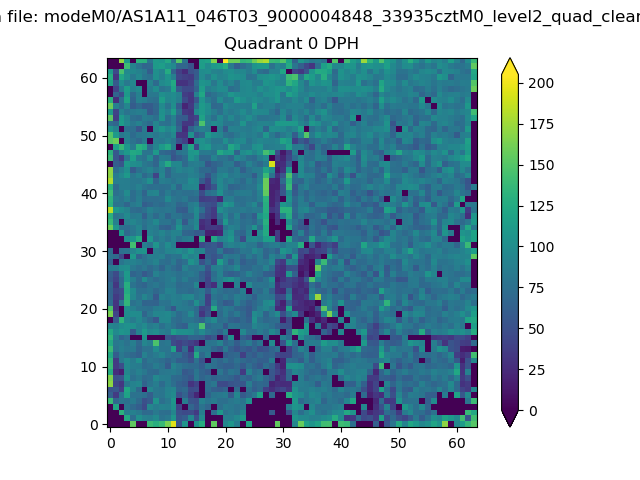 |
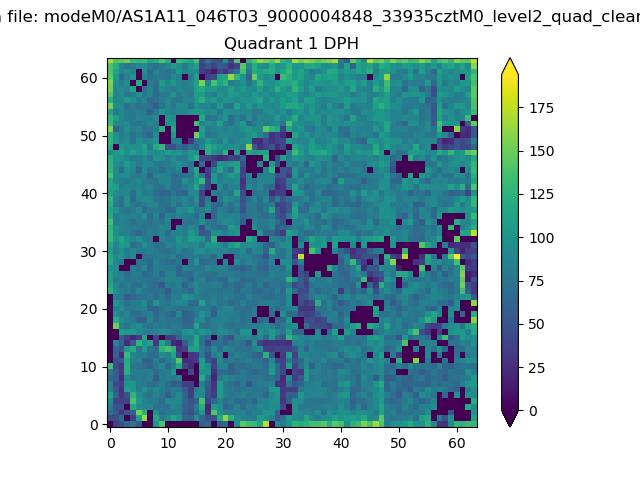 |
Quadrant B |
|---|---|---|---|
| Quadrant D | 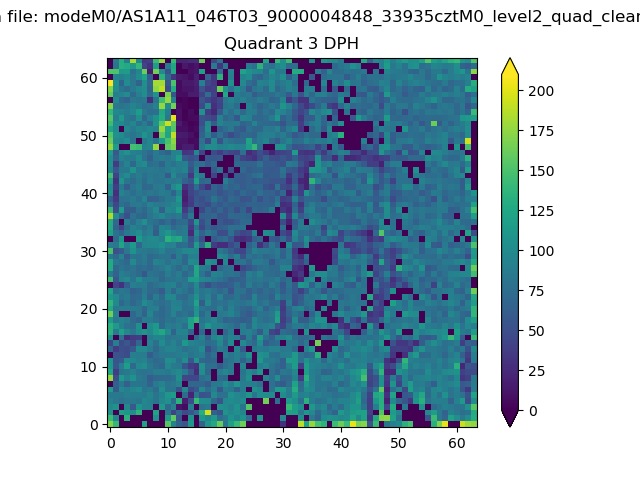 |
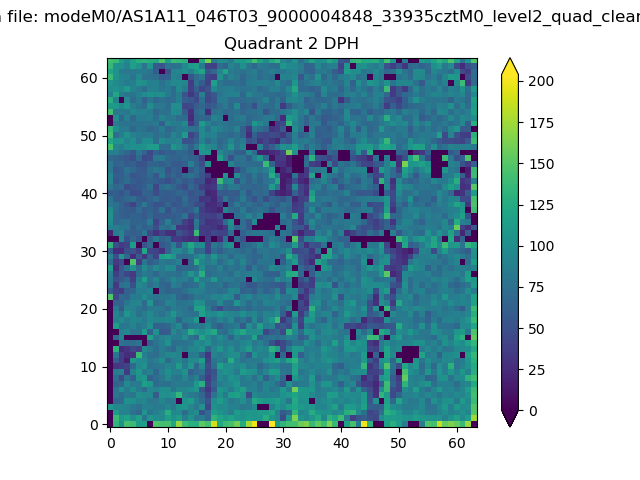 |
Quadrant C |
| Plot type | Count rate plots | Images |
|---|---|---|
| Comparison with Poisson distribution Blue bars denote a histogram of data divided into 1 sec bins. Red curve is a Poisson curve with rate = median count rate of data. |
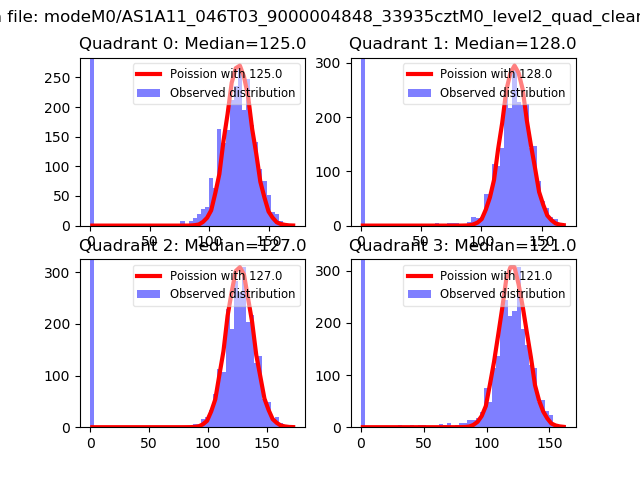 |
 |
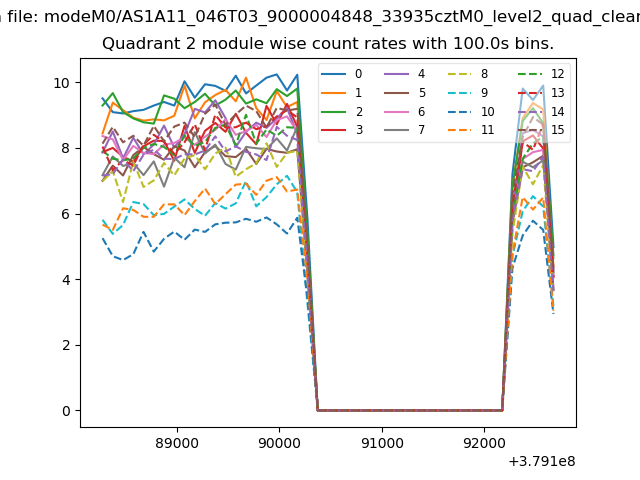
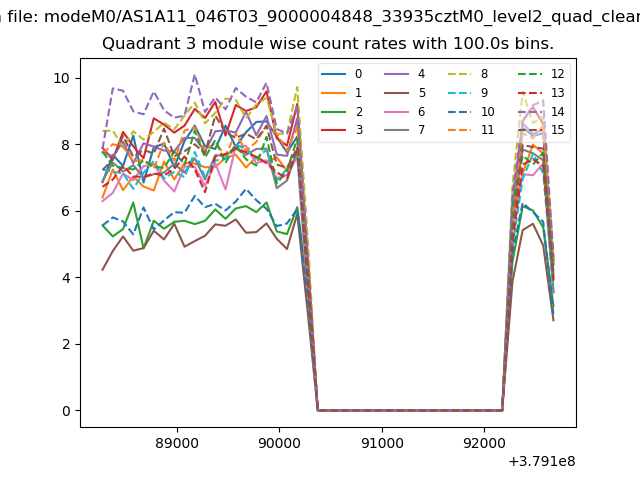
| Quadrant-wise count rates Data is divided into 100 sec bins |
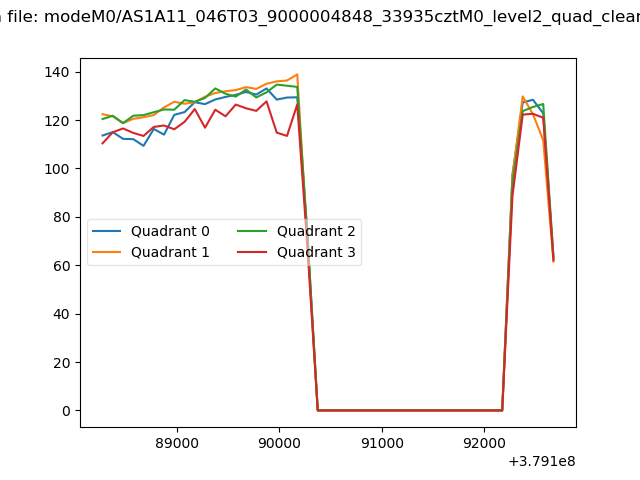 |
|
| Module-wise count rates for Quadrant A Data is divided into 100 sec bins |
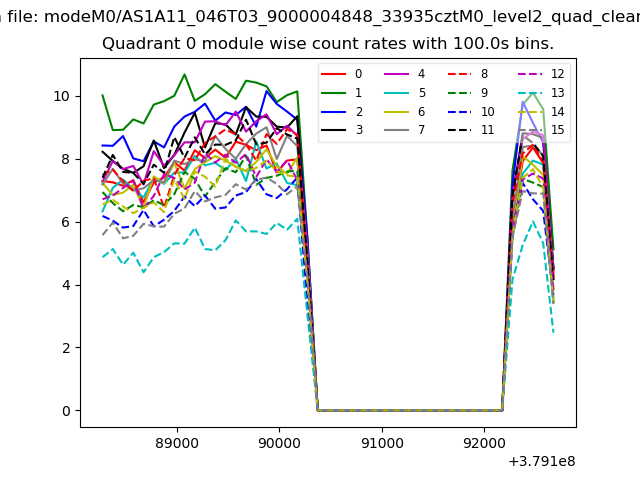 |
 |
| Module-wise count rates for Quadrant B Data is divided into 100 sec bins |
 |
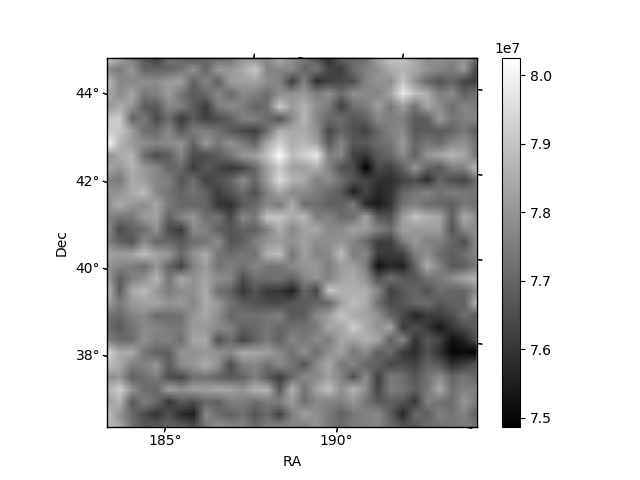 |
| Module-wise count rates for Quadrant C Data is divided into 100 sec bins |
 |
 |
| Module-wise count rates for Quadrant D Data is divided into 100 sec bins |
 |
 |
| Parameter | Plot |
|---|---|
| CZT HV Monitor | 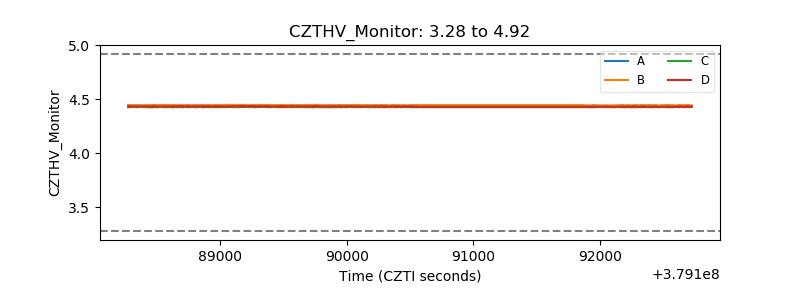 |
| D_VDD | 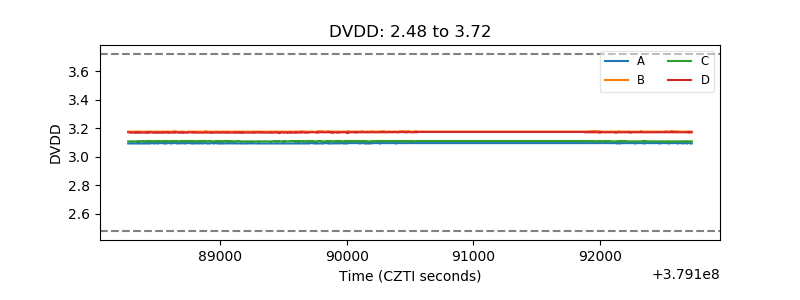 |
| Temperature 1 | 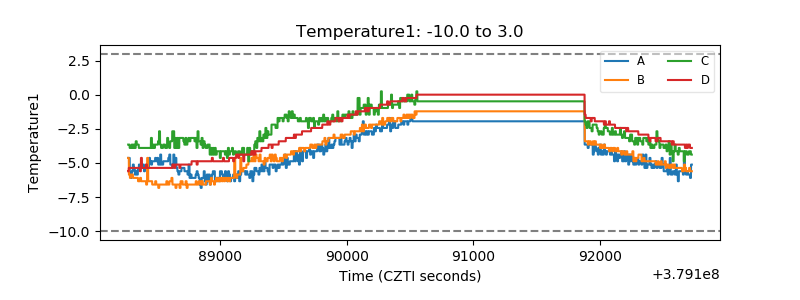 |
| Veto HV Monitor | 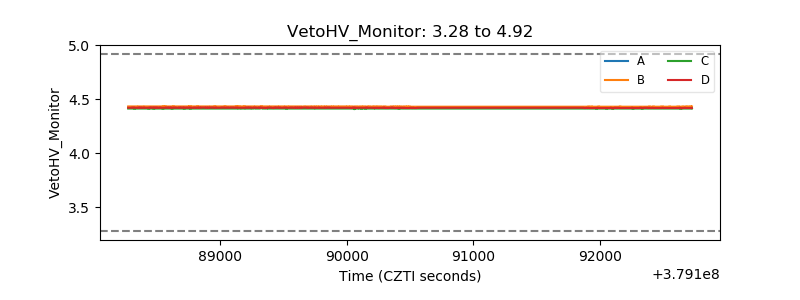 |
| Veto LLD | 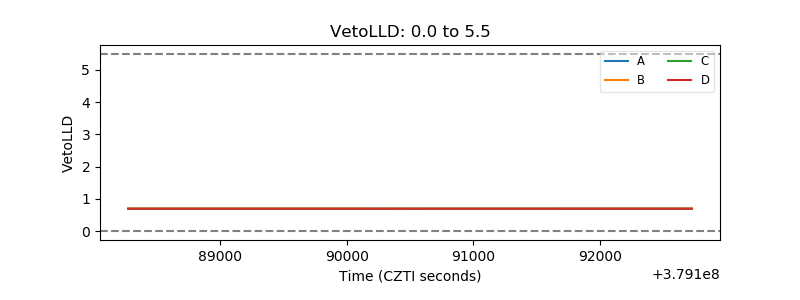 |
| Alpha Counter | 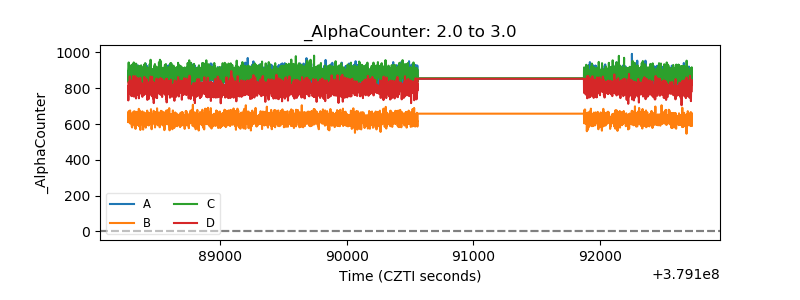 |
| _CPM_Rate | 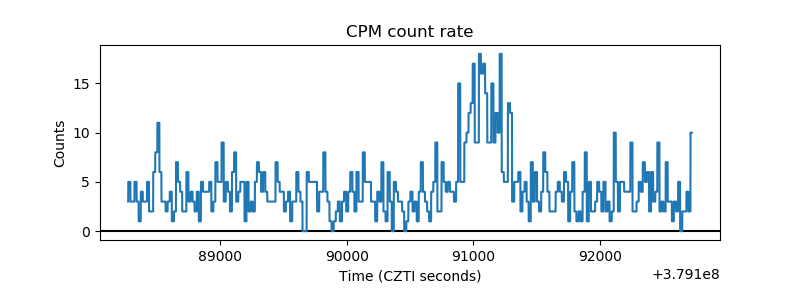 |
| CZT Counter | 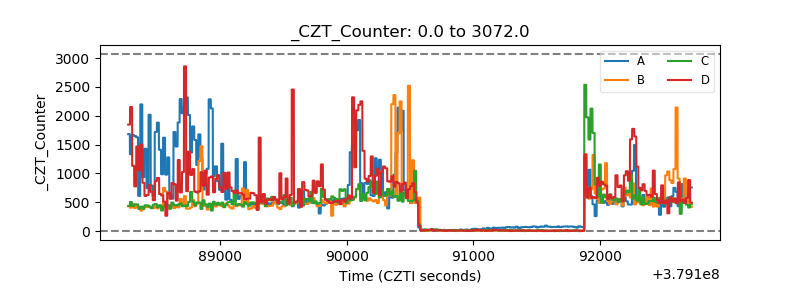 |
| +2.5 Volts monitor |  |
| +5 Volts monitor |  |
| _ROLL_ROT | 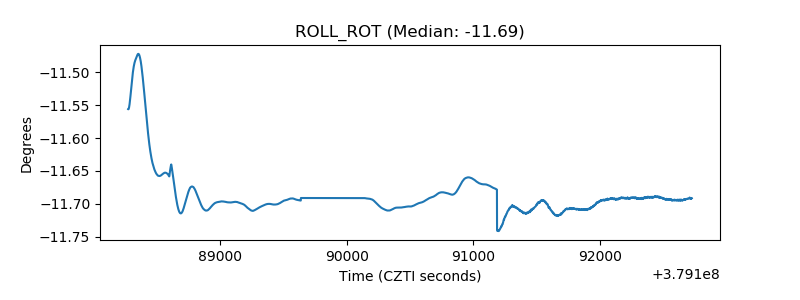 |
| _Roll_DEC | 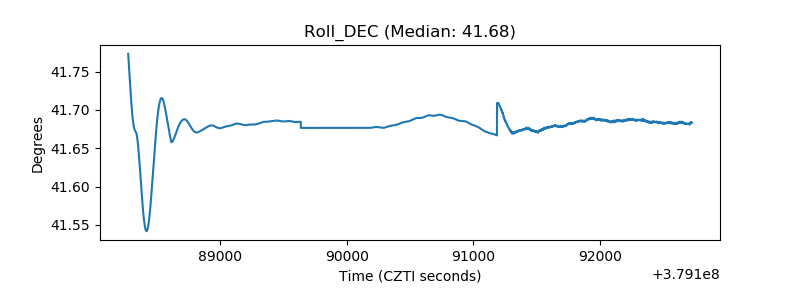 |
| _Roll_RA | 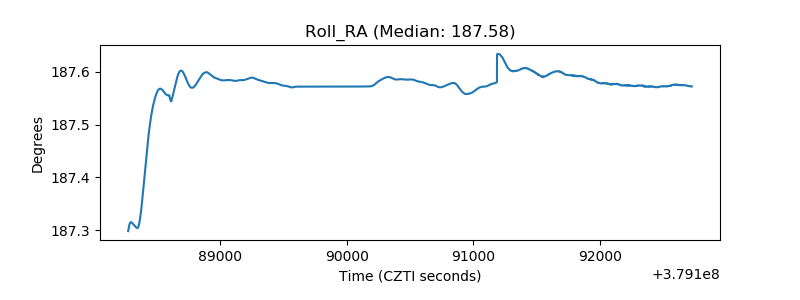 |
| Veto Counter | 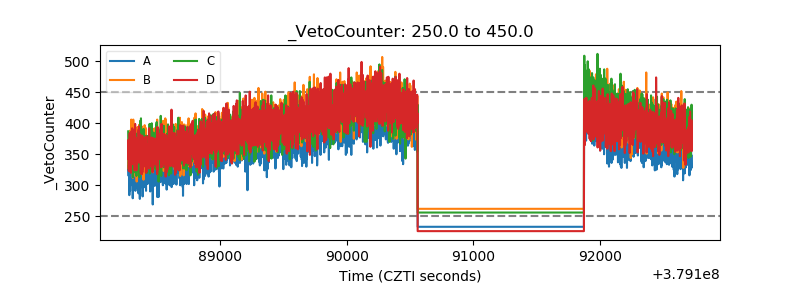 |