| Param | Original file | Final file |
|---|---|---|
| Filename | modeM0/AS1A11_046T03_9000004848_33938cztM0_level2.evt | modeM0/AS1A11_046T03_9000004848_33938cztM0_level2_quad_clean.evt |
| Size (bytes) | 892,356,480 | 141,128,640 |
| Size | 851.0 MB | 134.6 MB |
| Events in quadrant A | 8,063,991 | 864,015 |
| Events in quadrant B | 5,481,001 | 945,623 |
| Events in quadrant C | 5,304,789 | 933,371 |
| Events in quadrant D | 7,524,223 | 862,718 |
| Mode SS | |||
|---|---|---|---|
| Quadrant | BADHDUFLAG | Total packets | Discarded packets |
| A | 0 | 218 | 28 |
| B | 0 | 218 | 16 |
| C | 0 | 218 | 12 |
| D | 0 | 218 | 18 |
| Mode M9 | |||
|---|---|---|---|
| Quadrant | BADHDUFLAG | Total packets | Discarded packets |
| A | 0 | 39 | 2 |
| B | 0 | 39 | 1 |
| C | 0 | 39 | 1 |
| D | 0 | 40 | 1 |
| Mode M0 | |||
|---|---|---|---|
| Quadrant | BADHDUFLAG | Total packets | Discarded packets |
| A | 0 | 35578 | 5007 |
| B | 0 | 25666 | 2786 |
| C | 0 | 24071 | 2273 |
| D | 0 | 33707 | 4690 |
| Quadrant | Total seconds | Saturated seconds | Saturation percentage |
|---|---|---|---|
| A | 9490 | 1058 | 11.148577% |
| B | 9741 | 275 | 2.823119% |
| C | 9757 | 95 | 0.973660% |
| D | 9502 | 348 | 3.662387% |
Noise dominated data is calculated using 1-second bins in cleaned event files. If a bin has >2000 counts, and if more than 50% of those come from <1% of pixels, then it is considered to be noise-dominated and hence unusable.
| Quadrant | # 1 sec bins | Bins with >0 counts | Bins with >2000 counts | High rate bins dominated by noise | Noise dominated (total time) | Noise dominated (detector-on time) | Marked lightcurve |
|---|---|---|---|---|---|---|---|
| A | 13524 | 9977 | 731 | 731 | 5.41% | 7.33% | 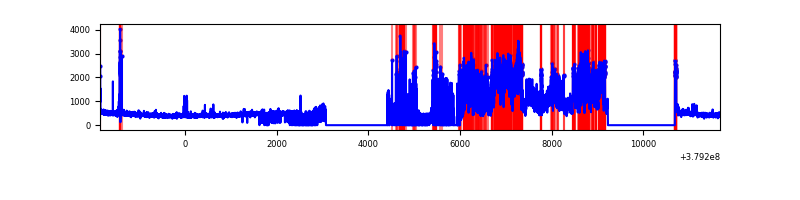 |
| B | 13524 | 10199 | 161 | 161 | 1.19% | 1.58% | 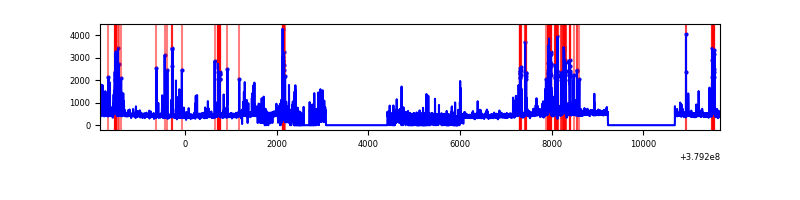 |
| C | 13524 | 10235 | 68 | 68 | 0.50% | 0.66% | 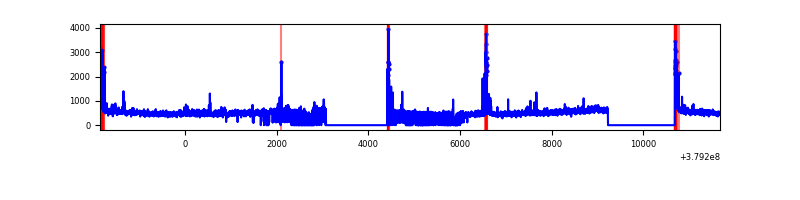 |
| D | 13524 | 9995 | 220 | 220 | 1.63% | 2.20% | 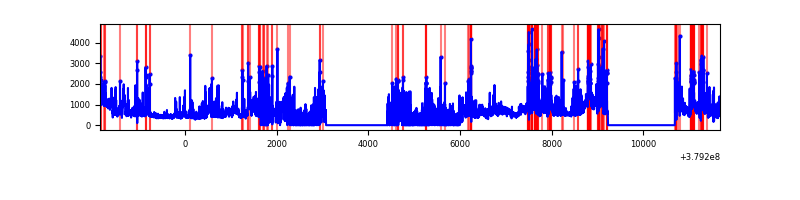 |
Top three noisy pixels from each quadrant. If the there are fewer than three noisy pixels in the level2.evt file, extra rows are filled as -1
| Pixel properties | Quadrant properties | ||||||
|---|---|---|---|---|---|---|---|
| Quadrant | DetID | PixID | Counts | Sigma | Mean | Median | Sigma |
| A | 15 | 169 | 3953831 | 18906.5 | 1044 | 1024 | 209.1 |
| A | 0 | 31 | 33506 | 155.36 | 1044 | 1024 | 209.1 |
| A | 10 | 83 | 18096 | 81.66 | 1044 | 1024 | 209.1 |
| B | 5 | 172 | 868312 | 4186.47 | 1093 | 1065 | 207.2 |
| B | 4 | 251 | 98610 | 470.88 | 1093 | 1065 | 207.2 |
| B | 0 | 229 | 45901 | 216.44 | 1093 | 1065 | 207.2 |
| C | 15 | 214 | 418452 | 1676.76 | 1074 | 1082 | 248.9 |
| C | 0 | 10 | 288456 | 1154.51 | 1074 | 1082 | 248.9 |
| C | 3 | 233 | 210189 | 840.08 | 1074 | 1082 | 248.9 |
| D | 8 | 195 | 1923120 | 6960.57 | 1031 | 1008 | 276.1 |
| D | 2 | 250 | 614757 | 2222.58 | 1031 | 1008 | 276.1 |
| D | 13 | 249 | 432821 | 1563.73 | 1031 | 1008 | 276.1 |
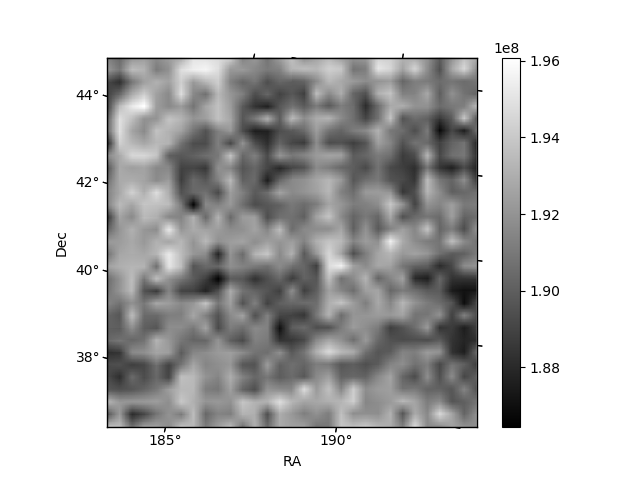
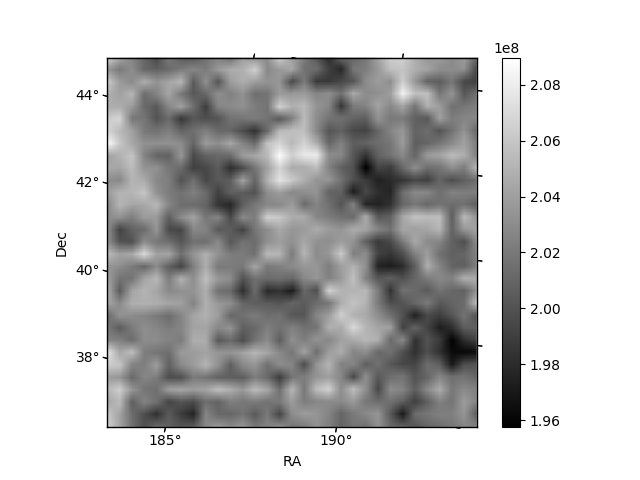
Histogram calculated using DETX and DETY for each event in the final _common_clean file
| Quadrant A | 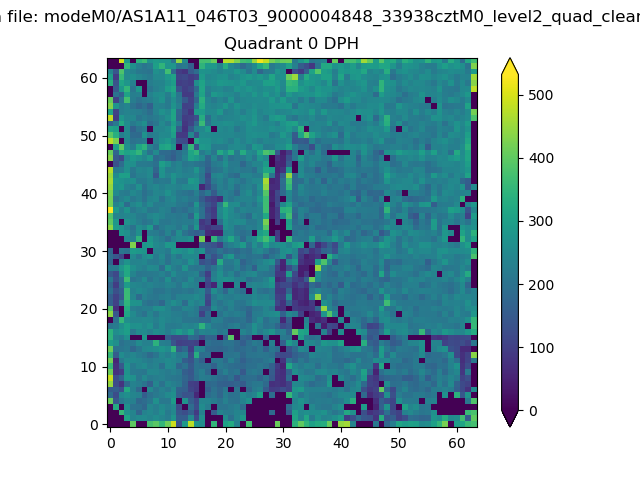 |
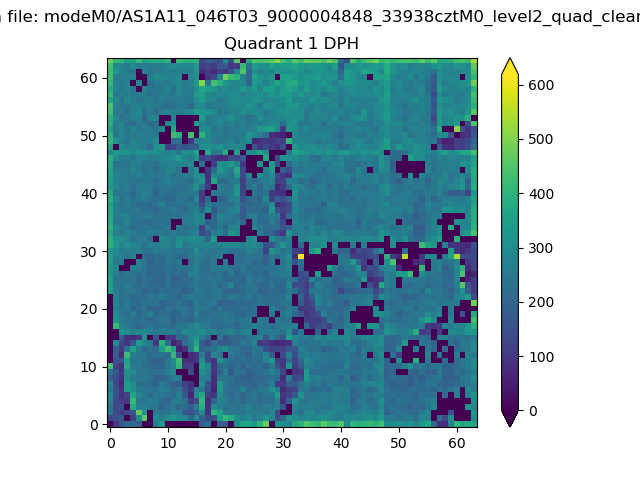 |
Quadrant B |
|---|---|---|---|
| Quadrant D | 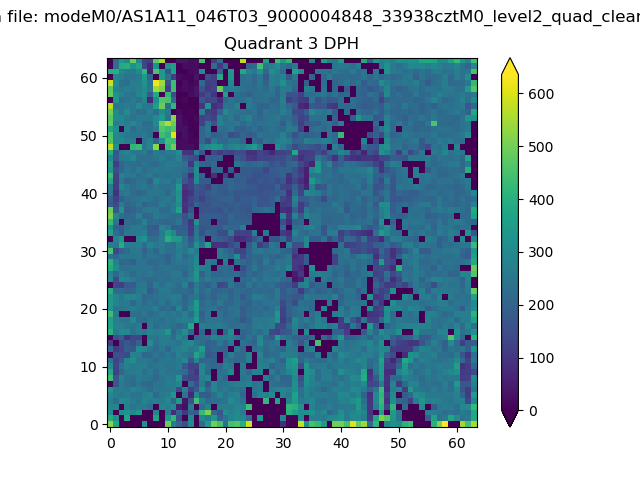 |
 |
Quadrant C |
| Plot type | Count rate plots | Images |
|---|---|---|
| Comparison with Poisson distribution Blue bars denote a histogram of data divided into 1 sec bins. Red curve is a Poisson curve with rate = median count rate of data. |
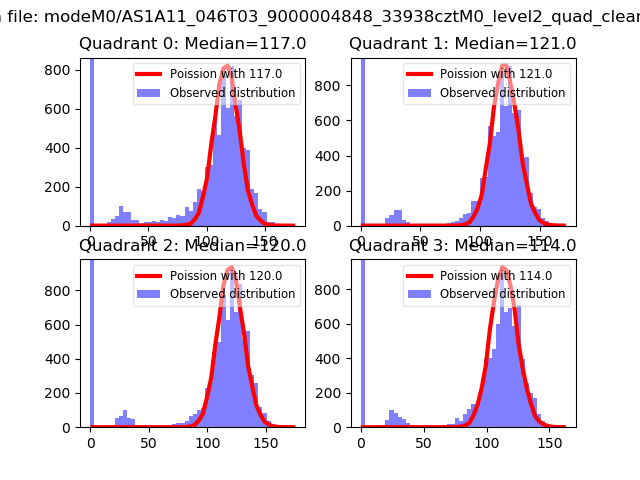 |
 |
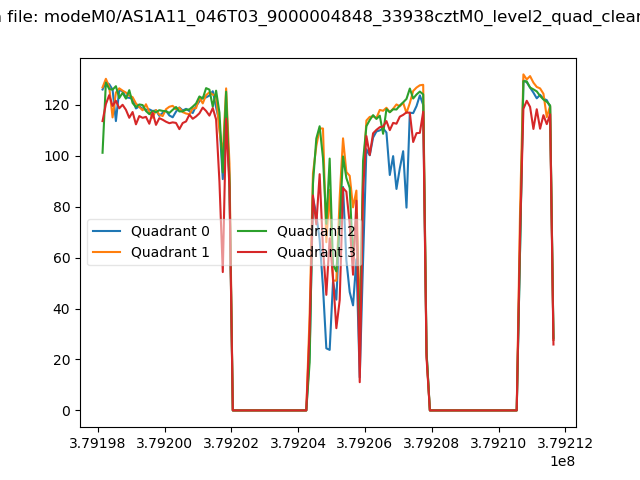
| Quadrant-wise count rates Data is divided into 100 sec bins |
 |
|
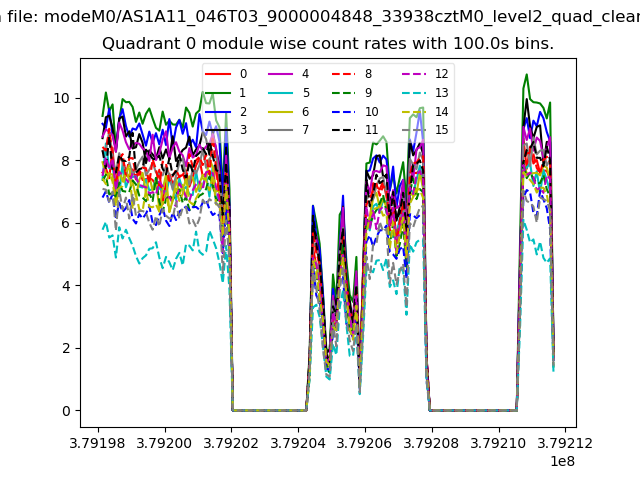
| Module-wise count rates for Quadrant A Data is divided into 100 sec bins |
 |
 |
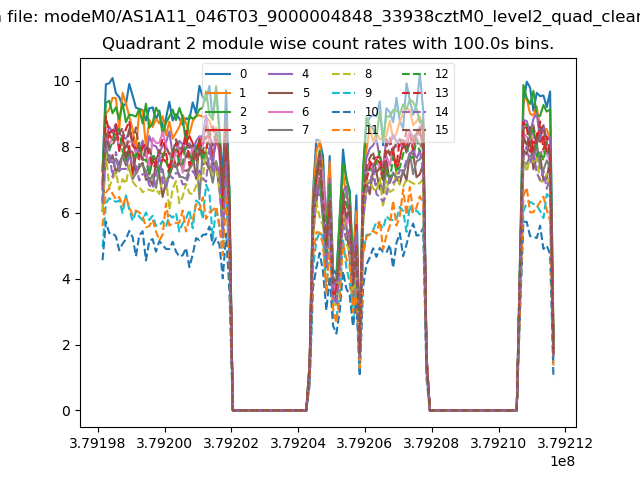
| Module-wise count rates for Quadrant B Data is divided into 100 sec bins |
 |
 |
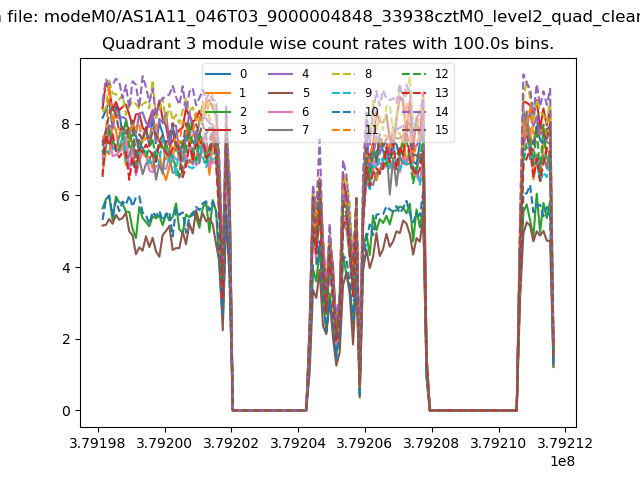
| Module-wise count rates for Quadrant C Data is divided into 100 sec bins |
 |
 |
| Module-wise count rates for Quadrant D Data is divided into 100 sec bins |
 |
 |
| Parameter | Plot |
|---|---|
| CZT HV Monitor | 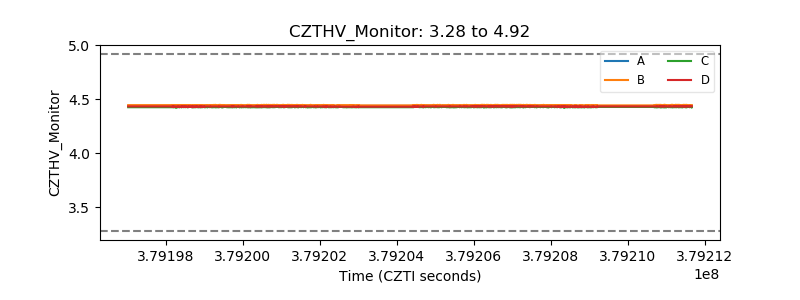 |
| D_VDD | 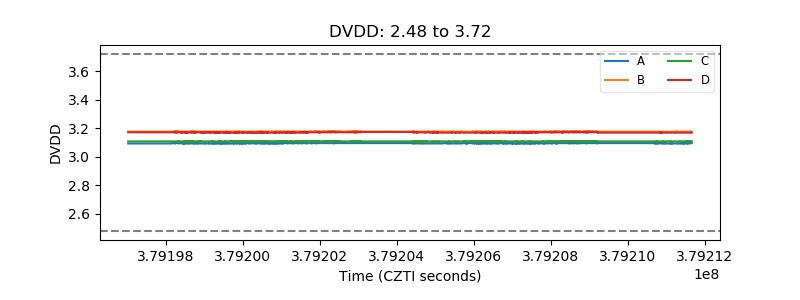 |
| Temperature 1 | 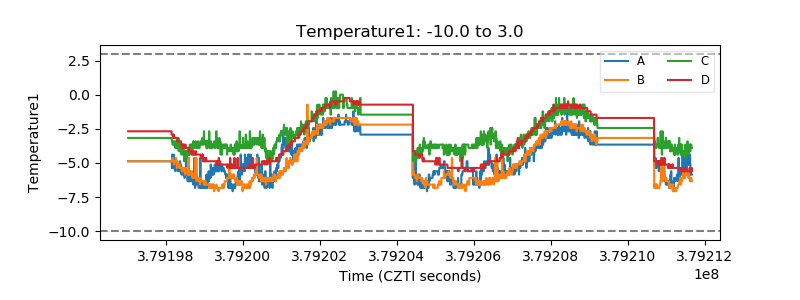 |
| Veto HV Monitor | 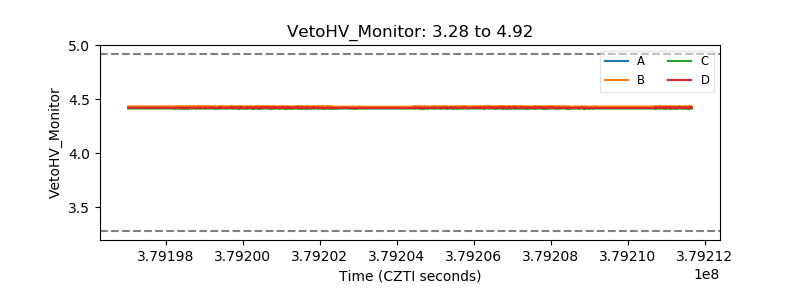 |
| Veto LLD | 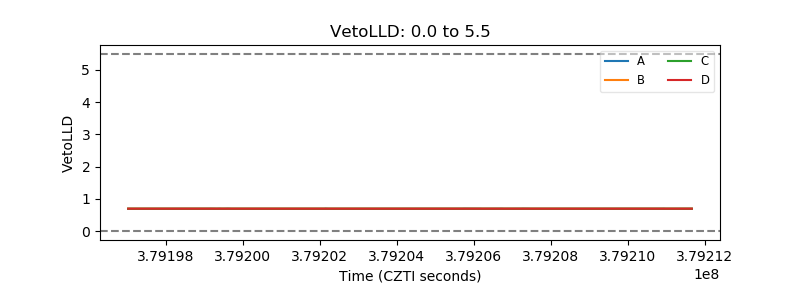 |
| Alpha Counter |  |
| _CPM_Rate | 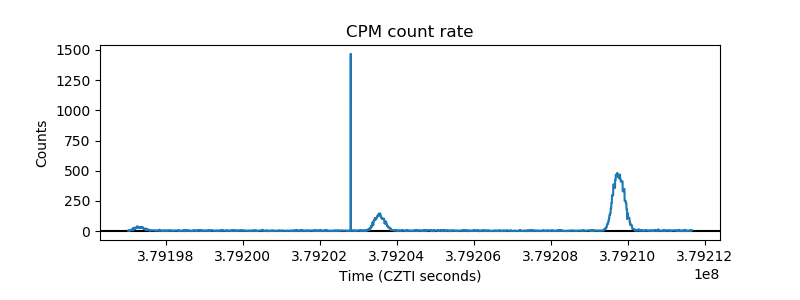 |
| CZT Counter |  |
| +2.5 Volts monitor | 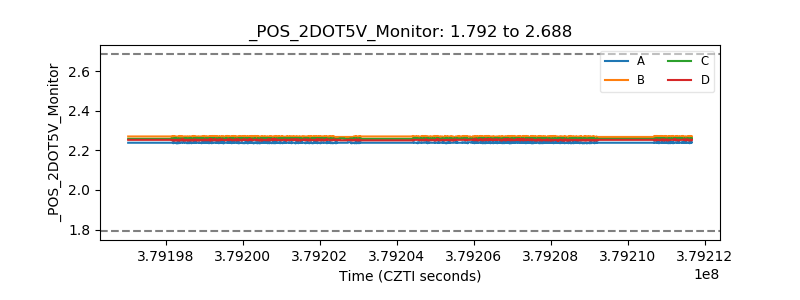 |
| +5 Volts monitor |  |
| _ROLL_ROT | 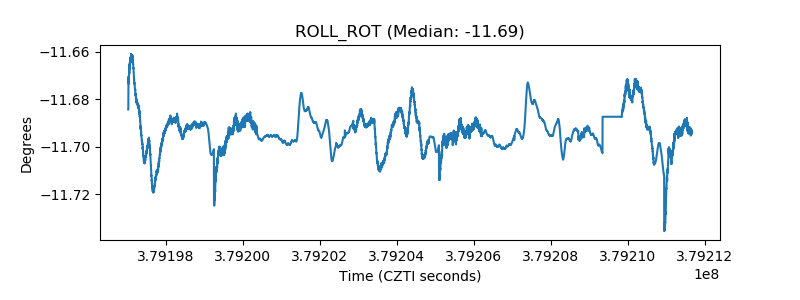 |
| _Roll_DEC | 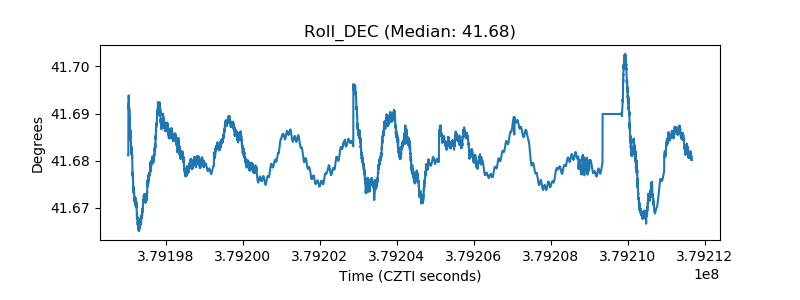 |
| _Roll_RA |  |
| Veto Counter | 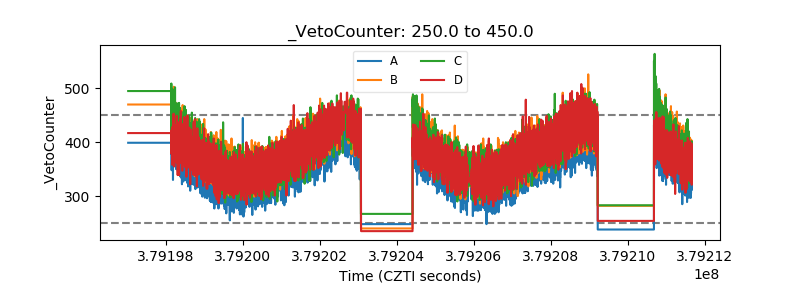 |