| Param | Original file | Final file |
|---|---|---|
| Filename | modeM0/AS1A11_046T03_9000004848_33940cztM0_level2.evt | modeM0/AS1A11_046T03_9000004848_33940cztM0_level2_quad_clean.evt |
| Size (bytes) | 319,584,960 | 61,963,200 |
| Size | 304.8 MB | 59.1 MB |
| Events in quadrant A | 2,019,367 | 395,169 |
| Events in quadrant B | 2,288,205 | 407,039 |
| Events in quadrant C | 2,449,198 | 399,626 |
| Events in quadrant D | 2,622,651 | 366,596 |
| Mode SS | |||
|---|---|---|---|
| Quadrant | BADHDUFLAG | Total packets | Discarded packets |
| A | 0 | 114 | 26 |
| B | 0 | 114 | 24 |
| C | 0 | 114 | 28 |
| D | 0 | 114 | 20 |
| Mode M9 | |||
|---|---|---|---|
| Quadrant | BADHDUFLAG | Total packets | Discarded packets |
| A | 0 | 33 | 0 |
| B | 0 | 33 | 3 |
| C | 0 | 33 | 0 |
| D | 0 | 33 | 0 |
| Mode M0 | |||
|---|---|---|---|
| Quadrant | BADHDUFLAG | Total packets | Discarded packets |
| A | 0 | 11337 | 2416 |
| B | 0 | 12816 | 3174 |
| C | 0 | 12408 | 2472 |
| D | 0 | 15229 | 4576 |
| Quadrant | Total seconds | Saturated seconds | Saturation percentage |
|---|---|---|---|
| A | 4417 | 6 | 0.135839% |
| B | 4382 | 40 | 0.912825% |
| C | 4481 | 38 | 0.848025% |
| D | 4208 | 71 | 1.687262% |
Noise dominated data is calculated using 1-second bins in cleaned event files. If a bin has >2000 counts, and if more than 50% of those come from <1% of pixels, then it is considered to be noise-dominated and hence unusable.
| Quadrant | # 1 sec bins | Bins with >0 counts | Bins with >2000 counts | High rate bins dominated by noise | Noise dominated (total time) | Noise dominated (detector-on time) | Marked lightcurve |
|---|---|---|---|---|---|---|---|
| A | 8888 | 5089 | 0 | 0 | 0.00% | 0.00% | 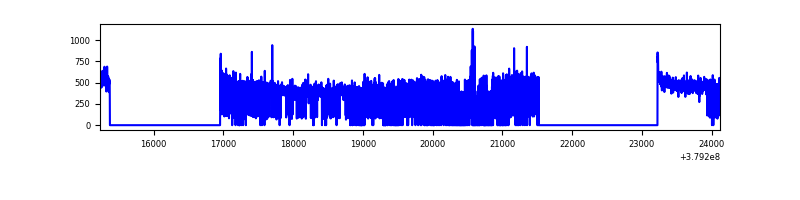 |
| B | 8888 | 5019 | 18 | 18 | 0.20% | 0.36% | 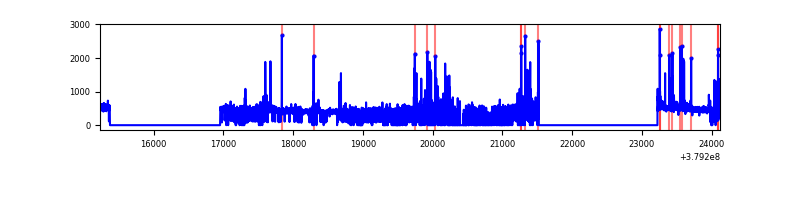 |
| C | 8888 | 5088 | 25 | 25 | 0.28% | 0.49% | 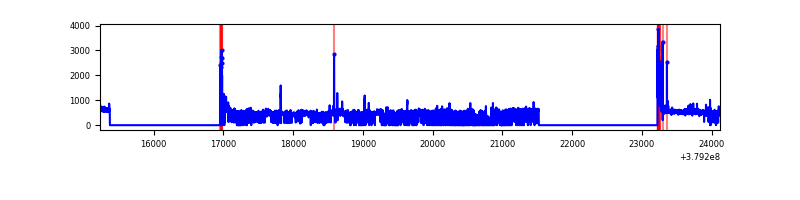 |
| D | 8888 | 4900 | 35 | 35 | 0.39% | 0.71% | 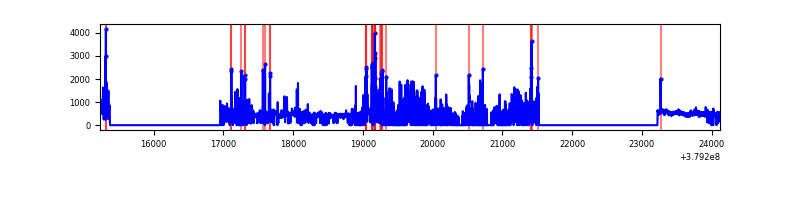 |
Top three noisy pixels from each quadrant. If the there are fewer than three noisy pixels in the level2.evt file, extra rows are filled as -1
| Pixel properties | Quadrant properties | ||||||
|---|---|---|---|---|---|---|---|
| Quadrant | DetID | PixID | Counts | Sigma | Mean | Median | Sigma |
| A | 10 | 83 | 13271 | 123.79 | 513 | 503 | 103.1 |
| A | 15 | 169 | 10687 | 98.74 | 513 | 503 | 103.1 |
| A | 13 | 6 | 9200 | 84.32 | 513 | 503 | 103.1 |
| B | 5 | 172 | 206180 | 2123.05 | 505 | 492 | 96.9 |
| B | 3 | 112 | 39542 | 403.06 | 505 | 492 | 96.9 |
| B | 0 | 229 | 12015 | 118.94 | 505 | 492 | 96.9 |
| C | 15 | 214 | 196044 | 1687.67 | 498 | 501 | 115.9 |
| C | 0 | 10 | 168794 | 1452.48 | 498 | 501 | 115.9 |
| C | 3 | 233 | 98557 | 846.29 | 498 | 501 | 115.9 |
| D | 8 | 195 | 387298 | 3380.52 | 466 | 454 | 114.4 |
| D | 2 | 250 | 173521 | 1512.38 | 466 | 454 | 114.4 |
| D | 13 | 249 | 71789 | 623.38 | 466 | 454 | 114.4 |
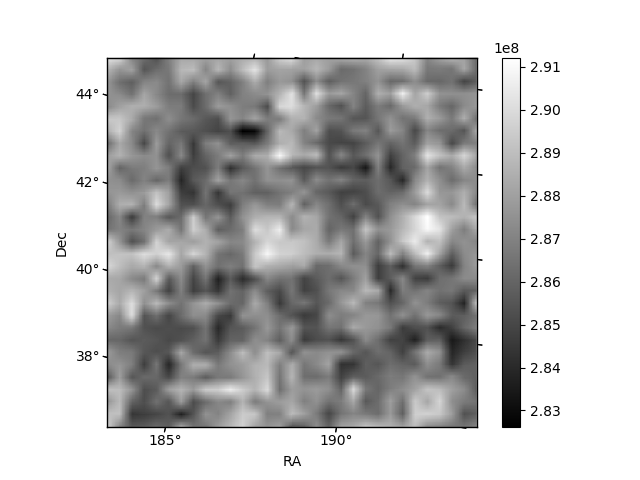
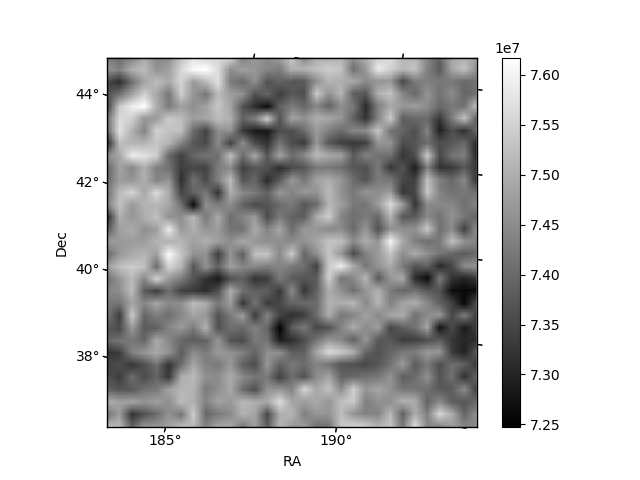
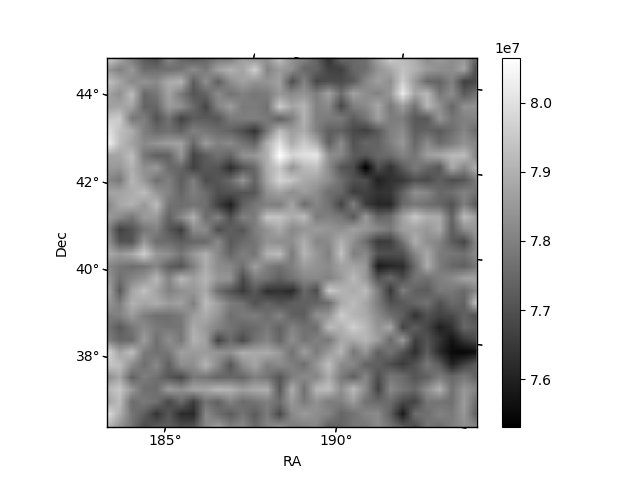
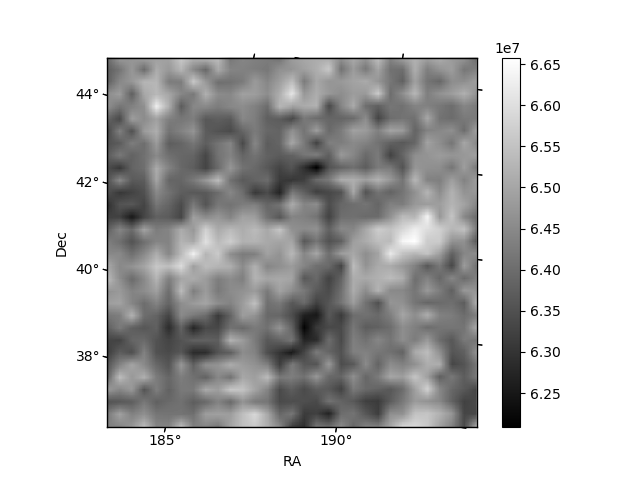
Histogram calculated using DETX and DETY for each event in the final _common_clean file
| Quadrant A | 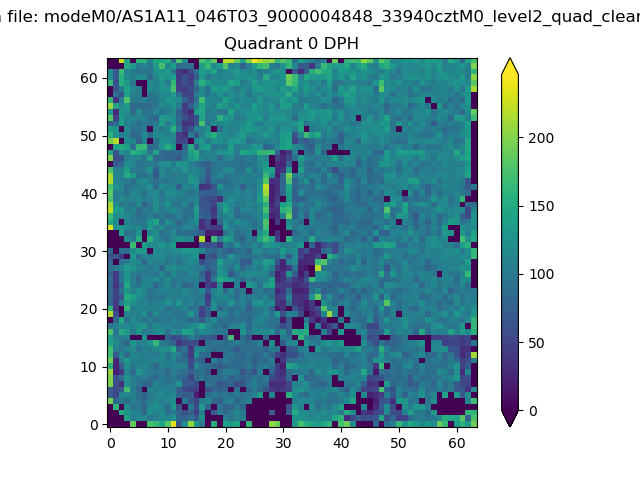 |
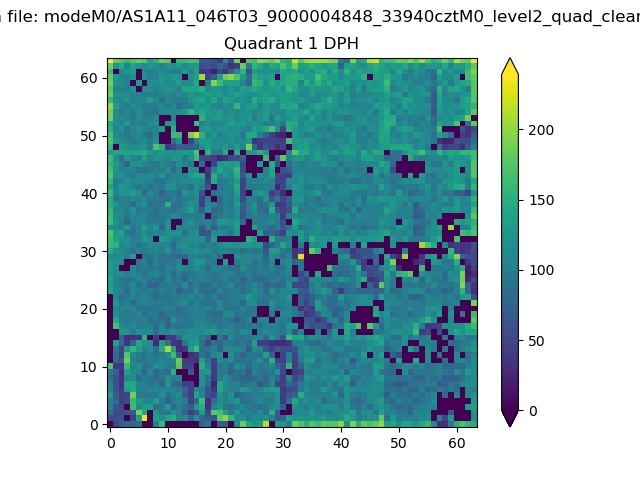 |
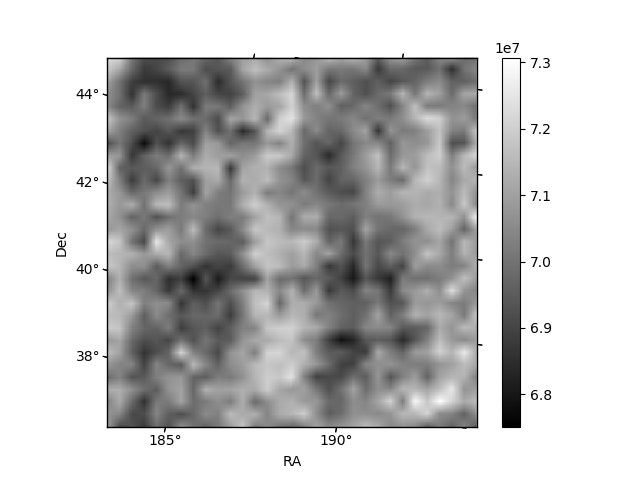
Quadrant B |
|---|---|---|---|
| Quadrant D | 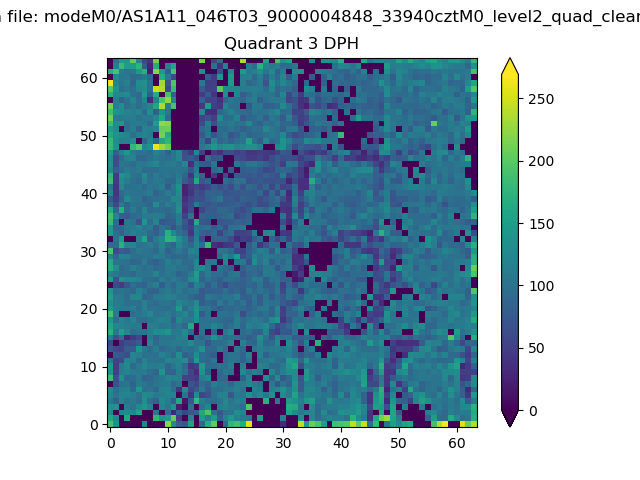 |
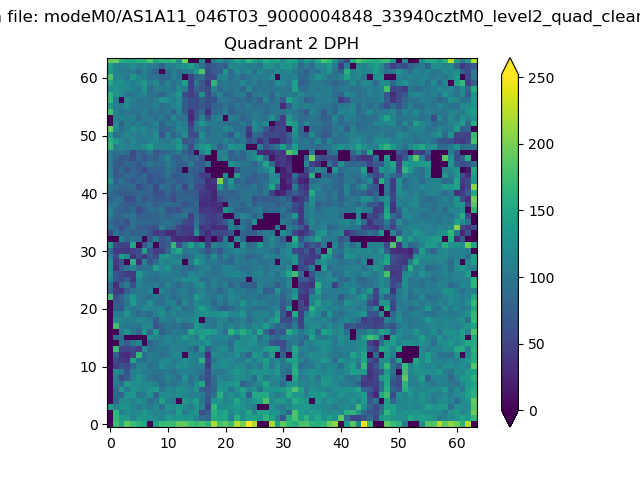 |
Quadrant C |
| Plot type | Count rate plots | Images |
|---|---|---|
| Comparison with Poisson distribution Blue bars denote a histogram of data divided into 1 sec bins. Red curve is a Poisson curve with rate = median count rate of data. |
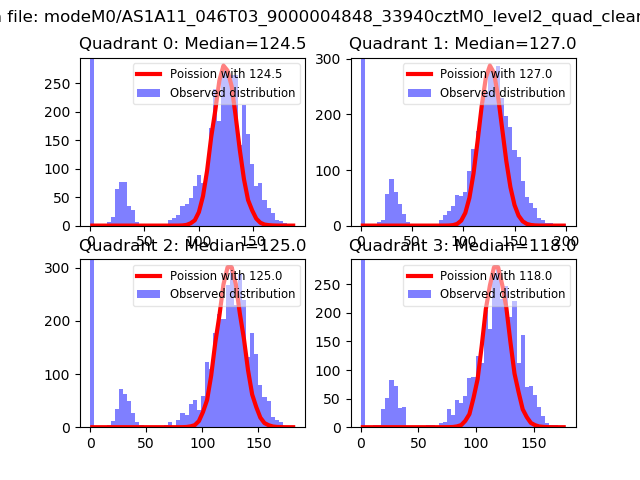 |
 |
| Quadrant-wise count rates Data is divided into 100 sec bins |
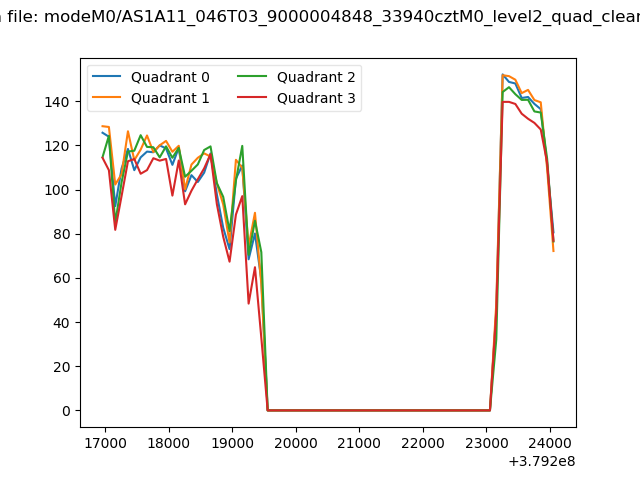 |
|
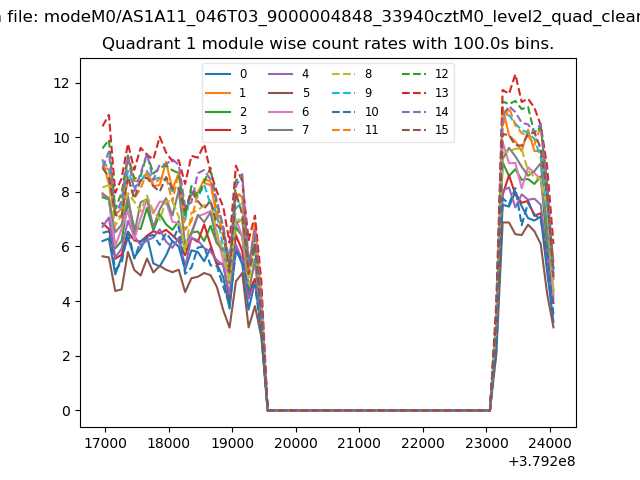
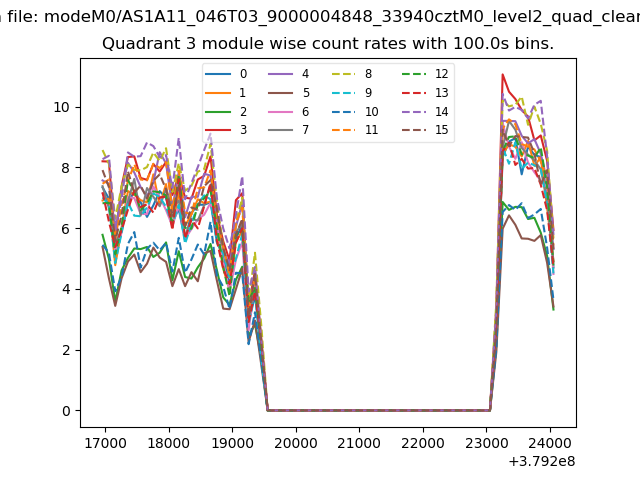
| Module-wise count rates for Quadrant A Data is divided into 100 sec bins |
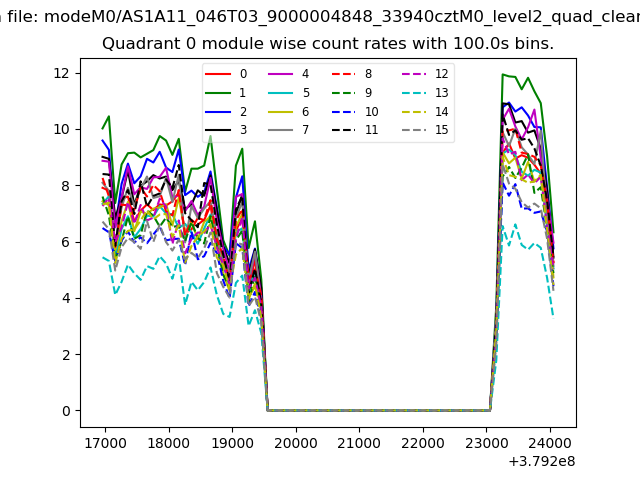 |
 |
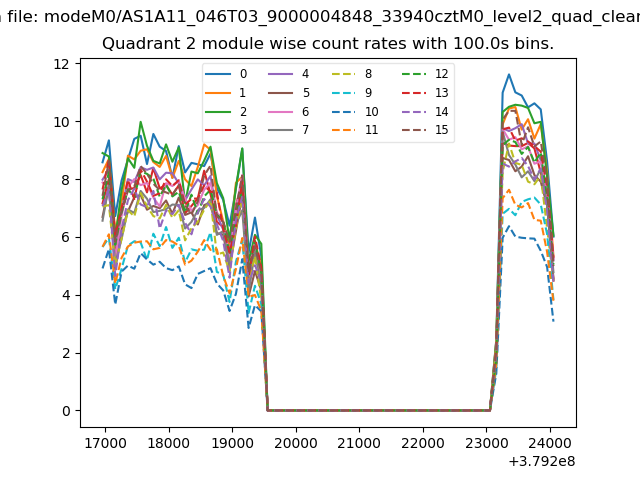
| Module-wise count rates for Quadrant B Data is divided into 100 sec bins |
 |
 |
| Module-wise count rates for Quadrant C Data is divided into 100 sec bins |
 |
 |
| Module-wise count rates for Quadrant D Data is divided into 100 sec bins |
 |
 |
| Parameter | Plot |
|---|---|
| CZT HV Monitor | 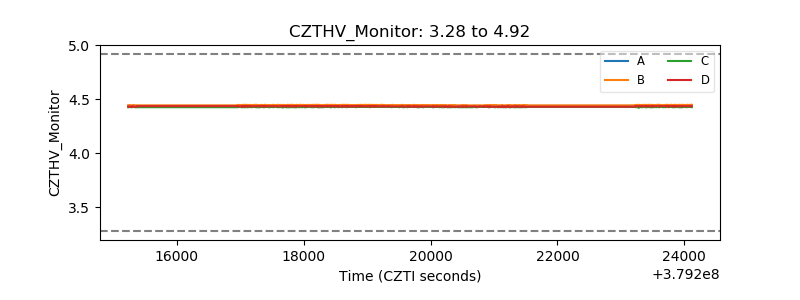 |
| D_VDD | 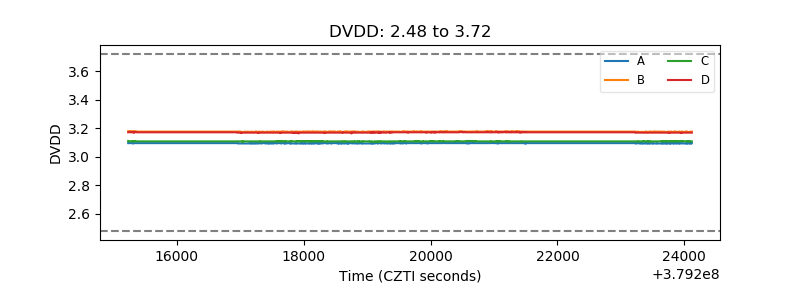 |
| Temperature 1 | 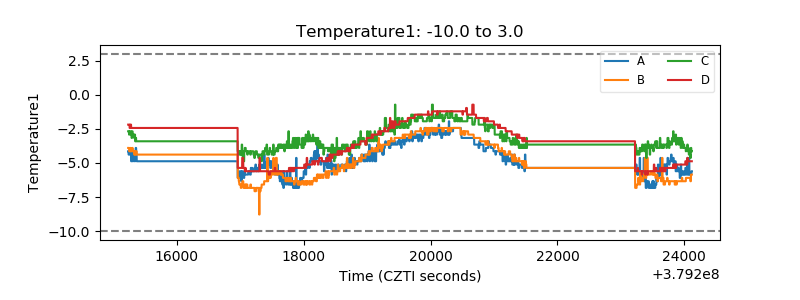 |
| Veto HV Monitor | 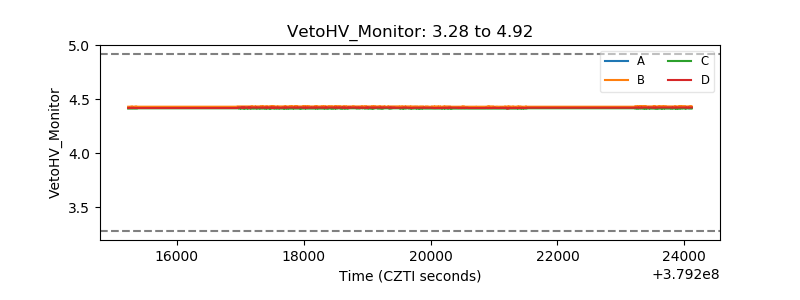 |
| Veto LLD | 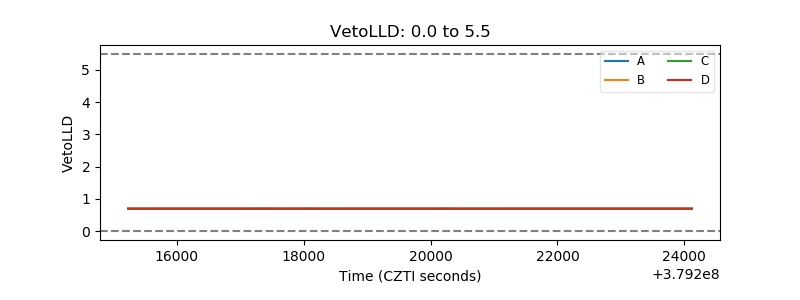 |
| Alpha Counter | 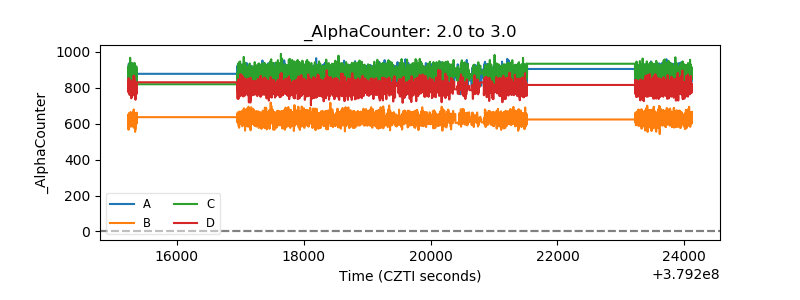 |
| _CPM_Rate | 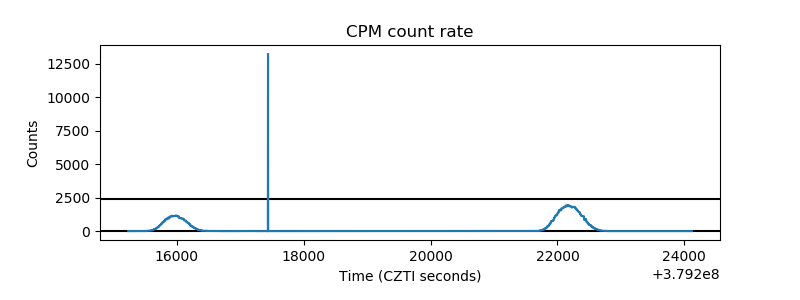 |
| CZT Counter | 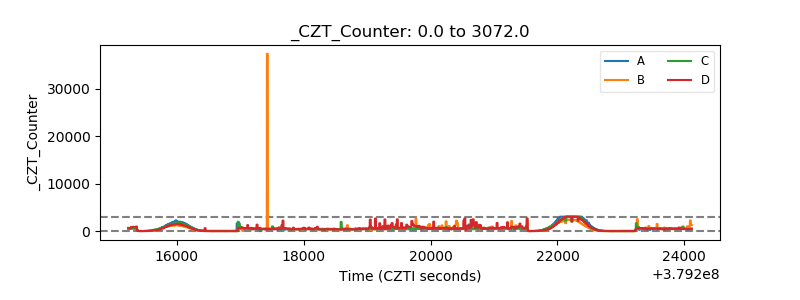 |
| +2.5 Volts monitor |  |
| +5 Volts monitor |  |
| _ROLL_ROT | 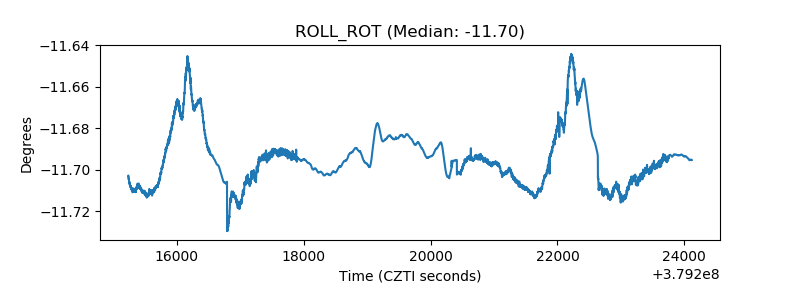 |
| _Roll_DEC | 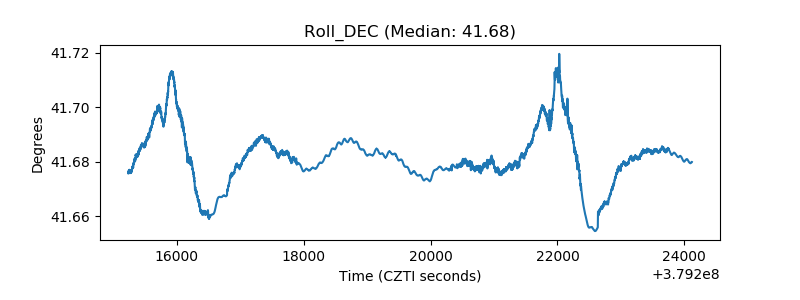 |
| _Roll_RA | 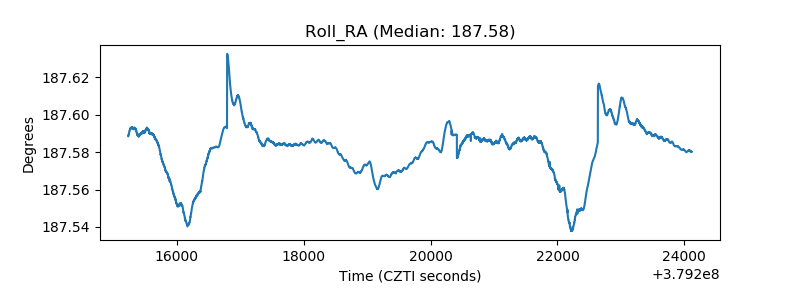 |
| Veto Counter | 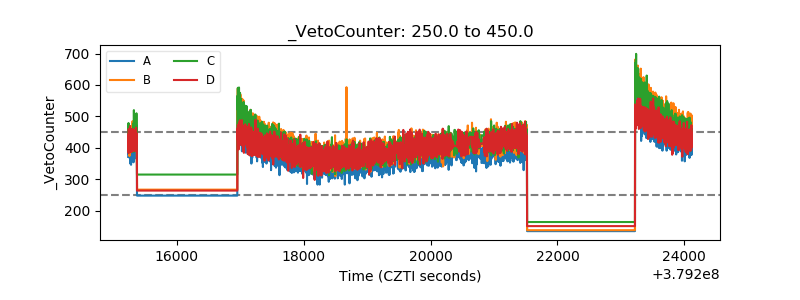 |