| Param | Original file | Final file |
|---|---|---|
| Filename | modeM0/AS1A11_046T03_9000004848_33942cztM0_level2.evt | modeM0/AS1A11_046T03_9000004848_33942cztM0_level2_quad_clean.evt |
| Size (bytes) | 2,057,832,000 | 317,378,880 |
| Size | 1.9 GB | 302.7 MB |
| Events in quadrant A | 15,732,383 | 1,971,729 |
| Events in quadrant B | 13,477,135 | 2,047,403 |
| Events in quadrant C | 13,188,855 | 2,017,164 |
| Events in quadrant D | 18,293,407 | 1,911,217 |
| Mode SS | |||
|---|---|---|---|
| Quadrant | BADHDUFLAG | Total packets | Discarded packets |
| A | 0 | 496 | 0 |
| B | 0 | 496 | 0 |
| C | 0 | 496 | 0 |
| D | 0 | 496 | 0 |
| Mode M9 | |||
|---|---|---|---|
| Quadrant | BADHDUFLAG | Total packets | Discarded packets |
| A | 0 | 79 | 0 |
| B | 0 | 79 | 0 |
| C | 0 | 79 | 0 |
| D | 0 | 79 | 0 |
| Mode M0 | |||
|---|---|---|---|
| Quadrant | BADHDUFLAG | Total packets | Discarded packets |
| A | 0 | 62927 | 6 |
| B | 0 | 55984 | 5 |
| C | 0 | 53948 | 5 |
| D | 0 | 71101 | 5 |
| Quadrant | Total seconds | Saturated seconds | Saturation percentage |
|---|---|---|---|
| A | 24194 | 1355 | 5.600562% |
| B | 24194 | 579 | 2.393155% |
| C | 24194 | 149 | 0.615855% |
| D | 24194 | 873 | 3.608333% |
Noise dominated data is calculated using 1-second bins in cleaned event files. If a bin has >2000 counts, and if more than 50% of those come from <1% of pixels, then it is considered to be noise-dominated and hence unusable.
| Quadrant | # 1 sec bins | Bins with >0 counts | Bins with >2000 counts | High rate bins dominated by noise | Noise dominated (total time) | Noise dominated (detector-on time) | Marked lightcurve |
|---|---|---|---|---|---|---|---|
| A | 32134 | 24198 | 974 | 974 | 3.03% | 4.03% | 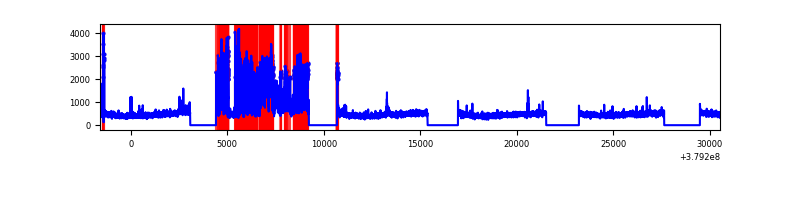 |
| B | 32134 | 24198 | 347 | 347 | 1.08% | 1.43% | 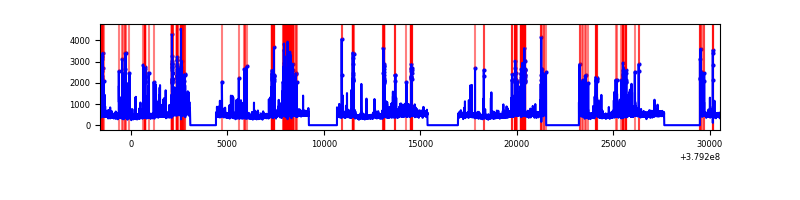 |
| C | 32134 | 24198 | 107 | 107 | 0.33% | 0.44% | 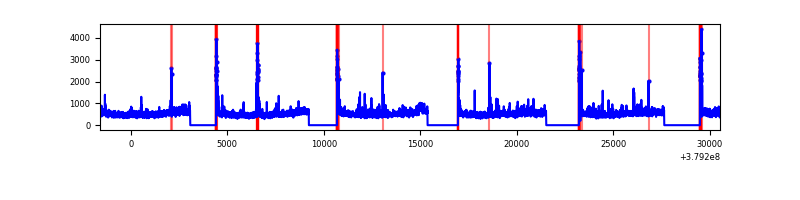 |
| D | 32134 | 24198 | 613 | 613 | 1.91% | 2.53% | 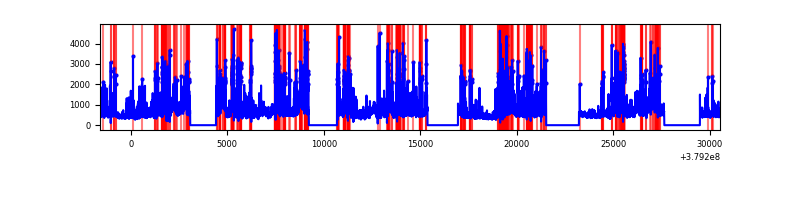 |
Top three noisy pixels from each quadrant. If the there are fewer than three noisy pixels in the level2.evt file, extra rows are filled as -1
| Pixel properties | Quadrant properties | ||||||
|---|---|---|---|---|---|---|---|
| Quadrant | DetID | PixID | Counts | Sigma | Mean | Median | Sigma |
| A | 15 | 169 | 4921203 | 8998.92 | 2766 | 2711 | 546.6 |
| A | 0 | 31 | 41354 | 70.7 | 2766 | 2711 | 546.6 |
| A | 13 | 254 | 39895 | 68.03 | 2766 | 2711 | 546.6 |
| B | 5 | 172 | 1847850 | 3541.54 | 2771 | 2694 | 521.0 |
| B | 4 | 251 | 156112 | 294.47 | 2771 | 2694 | 521.0 |
| B | 0 | 229 | 108132 | 202.37 | 2771 | 2694 | 521.0 |
| C | 15 | 214 | 1032718 | 1668.57 | 2711 | 2730 | 617.3 |
| C | 3 | 233 | 579387 | 934.18 | 2711 | 2730 | 617.3 |
| C | 0 | 10 | 578906 | 933.4 | 2711 | 2730 | 617.3 |
| D | 8 | 195 | 3732480 | 5582.8 | 2704 | 2630 | 668.1 |
| D | 2 | 250 | 1656542 | 2475.56 | 2704 | 2630 | 668.1 |
| D | 13 | 249 | 854823 | 1275.55 | 2704 | 2630 | 668.1 |
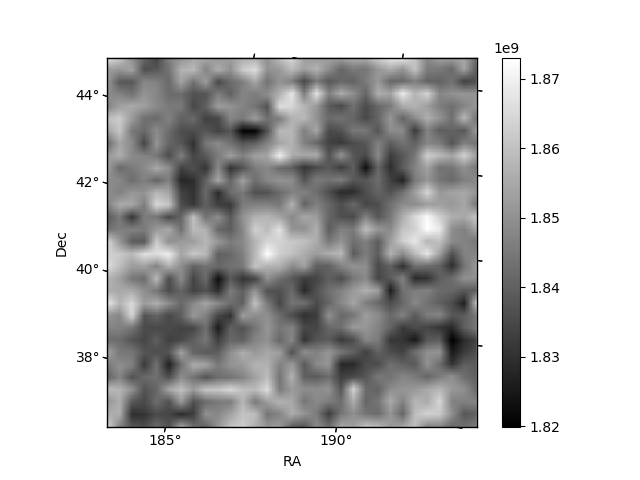
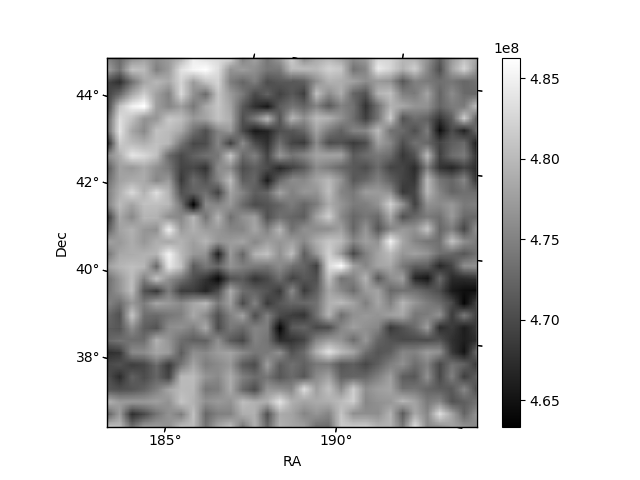
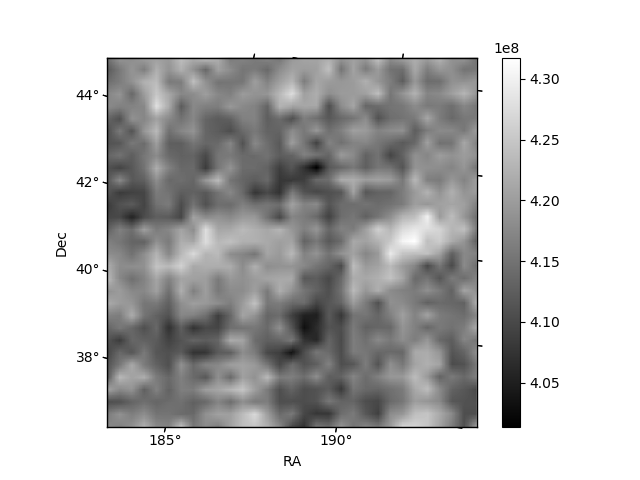
Histogram calculated using DETX and DETY for each event in the final _common_clean file
| Quadrant A | 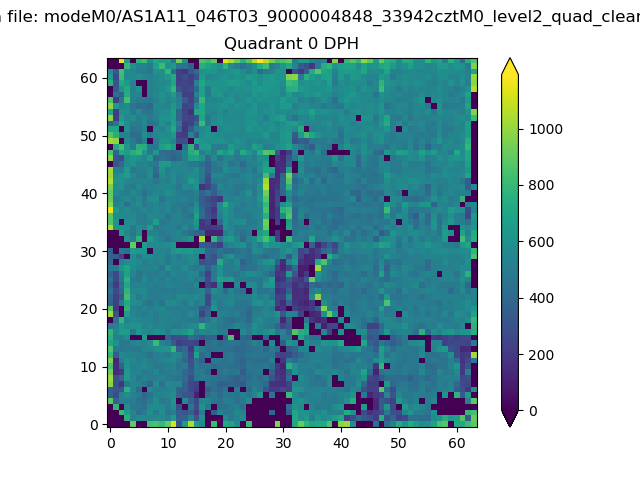 |
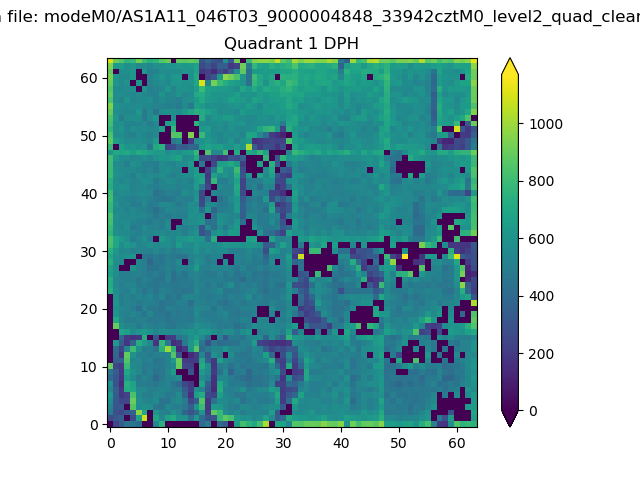 |
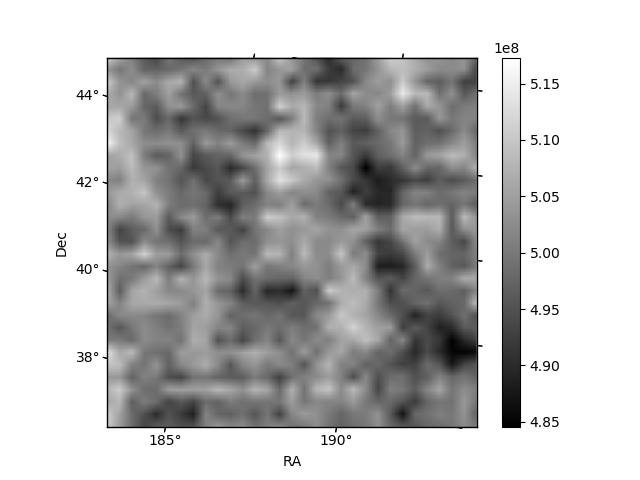
Quadrant B |
|---|---|---|---|
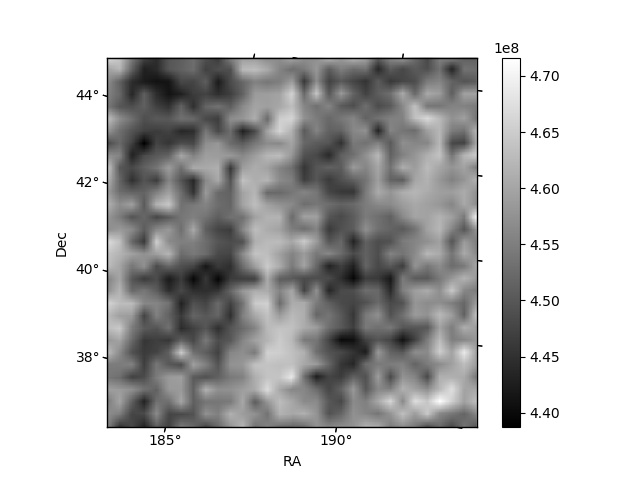
| Quadrant D | 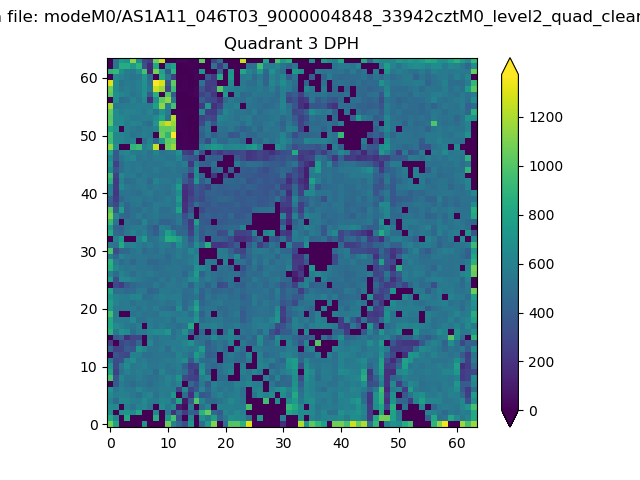 |
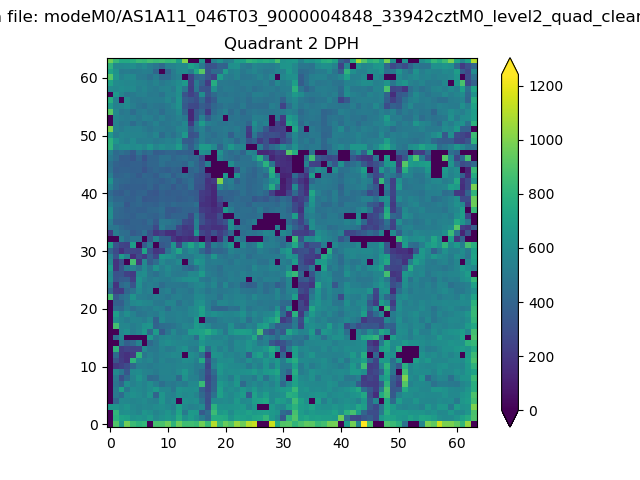 |
Quadrant C |
| Plot type | Count rate plots | Images |
|---|---|---|
| Comparison with Poisson distribution Blue bars denote a histogram of data divided into 1 sec bins. Red curve is a Poisson curve with rate = median count rate of data. |
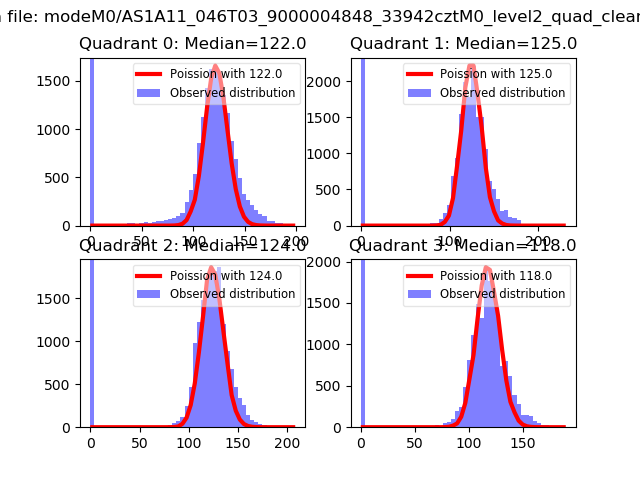 |
 |
| Quadrant-wise count rates Data is divided into 100 sec bins |
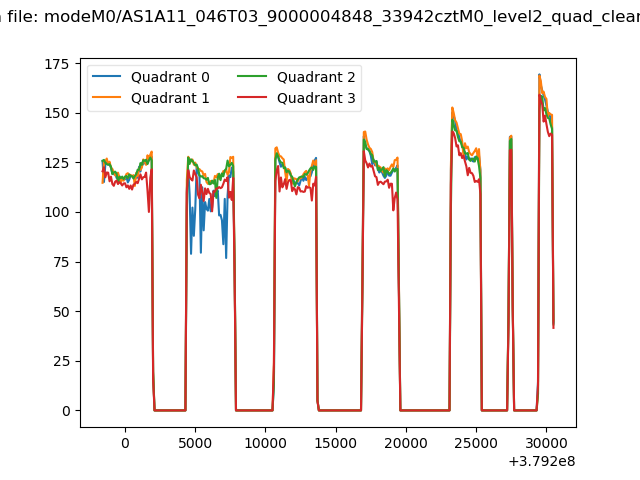 |
|
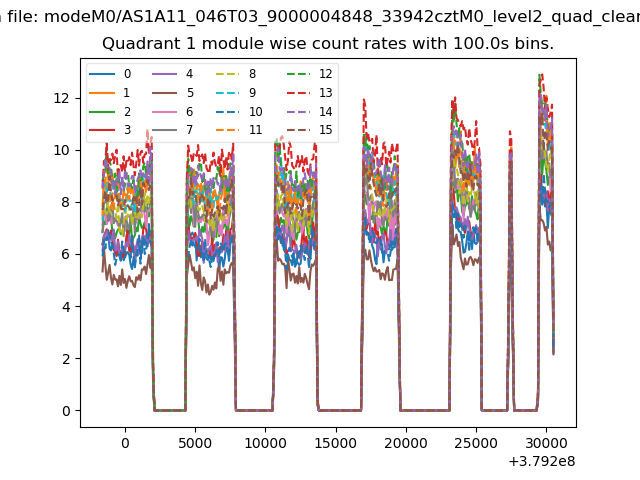
| Module-wise count rates for Quadrant A Data is divided into 100 sec bins |
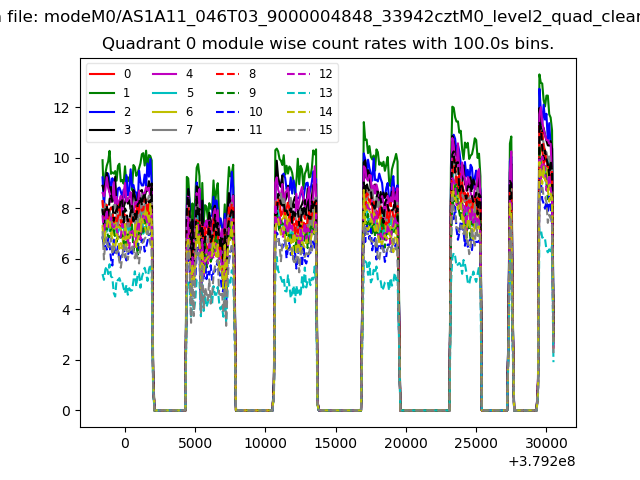 |
 |
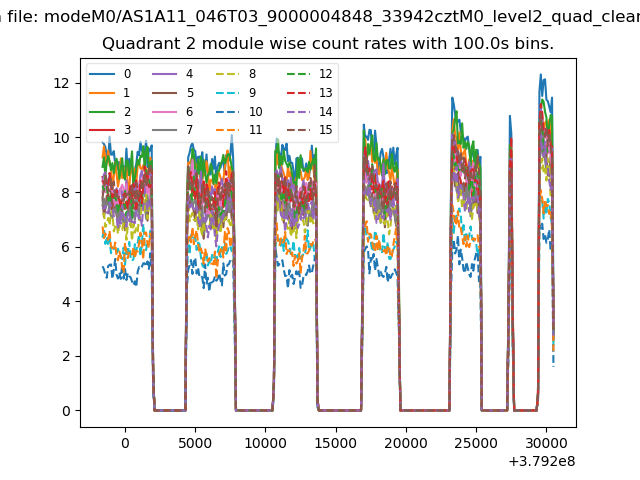
| Module-wise count rates for Quadrant B Data is divided into 100 sec bins |
 |
 |
| Module-wise count rates for Quadrant C Data is divided into 100 sec bins |
 |
 |
| Module-wise count rates for Quadrant D Data is divided into 100 sec bins |
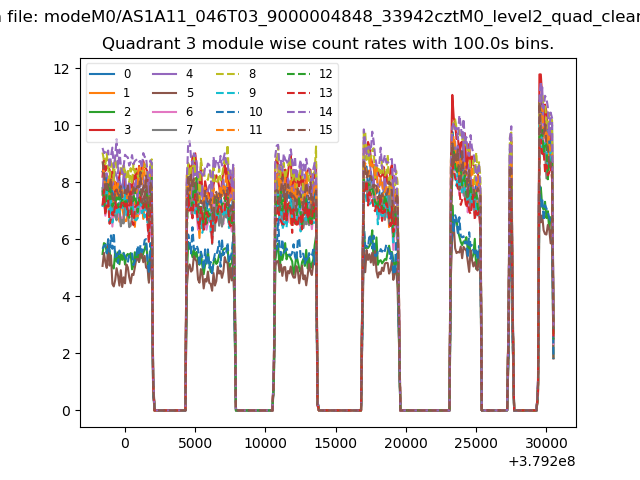 |
 |
| Parameter | Plot |
|---|---|
| CZT HV Monitor | 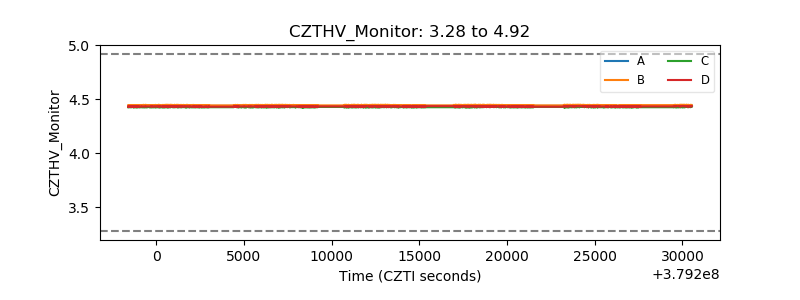 |
| D_VDD | 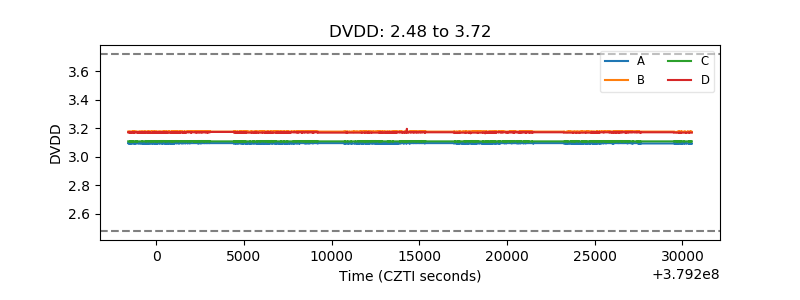 |
| Temperature 1 | 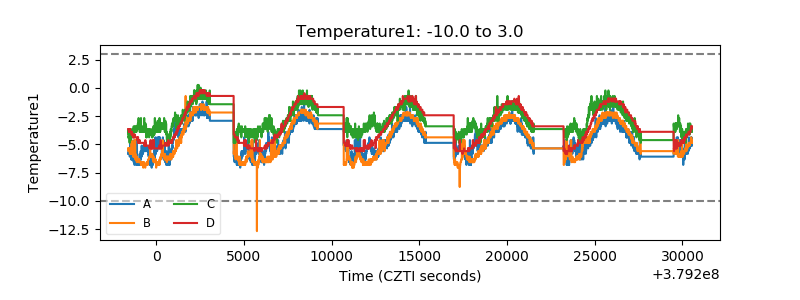 |
| Veto HV Monitor |  |
| Veto LLD | 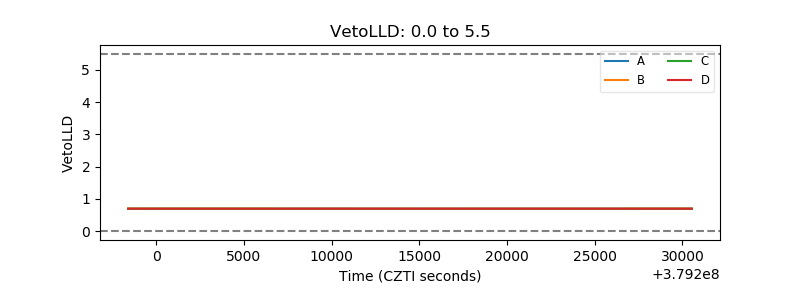 |
| Alpha Counter | 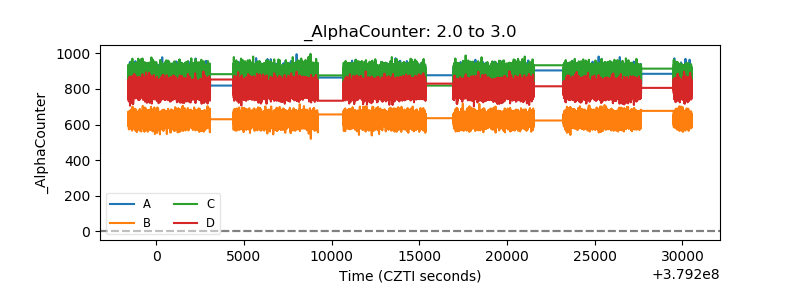 |
| _CPM_Rate | 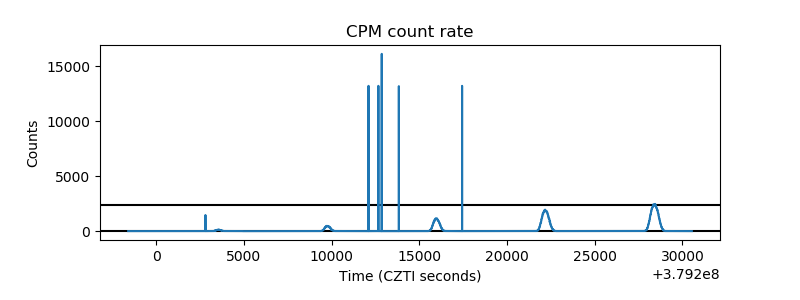 |
| CZT Counter | 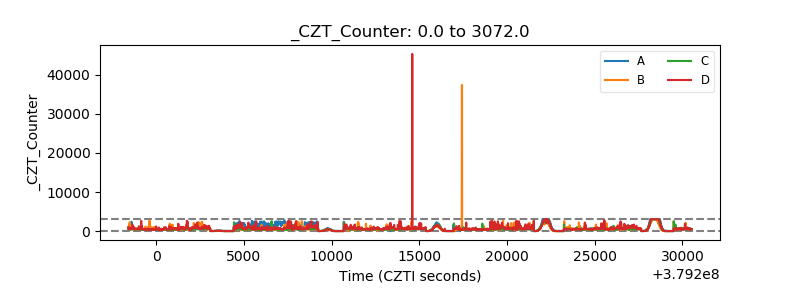 |
| +2.5 Volts monitor | 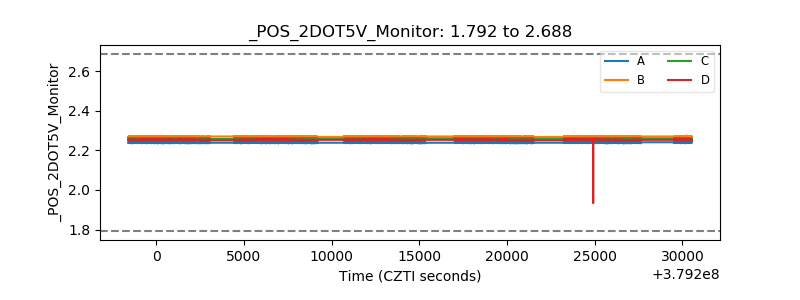 |
| +5 Volts monitor |  |
| _ROLL_ROT | 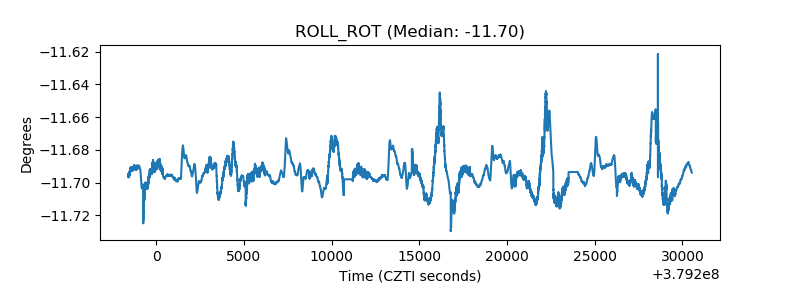 |
| _Roll_DEC | 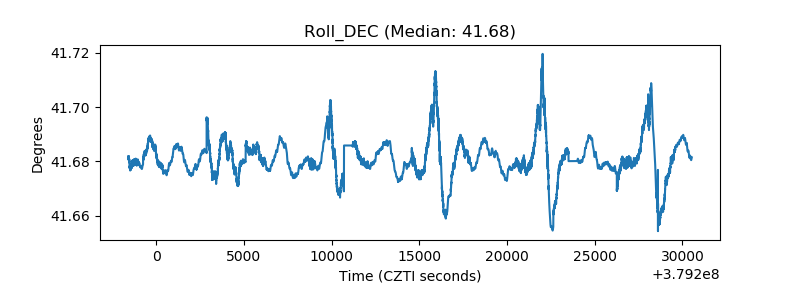 |
| _Roll_RA | 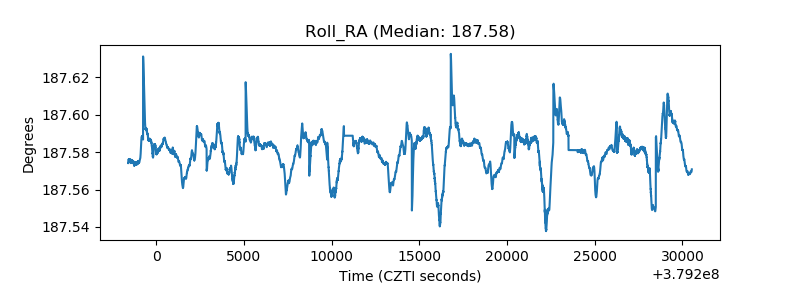 |
| Veto Counter | 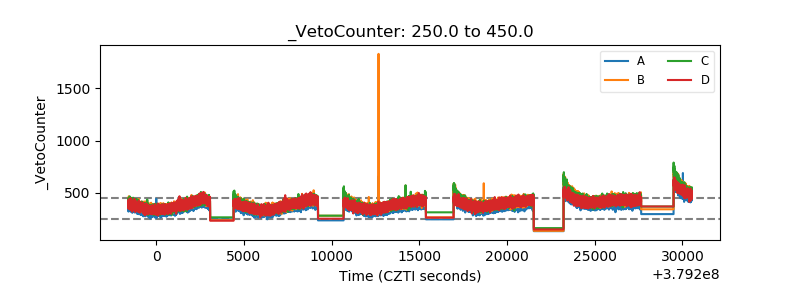 |