| Param | Original file | Final file |
|---|---|---|
| Filename | modeM0/AS1A11_046T03_9000004848_33943cztM0_level2.evt | modeM0/AS1A11_046T03_9000004848_33943cztM0_level2_quad_clean.evt |
| Size (bytes) | 447,174,720 | 74,459,520 |
| Size | 426.5 MB | 71.0 MB |
| Events in quadrant A | 2,582,521 | 488,258 |
| Events in quadrant B | 3,239,567 | 489,072 |
| Events in quadrant C | 3,180,233 | 471,860 |
| Events in quadrant D | 4,188,507 | 442,429 |
| Mode SS | |||
|---|---|---|---|
| Quadrant | BADHDUFLAG | Total packets | Discarded packets |
| A | 0 | 106 | 0 |
| B | 0 | 106 | 0 |
| C | 0 | 106 | 0 |
| D | 0 | 106 | 0 |
| Mode M9 | |||
|---|---|---|---|
| Quadrant | BADHDUFLAG | Total packets | Discarded packets |
| A | 0 | 28 | 0 |
| B | 0 | 28 | 0 |
| C | 0 | 28 | 0 |
| D | 0 | 29 | 0 |
| Mode M0 | |||
|---|---|---|---|
| Quadrant | BADHDUFLAG | Total packets | Discarded packets |
| A | 0 | 10573 | 3 |
| B | 0 | 12677 | 2 |
| C | 0 | 12594 | 2 |
| D | 0 | 15893 | 2 |
| Quadrant | Total seconds | Saturated seconds | Saturation percentage |
|---|---|---|---|
| A | 5181 | 5 | 0.096506% |
| B | 5181 | 157 | 3.030303% |
| C | 5181 | 82 | 1.582706% |
| D | 5181 | 410 | 7.913530% |
Noise dominated data is calculated using 1-second bins in cleaned event files. If a bin has >2000 counts, and if more than 50% of those come from <1% of pixels, then it is considered to be noise-dominated and hence unusable.
| Quadrant | # 1 sec bins | Bins with >0 counts | Bins with >2000 counts | High rate bins dominated by noise | Noise dominated (total time) | Noise dominated (detector-on time) | Marked lightcurve |
|---|---|---|---|---|---|---|---|
| A | 7155 | 5182 | 0 | 0 | 0.00% | 0.00% | 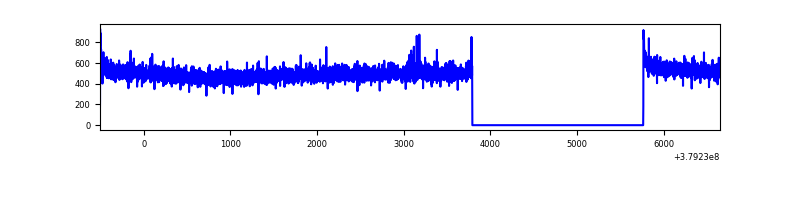 |
| B | 7155 | 5182 | 98 | 98 | 1.37% | 1.89% | 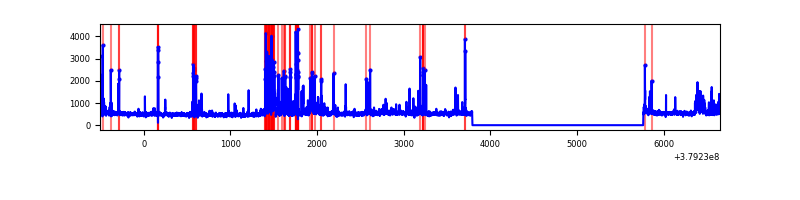 |
| C | 7155 | 5182 | 62 | 62 | 0.87% | 1.20% | 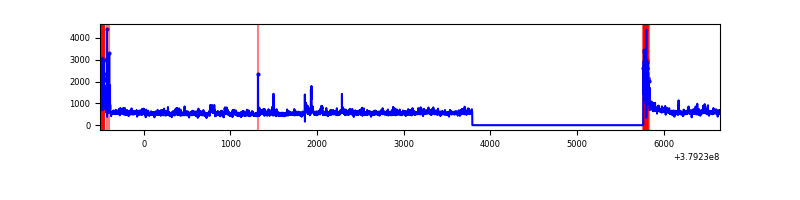 |
| D | 7155 | 5182 | 329 | 329 | 4.60% | 6.35% | 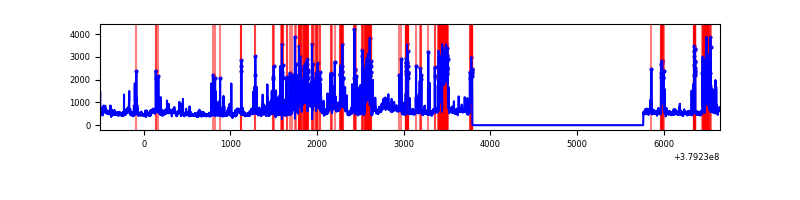 |
Top three noisy pixels from each quadrant. If the there are fewer than three noisy pixels in the level2.evt file, extra rows are filled as -1
| Pixel properties | Quadrant properties | ||||||
|---|---|---|---|---|---|---|---|
| Quadrant | DetID | PixID | Counts | Sigma | Mean | Median | Sigma |
| A | 10 | 83 | 14222 | 103.66 | 661 | 650 | 130.9 |
| A | 13 | 6 | 9672 | 68.91 | 661 | 650 | 130.9 |
| A | 13 | 254 | 8388 | 59.1 | 661 | 650 | 130.9 |
| B | 5 | 172 | 581900 | 4834.85 | 643 | 632 | 120.2 |
| B | 4 | 81 | 30458 | 248.09 | 643 | 632 | 120.2 |
| B | 4 | 251 | 26678 | 216.64 | 643 | 632 | 120.2 |
| C | 0 | 10 | 259289 | 1812.23 | 626 | 632 | 142.7 |
| C | 15 | 214 | 225138 | 1572.96 | 626 | 632 | 142.7 |
| C | 3 | 233 | 132391 | 923.15 | 626 | 632 | 142.7 |
| D | 8 | 230 | 477441 | 3196.16 | 619 | 604 | 149.2 |
| D | 8 | 195 | 333326 | 2230.18 | 619 | 604 | 149.2 |
| D | 13 | 249 | 245635 | 1642.4 | 619 | 604 | 149.2 |
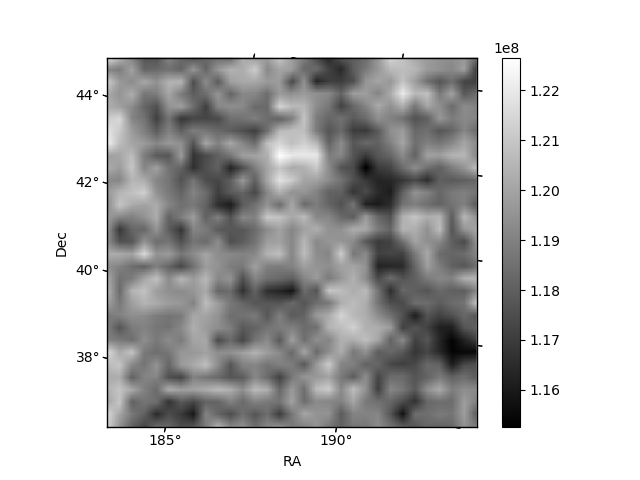
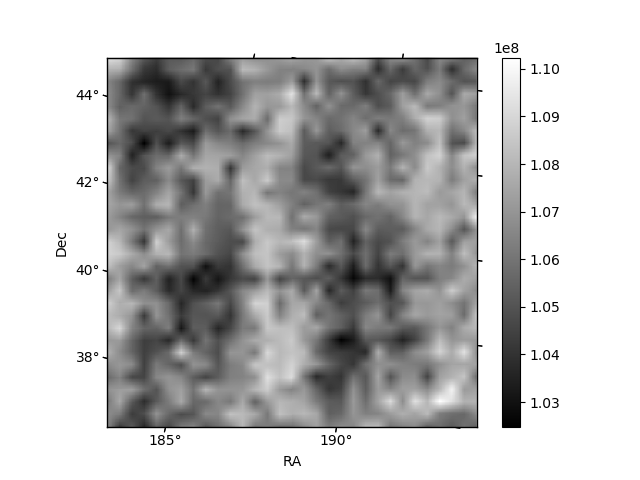
Histogram calculated using DETX and DETY for each event in the final _common_clean file
| Quadrant A | 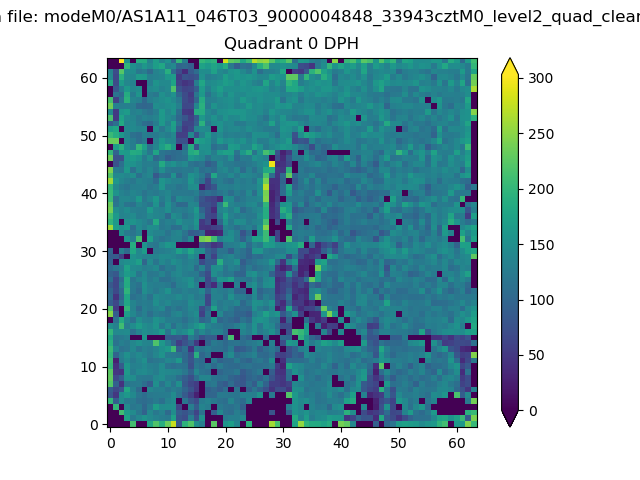 |
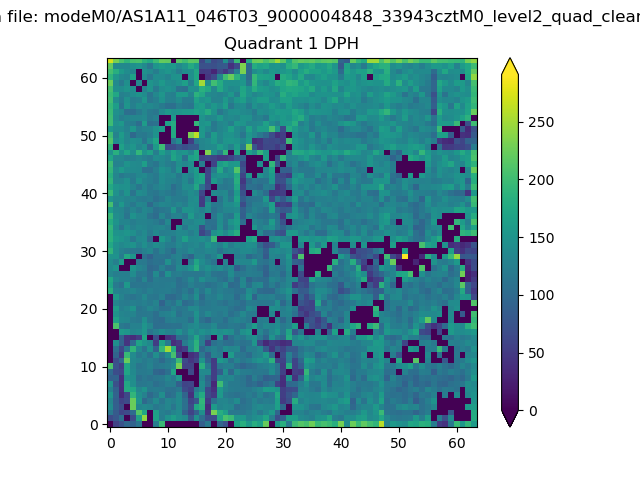 |
Quadrant B |
|---|---|---|---|
| Quadrant D | 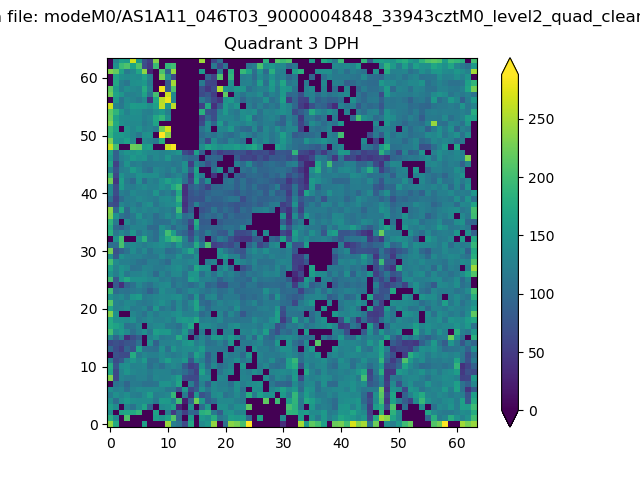 |
 |
Quadrant C |
| Plot type | Count rate plots | Images |
|---|---|---|
| Comparison with Poisson distribution Blue bars denote a histogram of data divided into 1 sec bins. Red curve is a Poisson curve with rate = median count rate of data. |
 |
 |
| Quadrant-wise count rates Data is divided into 100 sec bins |
 |
|
| Module-wise count rates for Quadrant A Data is divided into 100 sec bins |
 |
 |
| Module-wise count rates for Quadrant B Data is divided into 100 sec bins |
 |
 |
| Module-wise count rates for Quadrant C Data is divided into 100 sec bins |
 |
 |
| Module-wise count rates for Quadrant D Data is divided into 100 sec bins |
 |
 |
| Parameter | Plot |
|---|---|
| CZT HV Monitor |  |
| D_VDD | 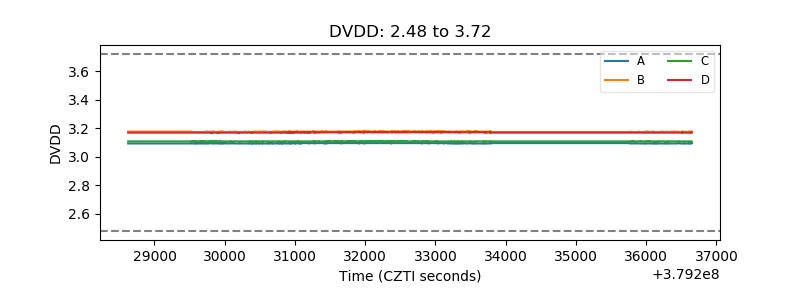 |
| Temperature 1 | 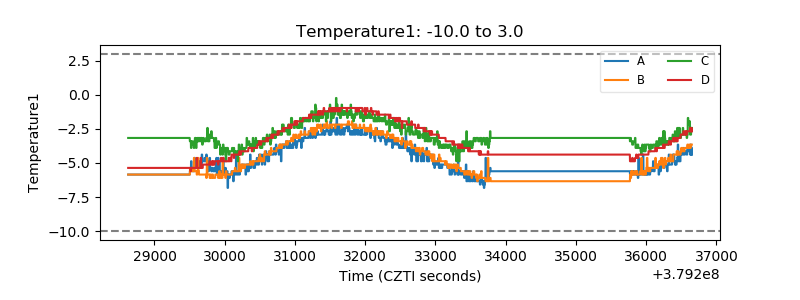 |
| Veto HV Monitor |  |
| Veto LLD |  |
| Alpha Counter |  |
| _CPM_Rate |  |
| CZT Counter |  |
| +2.5 Volts monitor |  |
| +5 Volts monitor |  |
| _ROLL_ROT |  |
| _Roll_DEC |  |
| _Roll_RA |  |
| Veto Counter |  |