| Param | Original file | Final file |
|---|---|---|
| Filename | modeM0/AS1A11_046T03_9000004848_33944cztM0_level2.evt | modeM0/AS1A11_046T03_9000004848_33944cztM0_level2_quad_clean.evt |
| Size (bytes) | 492,629,760 | 71,884,800 |
| Size | 469.8 MB | 68.6 MB |
| Events in quadrant A | 2,565,226 | 477,281 |
| Events in quadrant B | 3,530,042 | 467,817 |
| Events in quadrant C | 3,410,821 | 456,453 |
| Events in quadrant D | 5,075,828 | 425,974 |
| Mode SS | |||
|---|---|---|---|
| Quadrant | BADHDUFLAG | Total packets | Discarded packets |
| A | 0 | 100 | 0 |
| B | 0 | 100 | 0 |
| C | 0 | 100 | 0 |
| D | 0 | 100 | 0 |
| Mode M9 | |||
|---|---|---|---|
| Quadrant | BADHDUFLAG | Total packets | Discarded packets |
| A | 0 | 28 | 0 |
| B | 0 | 28 | 0 |
| C | 0 | 28 | 0 |
| D | 0 | 29 | 0 |
| Mode M0 | |||
|---|---|---|---|
| Quadrant | BADHDUFLAG | Total packets | Discarded packets |
| A | 0 | 10279 | 3 |
| B | 0 | 13408 | 2 |
| C | 0 | 13563 | 2 |
| D | 0 | 18459 | 2 |
| Quadrant | Total seconds | Saturated seconds | Saturation percentage |
|---|---|---|---|
| A | 4983 | 2 | 0.040136% |
| B | 4983 | 309 | 6.201084% |
| C | 4983 | 93 | 1.866346% |
| D | 4983 | 684 | 13.726671% |
Noise dominated data is calculated using 1-second bins in cleaned event files. If a bin has >2000 counts, and if more than 50% of those come from <1% of pixels, then it is considered to be noise-dominated and hence unusable.
| Quadrant | # 1 sec bins | Bins with >0 counts | Bins with >2000 counts | High rate bins dominated by noise | Noise dominated (total time) | Noise dominated (detector-on time) | Marked lightcurve |
|---|---|---|---|---|---|---|---|
| A | 7046 | 4984 | 0 | 0 | 0.00% | 0.00% | 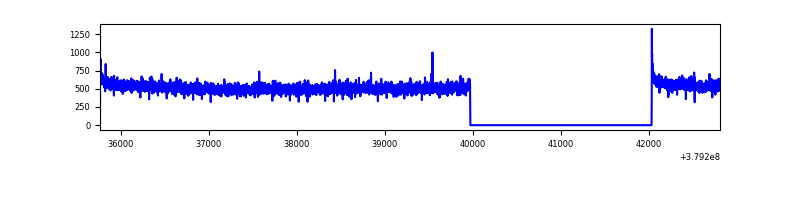 |
| B | 7046 | 4984 | 184 | 184 | 2.61% | 3.69% | 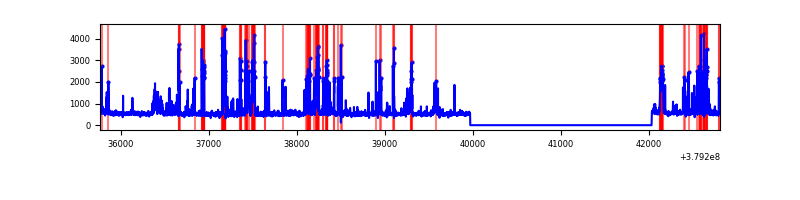 |
| C | 7046 | 4984 | 68 | 68 | 0.97% | 1.36% | 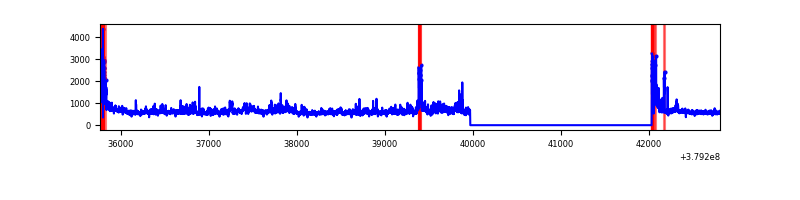 |
| D | 7046 | 4984 | 595 | 595 | 8.44% | 11.94% | 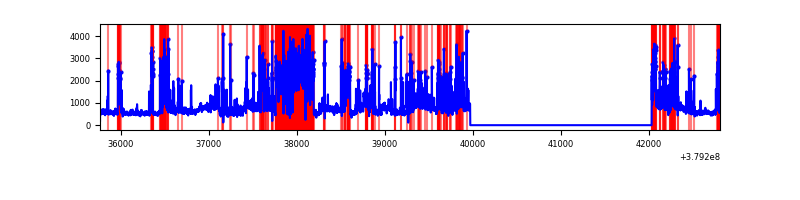 |
Top three noisy pixels from each quadrant. If the there are fewer than three noisy pixels in the level2.evt file, extra rows are filled as -1
| Pixel properties | Quadrant properties | ||||||
|---|---|---|---|---|---|---|---|
| Quadrant | DetID | PixID | Counts | Sigma | Mean | Median | Sigma |
| A | 10 | 83 | 13961 | 101.75 | 658 | 646 | 130.9 |
| A | 13 | 6 | 8763 | 62.03 | 658 | 646 | 130.9 |
| A | 13 | 254 | 7473 | 52.17 | 658 | 646 | 130.9 |
| B | 5 | 172 | 920568 | 7786.27 | 628 | 614 | 118.2 |
| B | 15 | 35 | 41110 | 342.75 | 628 | 614 | 118.2 |
| B | 4 | 81 | 37551 | 312.63 | 628 | 614 | 118.2 |
| C | 0 | 10 | 342305 | 2417.21 | 621 | 625 | 141.4 |
| C | 15 | 214 | 217628 | 1535.18 | 621 | 625 | 141.4 |
| C | 14 | 67 | 191748 | 1352.09 | 621 | 625 | 141.4 |
| D | 8 | 230 | 1037864 | 7129.44 | 599 | 581 | 145.5 |
| D | 8 | 195 | 550178 | 3777.48 | 599 | 581 | 145.5 |
| D | 12 | 6 | 539833 | 3706.38 | 599 | 581 | 145.5 |
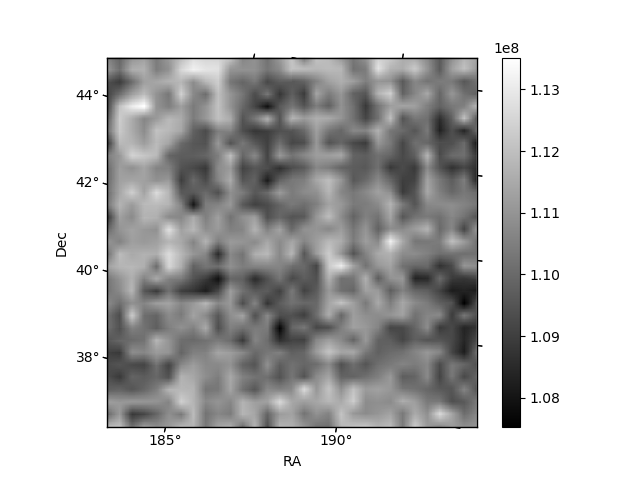
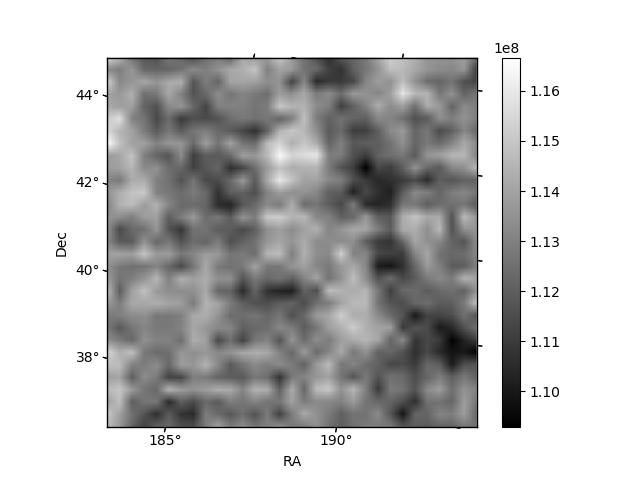
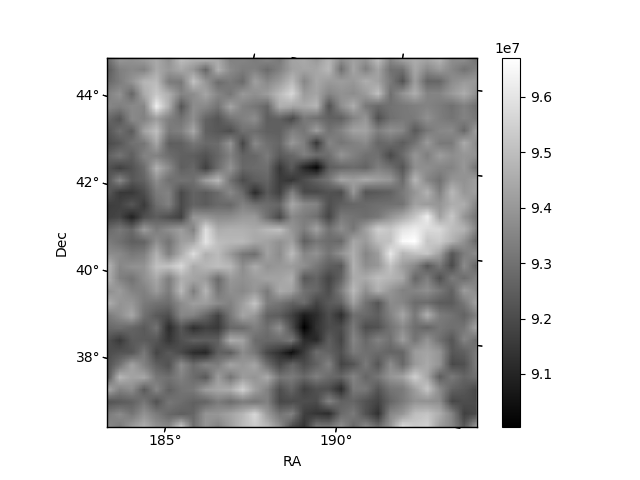
Histogram calculated using DETX and DETY for each event in the final _common_clean file
| Quadrant A | 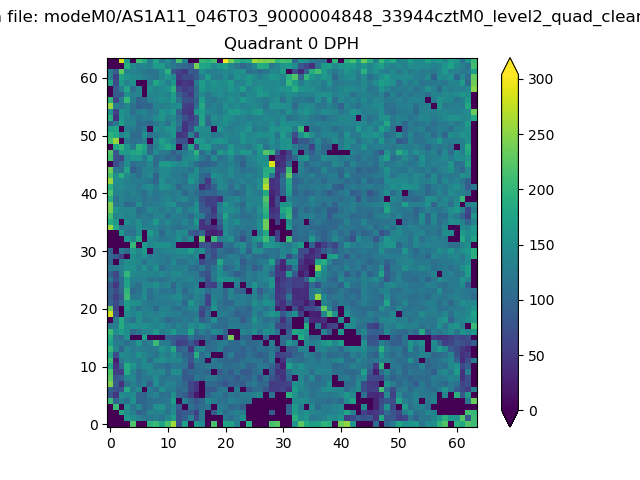 |
 |
Quadrant B |
|---|---|---|---|
| Quadrant D | 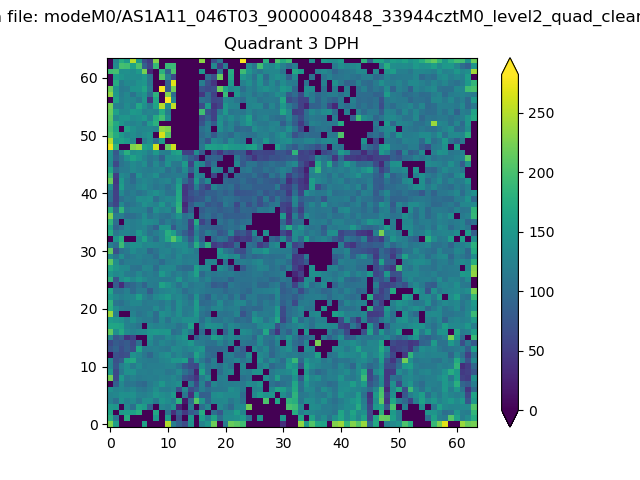 |
 |
Quadrant C |
| Plot type | Count rate plots | Images |
|---|---|---|
| Comparison with Poisson distribution Blue bars denote a histogram of data divided into 1 sec bins. Red curve is a Poisson curve with rate = median count rate of data. |
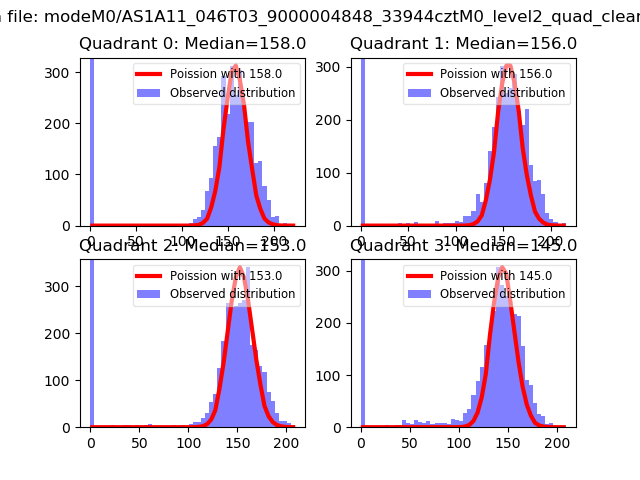 |
 |
| Quadrant-wise count rates Data is divided into 100 sec bins |
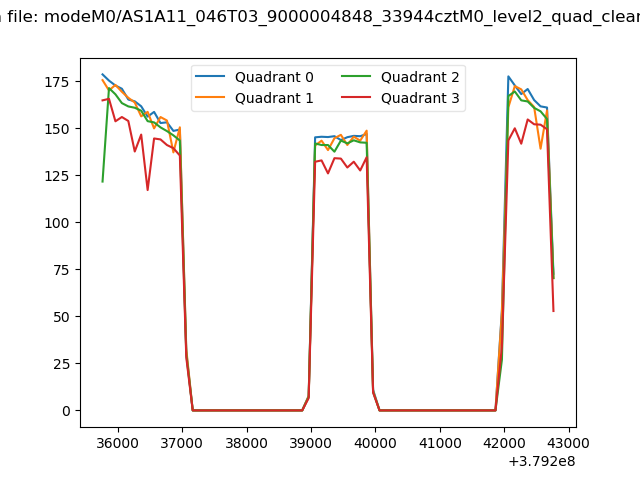 |
|
| Module-wise count rates for Quadrant A Data is divided into 100 sec bins |
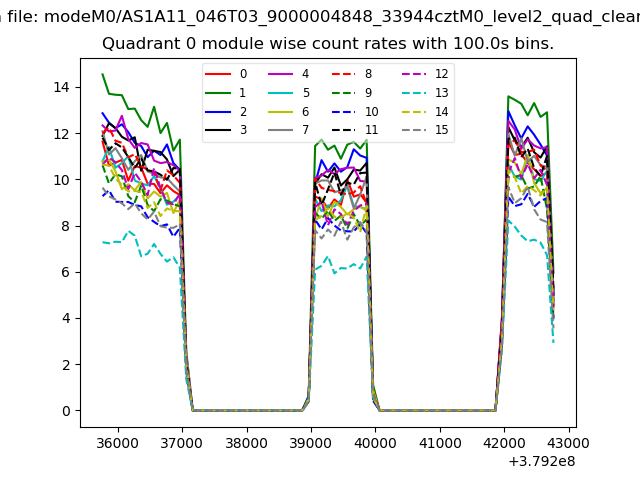 |
 |
| Module-wise count rates for Quadrant B Data is divided into 100 sec bins |
 |
 |
| Module-wise count rates for Quadrant C Data is divided into 100 sec bins |
 |
 |
| Module-wise count rates for Quadrant D Data is divided into 100 sec bins |
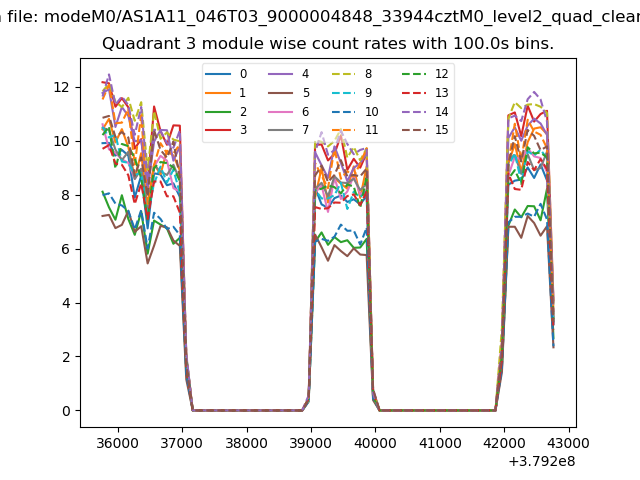 |
 |
| Parameter | Plot |
|---|---|
| CZT HV Monitor | 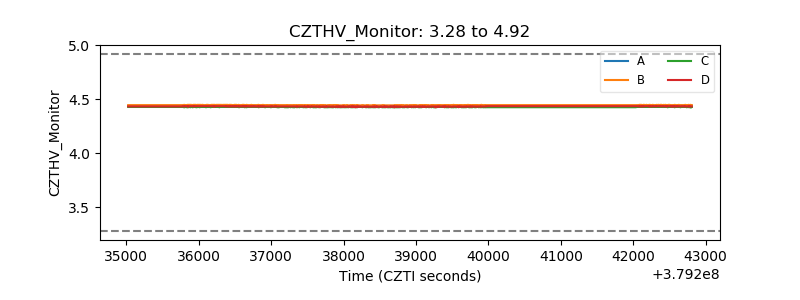 |
| D_VDD | 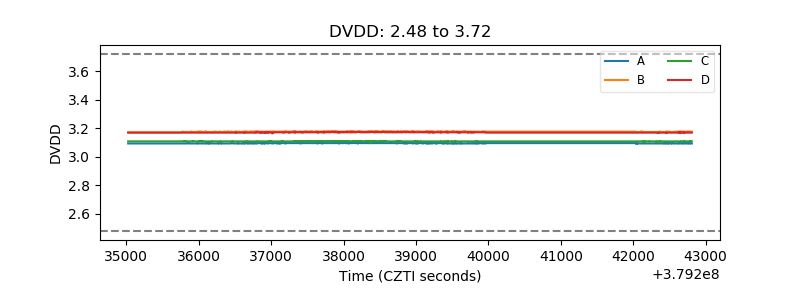 |
| Temperature 1 | 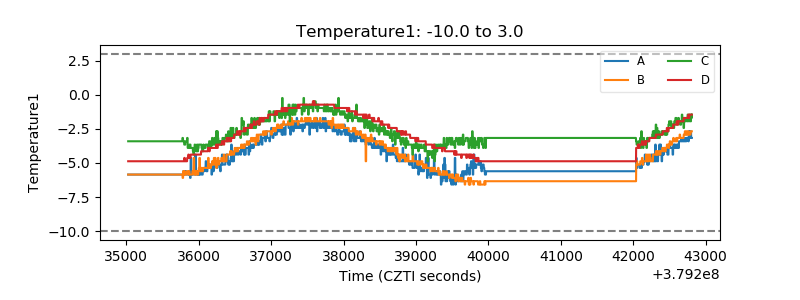 |
| Veto HV Monitor | 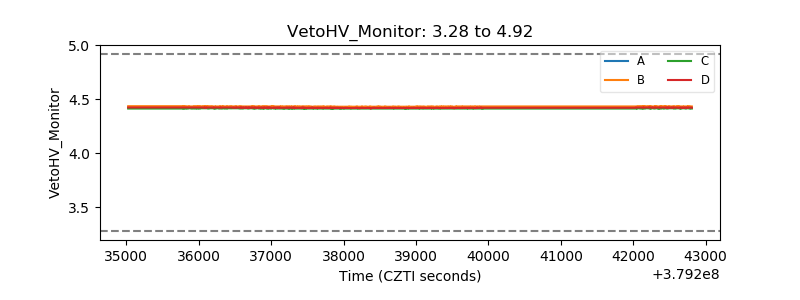 |
| Veto LLD | 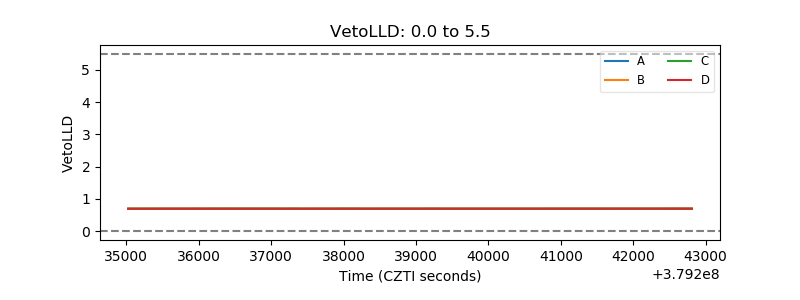 |
| Alpha Counter |  |
| _CPM_Rate | 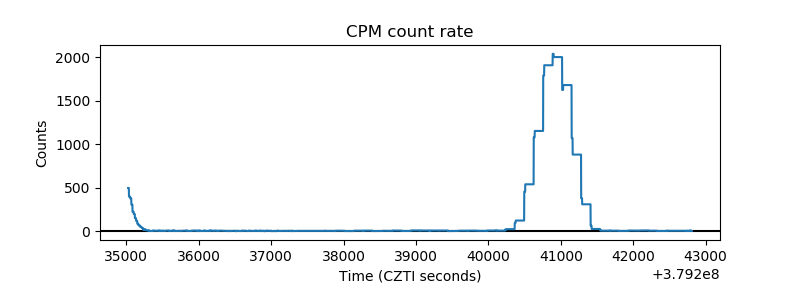 |
| CZT Counter | 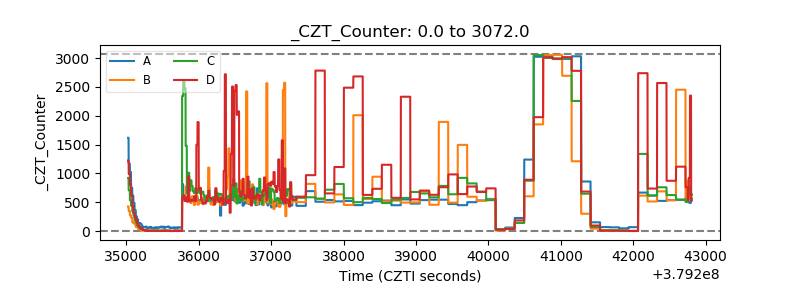 |
| +2.5 Volts monitor | 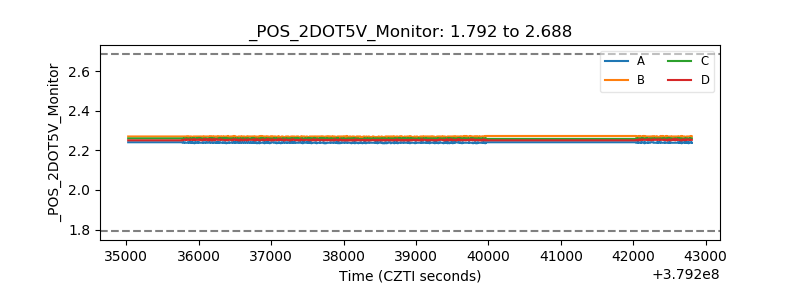 |
| +5 Volts monitor |  |
| _ROLL_ROT | 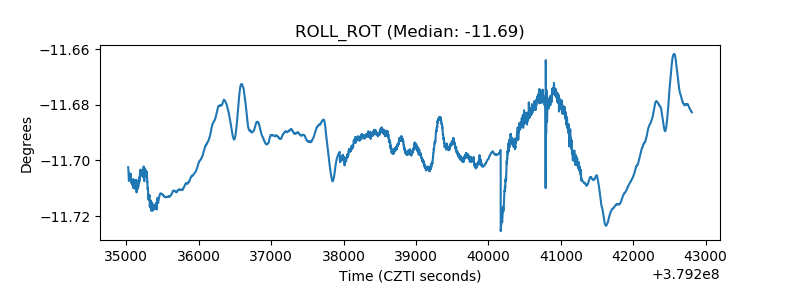 |
| _Roll_DEC | 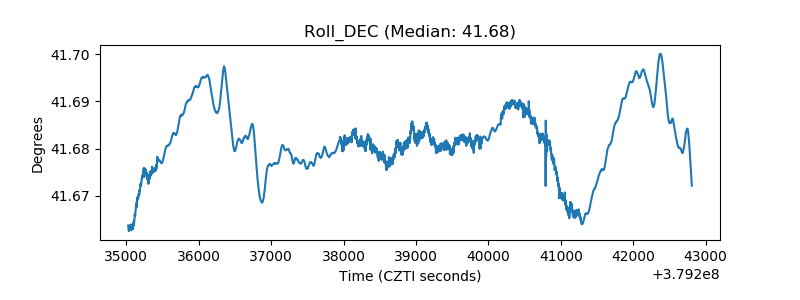 |
| _Roll_RA | 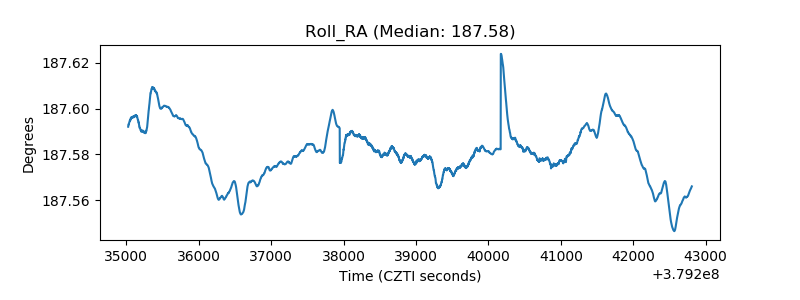 |
| Veto Counter | 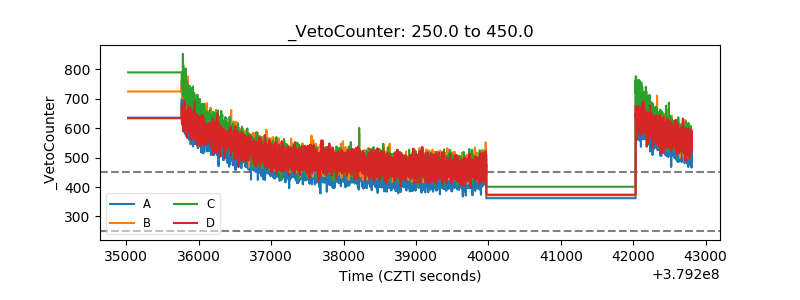 |