| Param | Original file | Final file |
|---|---|---|
| Filename | modeM0/AS1A11_046T03_9000004848_33945cztM0_level2.evt | modeM0/AS1A11_046T03_9000004848_33945cztM0_level2_quad_clean.evt |
| Size (bytes) | 355,164,480 | 50,290,560 |
| Size | 338.7 MB | 48.0 MB |
| Events in quadrant A | 2,056,634 | 321,477 |
| Events in quadrant B | 2,680,513 | 314,296 |
| Events in quadrant C | 2,486,024 | 311,846 |
| Events in quadrant D | 3,256,949 | 288,757 |
| Mode SS | |||
|---|---|---|---|
| Quadrant | BADHDUFLAG | Total packets | Discarded packets |
| A | 0 | 80 | 0 |
| B | 0 | 80 | 0 |
| C | 0 | 80 | 0 |
| D | 0 | 80 | 0 |
| Mode M9 | |||
|---|---|---|---|
| Quadrant | BADHDUFLAG | Total packets | Discarded packets |
| A | 0 | 6 | 0 |
| B | 0 | 6 | 0 |
| C | 0 | 6 | 0 |
| D | 0 | 7 | 0 |
| Mode M0 | |||
|---|---|---|---|
| Quadrant | BADHDUFLAG | Total packets | Discarded packets |
| A | 0 | 8319 | 1 |
| B | 0 | 10332 | 1 |
| C | 0 | 9852 | 1 |
| D | 0 | 12329 | 1 |
| Quadrant | Total seconds | Saturated seconds | Saturation percentage |
|---|---|---|---|
| A | 4059 | 5 | 0.123183% |
| B | 4059 | 156 | 3.843311% |
| C | 4059 | 36 | 0.886918% |
| D | 4059 | 231 | 5.691057% |
Noise dominated data is calculated using 1-second bins in cleaned event files. If a bin has >2000 counts, and if more than 50% of those come from <1% of pixels, then it is considered to be noise-dominated and hence unusable.
| Quadrant | # 1 sec bins | Bins with >0 counts | Bins with >2000 counts | High rate bins dominated by noise | Noise dominated (total time) | Noise dominated (detector-on time) | Marked lightcurve |
|---|---|---|---|---|---|---|---|
| A | 4059 | 4059 | 0 | 0 | 0.00% | 0.00% | 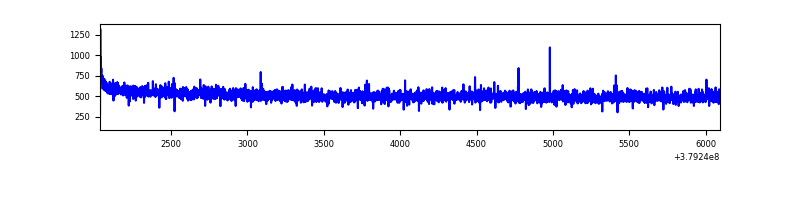 |
| B | 4059 | 4059 | 104 | 104 | 2.56% | 2.56% |  |
| C | 4059 | 4059 | 27 | 27 | 0.67% | 0.67% | 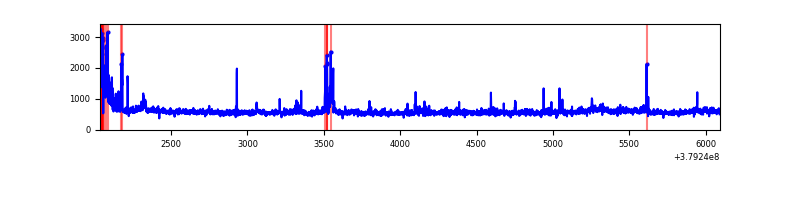 |
| D | 4059 | 4059 | 191 | 191 | 4.71% | 4.71% | 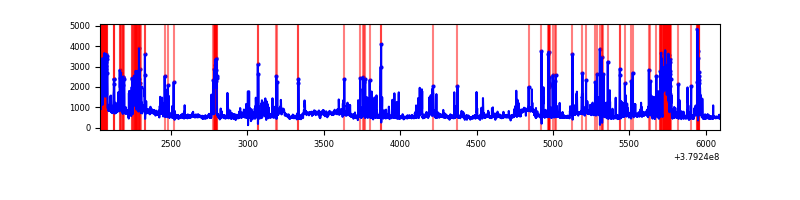 |
Top three noisy pixels from each quadrant. If the there are fewer than three noisy pixels in the level2.evt file, extra rows are filled as -1
| Pixel properties | Quadrant properties | ||||||
|---|---|---|---|---|---|---|---|
| Quadrant | DetID | PixID | Counts | Sigma | Mean | Median | Sigma |
| A | 10 | 83 | 7682 | 68.06 | 528 | 519 | 105.2 |
| A | 13 | 6 | 7469 | 66.04 | 528 | 519 | 105.2 |
| A | 13 | 254 | 6220 | 54.17 | 528 | 519 | 105.2 |
| B | 5 | 172 | 495278 | 5195.98 | 509 | 498 | 95.2 |
| B | 0 | 190 | 62684 | 653.05 | 509 | 498 | 95.2 |
| B | 15 | 35 | 53946 | 561.29 | 509 | 498 | 95.2 |
| C | 15 | 214 | 176170 | 1533.27 | 503 | 508 | 114.6 |
| C | 3 | 233 | 172528 | 1501.49 | 503 | 508 | 114.6 |
| C | 0 | 10 | 142574 | 1240.03 | 503 | 508 | 114.6 |
| D | 12 | 6 | 430079 | 3250.73 | 500 | 488 | 132.2 |
| D | 8 | 195 | 324938 | 2455.13 | 500 | 488 | 132.2 |
| D | 13 | 249 | 250966 | 1895.38 | 500 | 488 | 132.2 |
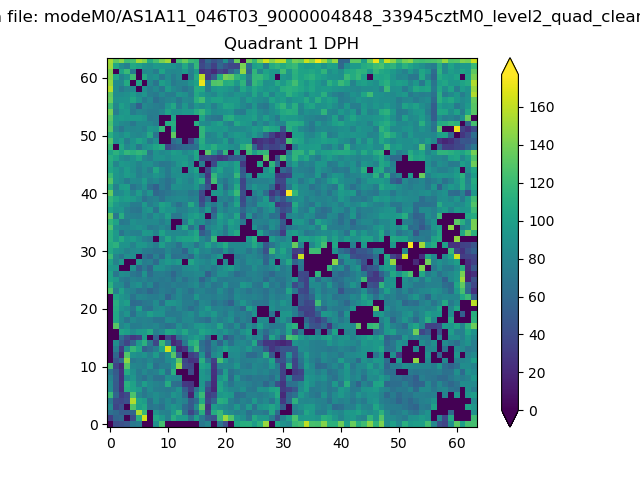
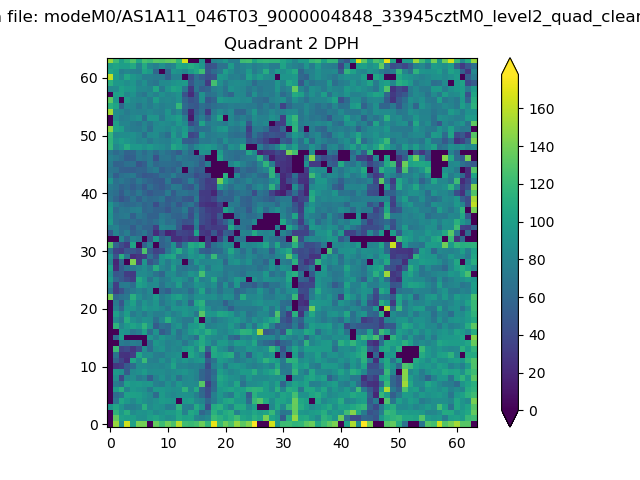
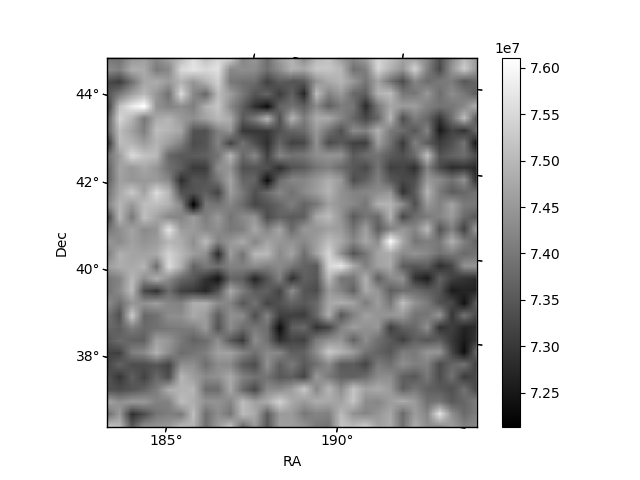
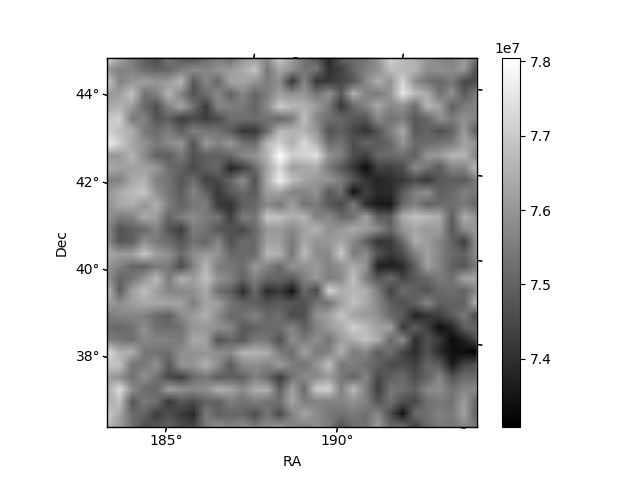
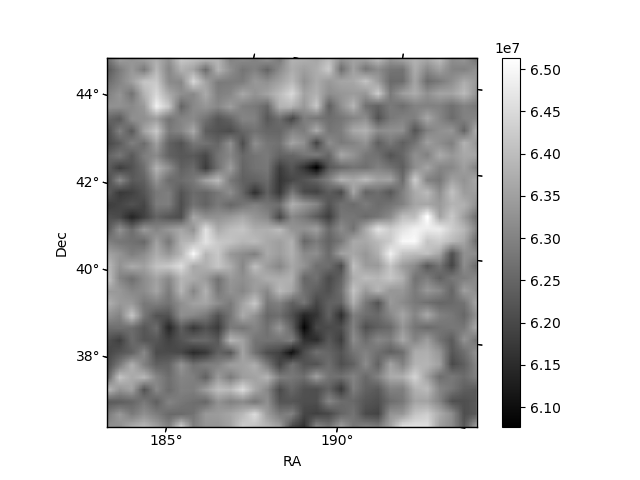
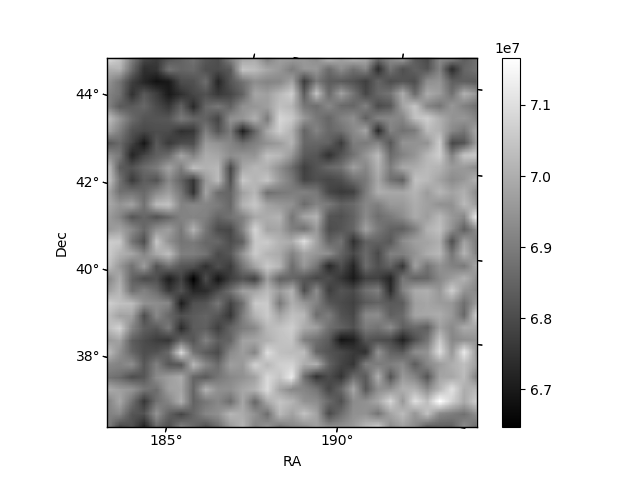
Histogram calculated using DETX and DETY for each event in the final _common_clean file
| Quadrant A | 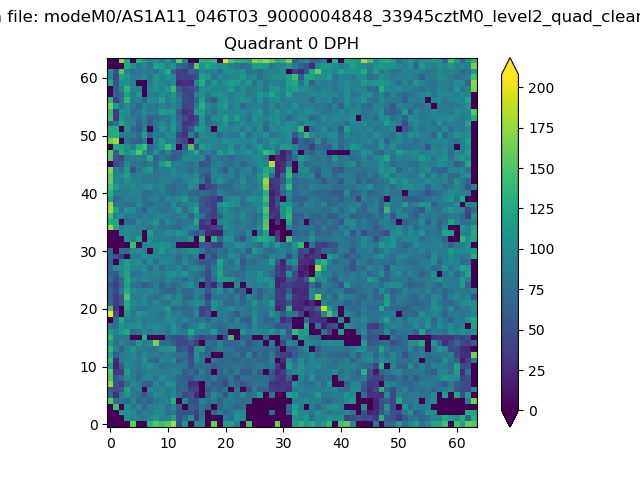 |
 |
Quadrant B |
|---|---|---|---|
| Quadrant D | 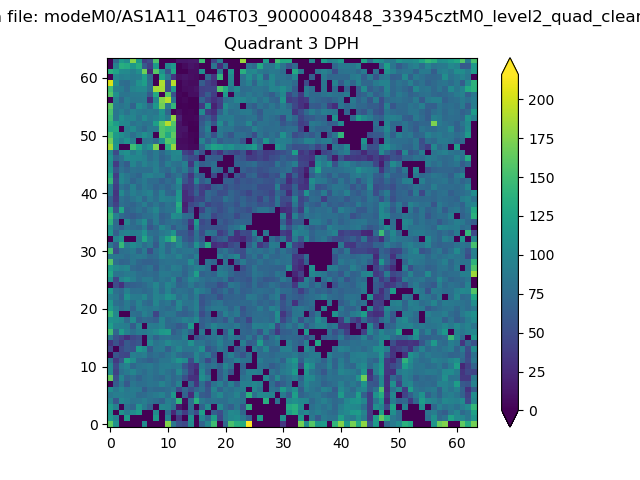 |
 |
Quadrant C |
| Plot type | Count rate plots | Images |
|---|---|---|
| Comparison with Poisson distribution Blue bars denote a histogram of data divided into 1 sec bins. Red curve is a Poisson curve with rate = median count rate of data. |
 |
 |
| Quadrant-wise count rates Data is divided into 100 sec bins |
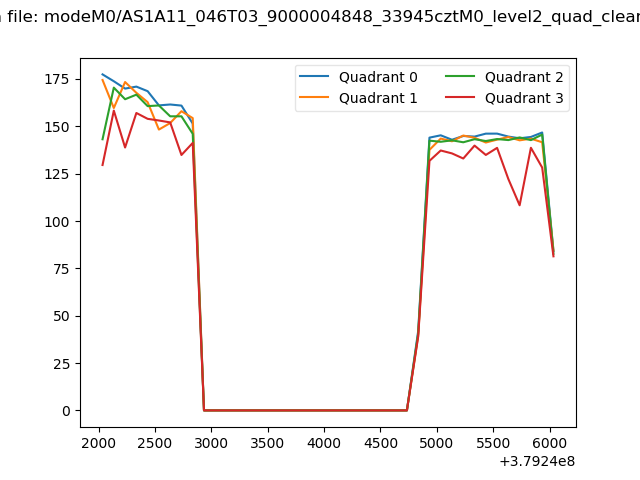 |
|
| Module-wise count rates for Quadrant A Data is divided into 100 sec bins |
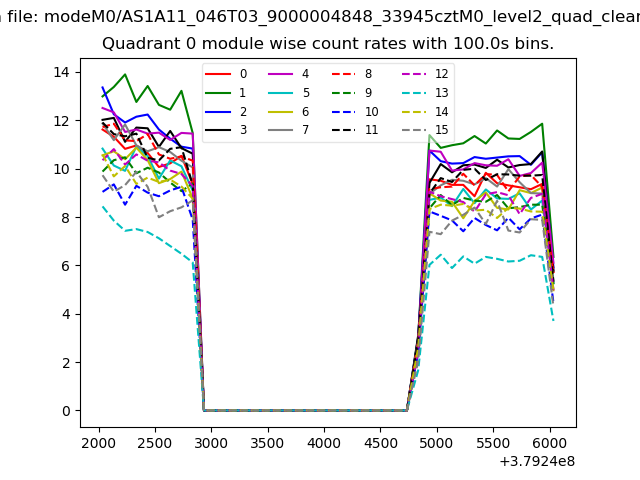 |
 |
| Module-wise count rates for Quadrant B Data is divided into 100 sec bins |
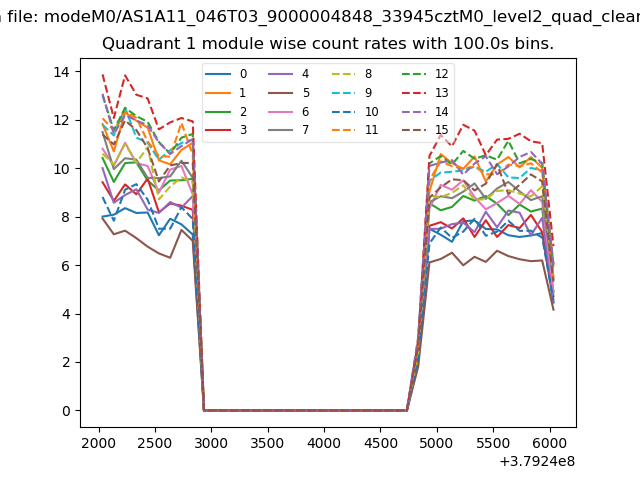 |
 |
| Module-wise count rates for Quadrant C Data is divided into 100 sec bins |
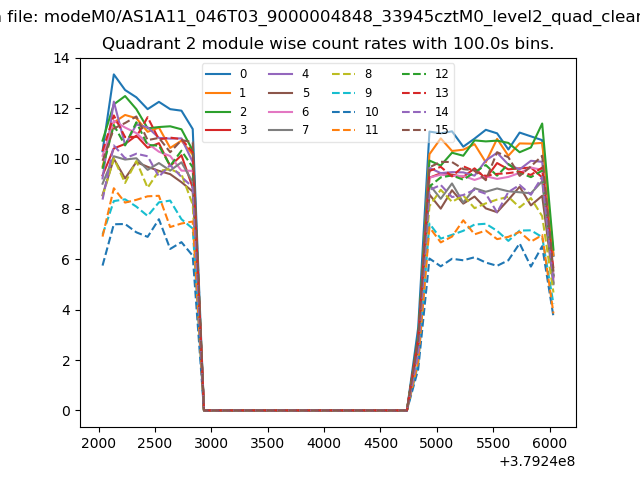 |
 |
| Module-wise count rates for Quadrant D Data is divided into 100 sec bins |
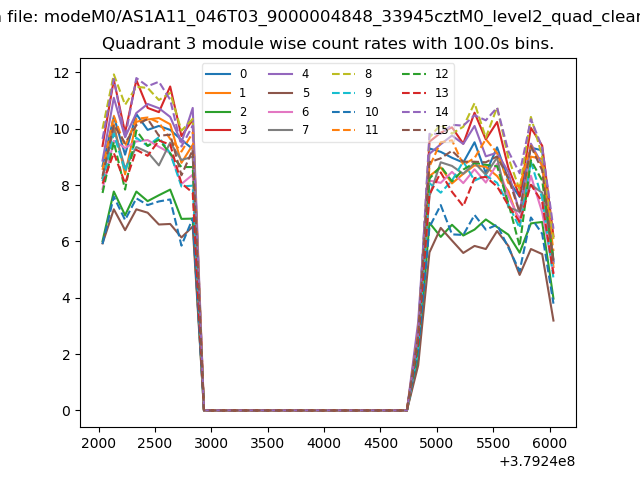 |
 |
| Parameter | Plot |
|---|---|
| CZT HV Monitor | 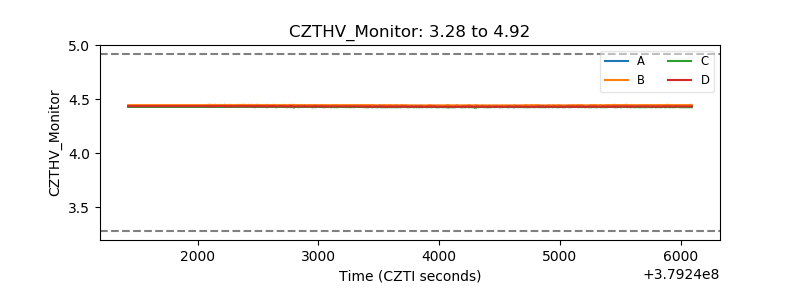 |
| D_VDD | 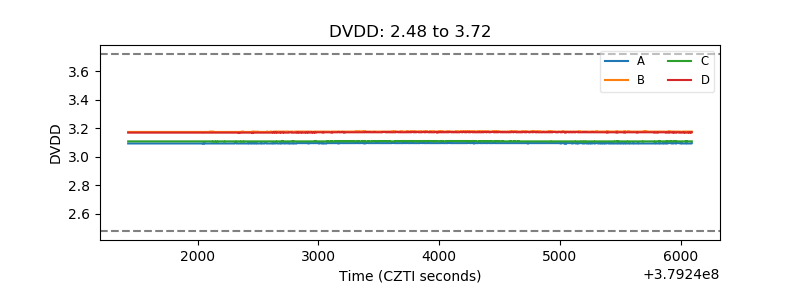 |
| Temperature 1 | 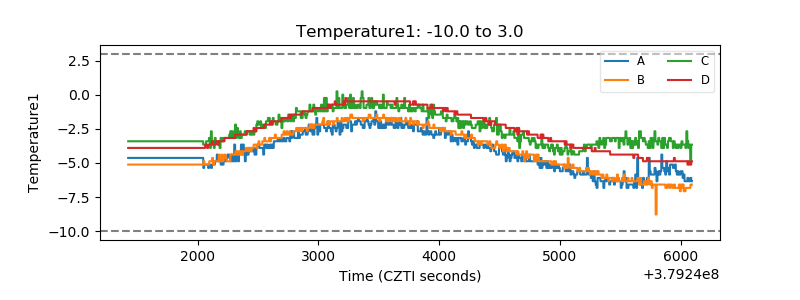 |
| Veto HV Monitor | 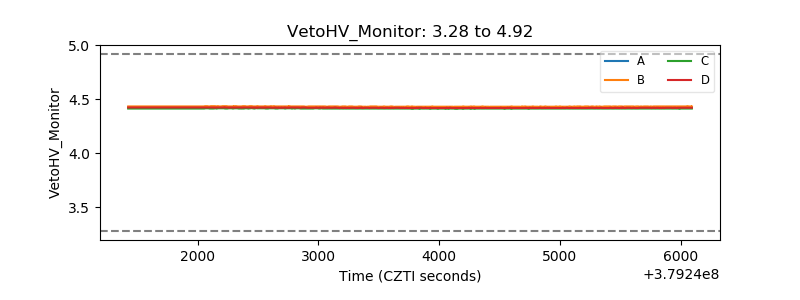 |
| Veto LLD | 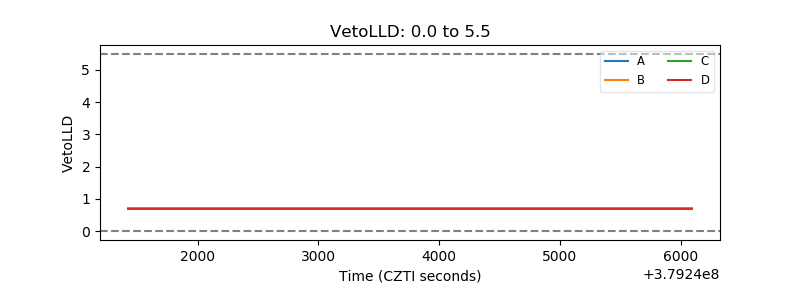 |
| Alpha Counter | 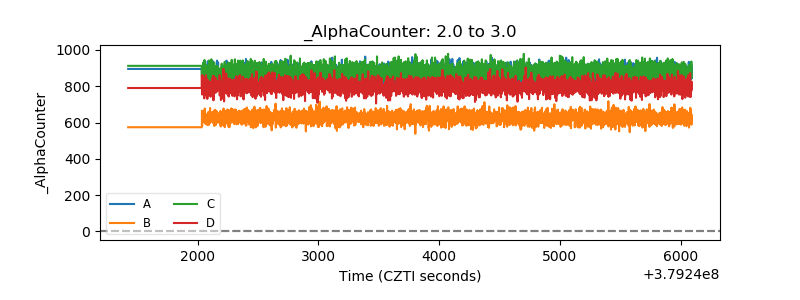 |
| _CPM_Rate | 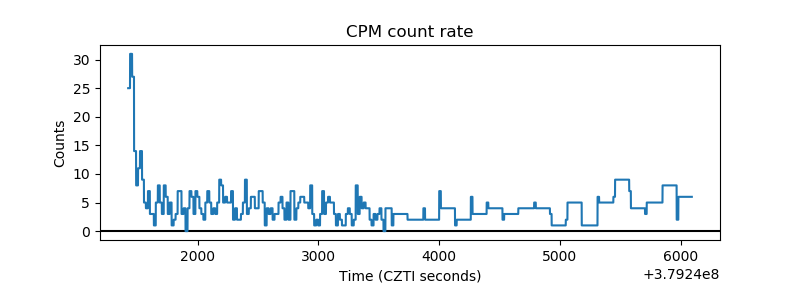 |
| CZT Counter | 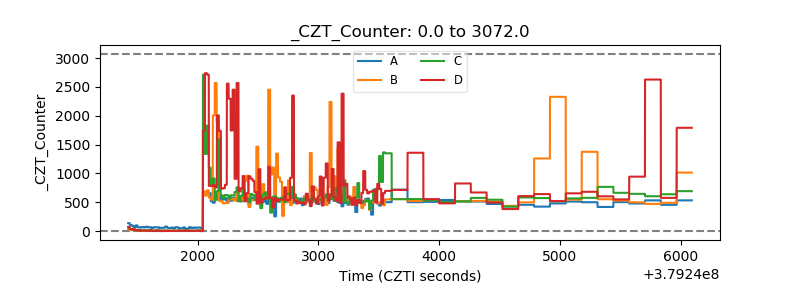 |
| +2.5 Volts monitor |  |
| +5 Volts monitor |  |
| _ROLL_ROT | 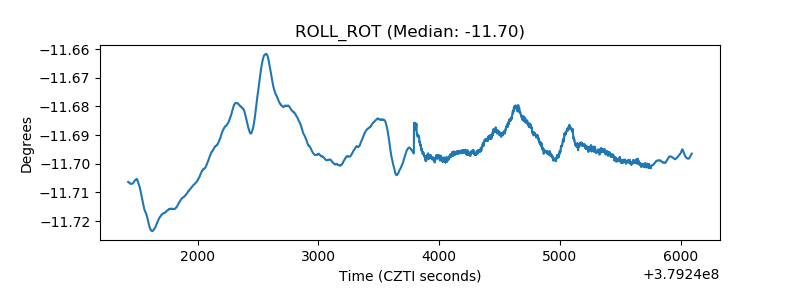 |
| _Roll_DEC | 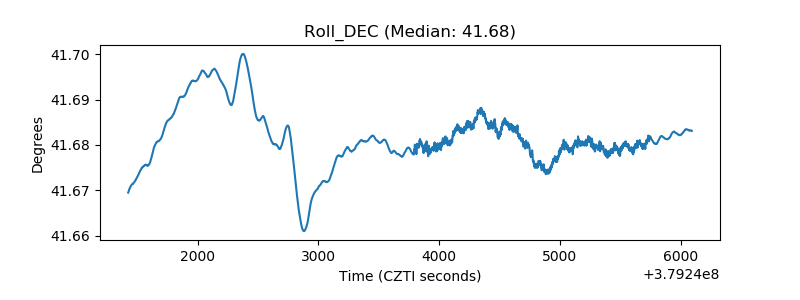 |
| _Roll_RA | 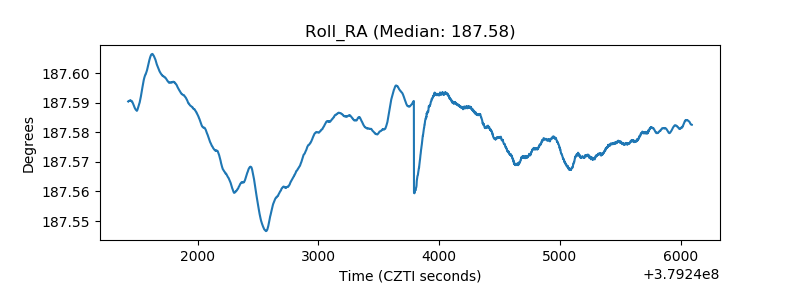 |
| Veto Counter | 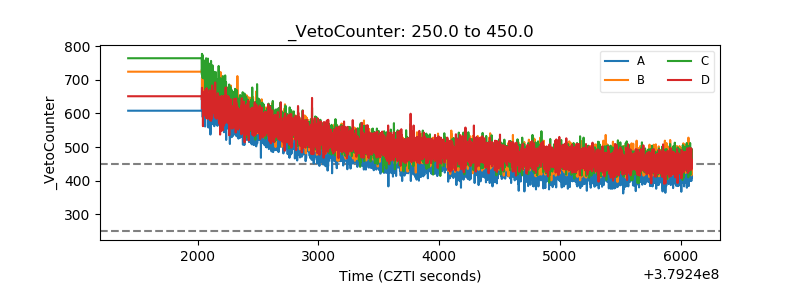 |