| Param | Original file | Final file |
|---|---|---|
| Filename | modeM0/AS1T04_088T01_9000004846cztM0_level2.fits | modeM0/AS1T04_088T01_9000004846cztM0_level2_quad_clean.evt |
| Size (bytes) | 445,250,880 | 348,419,520 |
| Size | 424.6 MB | 332.3 MB |
| Events in quadrant A | 2,699,254 | 1,770,687 |
| Events in quadrant B | 2,619,534 | 1,973,396 |
| Events in quadrant C | 2,696,436 | 1,919,607 |
| Events in quadrant D | 2,298,414 | 1,717,745 |
| Mode SS | |||
|---|---|---|---|
| Quadrant | BADHDUFLAG | Total packets | Discarded packets |
| A | 0 | 944 | 0 |
| B | 0 | 944 | 0 |
| C | 0 | 944 | 0 |
| D | 0 | 944 | 0 |
| Mode M9 | |||
|---|---|---|---|
| Quadrant | BADHDUFLAG | Total packets | Discarded packets |
| A | 0 | 184 | 0 |
| B | 0 | 184 | 0 |
| C | 0 | 184 | 0 |
| D | 0 | 184 | 0 |
| Mode M0 | |||
|---|---|---|---|
| Quadrant | BADHDUFLAG | Total packets | Discarded packets |
| A | 0 | 121528 | 0 |
| B | 0 | 113706 | 0 |
| C | 0 | 106312 | 0 |
| D | 0 | 157826 | 0 |
| Quadrant | Total seconds | Saturated seconds | Saturation percentage |
|---|---|---|---|
| A | 46157 | 3785 | 8.200273% |
| B | 46157 | 1480 | 3.206448% |
| C | 46157 | 732 | 1.585892% |
| D | 46157 | 2602 | 5.637281% |
Noise dominated data is calculated using 1-second bins in cleaned event files. If a bin has >2000 counts, and if more than 50% of those come from <1% of pixels, then it is considered to be noise-dominated and hence unusable.
| Quadrant | # 1 sec bins | Bins with >0 counts | Bins with >2000 counts | High rate bins dominated by noise | Noise dominated (total time) | Noise dominated (detector-on time) | Marked lightcurve |
|---|---|---|---|---|---|---|---|
| A | 64623 | 45525 | 0 | 0 | 0.00% | 0.00% | 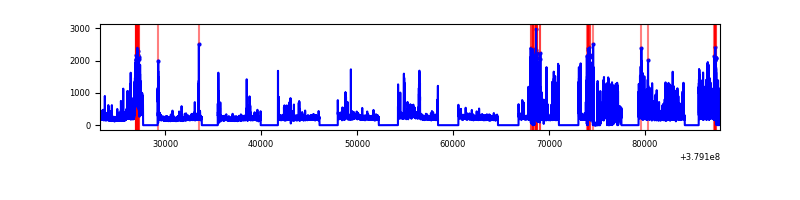 |
| B | 64624 | 46142 | 0 | 0 | 0.00% | 0.00% | 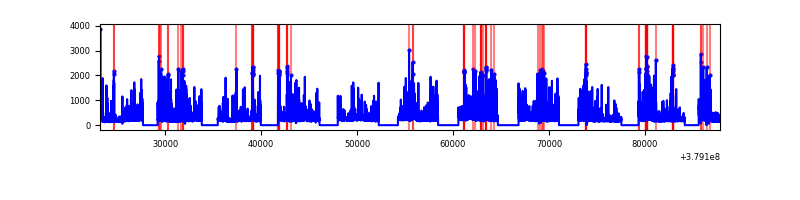 |
| C | 64624 | 46150 | 0 | 0 | 0.00% | 0.00% |  |
| D | 64624 | 46132 | 0 | 0 | 0.00% | 0.00% |  |
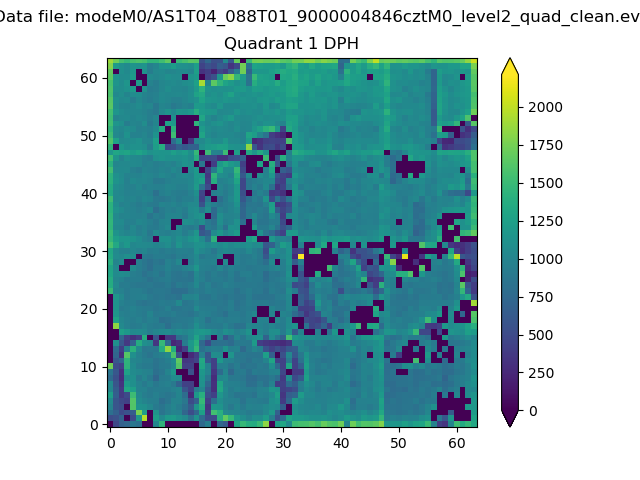
Top three noisy pixels from each quadrant. If the there are fewer than three noisy pixels in the level2.evt file, extra rows are filled as -1
| Pixel properties | Quadrant properties | ||||||
|---|---|---|---|---|---|---|---|
| Quadrant | DetID | PixID | Counts | Sigma | Mean | Median | Sigma |
| A | 9 | 19 | 2259 | 9.15 | 705 | 667 | 174.0 |
| A | 0 | 29 | 2183 | 8.71 | 705 | 667 | 174.0 |
| A | 7 | 110 | 2106 | 8.27 | 705 | 667 | 174.0 |
| B | 2 | 9 | 2183 | 11.05 | 695 | 668 | 137.1 |
| B | 3 | 80 | 2070 | 10.23 | 695 | 668 | 137.1 |
| B | 2 | 8 | 1831 | 8.48 | 695 | 668 | 137.1 |
| C | 3 | 202 | 2185 | 8.35 | 713 | 674 | 181.1 |
| C | 3 | 203 | 2173 | 8.28 | 713 | 674 | 181.1 |
| C | 3 | 187 | 1872 | 6.62 | 713 | 674 | 181.1 |
| D | 10 | 113 | 1695 | 6.28 | 659 | 605 | 173.6 |
| D | 7 | 3 | 1672 | 6.14 | 659 | 605 | 173.6 |
| D | 6 | 38 | 1639 | 5.95 | 659 | 605 | 173.6 |
Histogram calculated using DETX and DETY for each event in the final _common_clean file
| Quadrant A |  |
 |
Quadrant B |
|---|---|---|---|
| Quadrant D |  |
 |
Quadrant C |
| Plot type | Count rate plots | Images |
|---|---|---|
| Comparison with Poisson distribution Blue bars denote a histogram of data divided into 1 sec bins. Red curve is a Poisson curve with rate = median count rate of data. |
 |
 |
| Quadrant-wise count rates Data is divided into 100 sec bins |
 |
|
| Module-wise count rates for Quadrant A Data is divided into 100 sec bins |
 |
 |
| Module-wise count rates for Quadrant B Data is divided into 100 sec bins |
 |
 |
| Module-wise count rates for Quadrant C Data is divided into 100 sec bins |
 |
 |
| Module-wise count rates for Quadrant D Data is divided into 100 sec bins |
 |
 |
| Parameter | Plot |
|---|---|
| CZT HV Monitor |  |
| D_VDD | 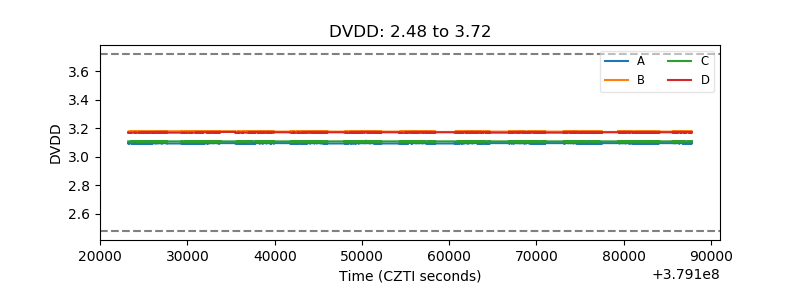 |
| Temperature 1 | 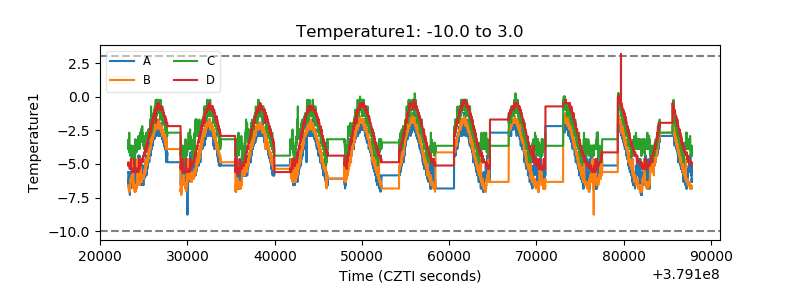 |
| Veto HV Monitor |  |
| Veto LLD |  |
| Alpha Counter |  |
| _CPM_Rate |  |
| CZT Counter |  |
| +2.5 Volts monitor |  |
| +5 Volts monitor |  |
| _ROLL_ROT |  |
| _Roll_DEC |  |
| _Roll_RA |  |
| Veto Counter |  |