| Param | Original file | Final file |
|---|---|---|
| Filename | modeM0/AS1T04_088T01_9000004846_33924cztM0_level2.evt | modeM0/AS1T04_088T01_9000004846_33924cztM0_level2_quad_clean.evt |
| Size (bytes) | 495,737,280 | 71,346,240 |
| Size | 472.8 MB | 68.0 MB |
| Events in quadrant A | 3,725,360 | 449,328 |
| Events in quadrant B | 3,142,312 | 455,686 |
| Events in quadrant C | 2,962,221 | 450,498 |
| Events in quadrant D | 4,811,116 | 420,451 |
| Mode SS | |||
|---|---|---|---|
| Quadrant | BADHDUFLAG | Total packets | Discarded packets |
| A | 0 | 112 | 0 |
| B | 0 | 112 | 0 |
| C | 0 | 112 | 0 |
| D | 0 | 112 | 0 |
| Mode M9 | |||
|---|---|---|---|
| Quadrant | BADHDUFLAG | Total packets | Discarded packets |
| A | 0 | 15 | 0 |
| B | 0 | 15 | 0 |
| C | 0 | 15 | 0 |
| D | 0 | 15 | 0 |
| Mode M0 | |||
|---|---|---|---|
| Quadrant | BADHDUFLAG | Total packets | Discarded packets |
| A | 0 | 15006 | 2 |
| B | 0 | 13078 | 1 |
| C | 0 | 12232 | 1 |
| D | 0 | 17989 | 1 |
| Quadrant | Total seconds | Saturated seconds | Saturation percentage |
|---|---|---|---|
| A | 5491 | 443 | 8.067747% |
| B | 5491 | 123 | 2.240029% |
| C | 5491 | 49 | 0.892369% |
| D | 5491 | 390 | 7.102531% |
Noise dominated data is calculated using 1-second bins in cleaned event files. If a bin has >2000 counts, and if more than 50% of those come from <1% of pixels, then it is considered to be noise-dominated and hence unusable.
| Quadrant | # 1 sec bins | Bins with >0 counts | Bins with >2000 counts | High rate bins dominated by noise | Noise dominated (total time) | Noise dominated (detector-on time) | Marked lightcurve |
|---|---|---|---|---|---|---|---|
| A | 7014 | 5492 | 264 | 264 | 3.76% | 4.81% | 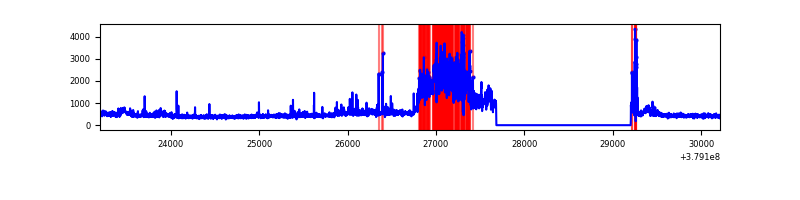 |
| B | 7014 | 5492 | 63 | 63 | 0.90% | 1.15% | 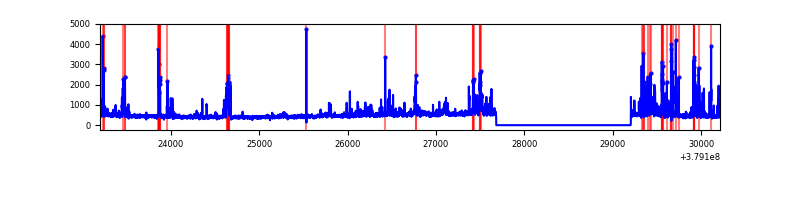 |
| C | 7014 | 5492 | 34 | 34 | 0.48% | 0.62% | 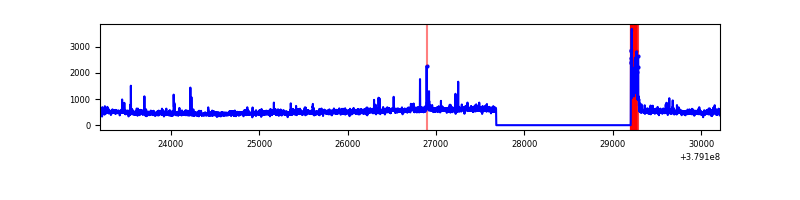 |
| D | 7014 | 5492 | 269 | 269 | 3.84% | 4.90% | 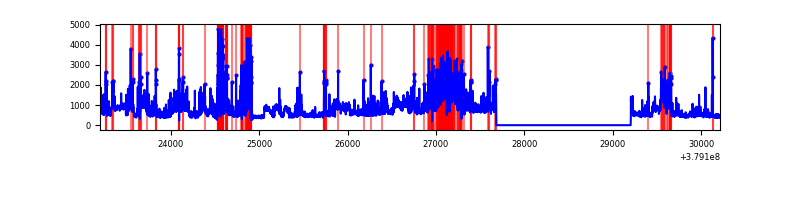 |
Top three noisy pixels from each quadrant. If the there are fewer than three noisy pixels in the level2.evt file, extra rows are filled as -1
| Pixel properties | Quadrant properties | ||||||
|---|---|---|---|---|---|---|---|
| Quadrant | DetID | PixID | Counts | Sigma | Mean | Median | Sigma |
| A | 15 | 169 | 1379696 | 11419.72 | 600 | 588 | 120.8 |
| A | 13 | 6 | 11978 | 94.32 | 600 | 588 | 120.8 |
| A | 7 | 16 | 10057 | 78.41 | 600 | 588 | 120.8 |
| B | 5 | 172 | 473109 | 4012.26 | 615 | 598 | 117.8 |
| B | 15 | 35 | 107839 | 910.62 | 615 | 598 | 117.8 |
| B | 0 | 219 | 34864 | 290.97 | 615 | 598 | 117.8 |
| C | 15 | 214 | 235476 | 1677.79 | 601 | 605 | 140.0 |
| C | 0 | 10 | 185923 | 1323.81 | 601 | 605 | 140.0 |
| C | 3 | 233 | 127906 | 909.37 | 601 | 605 | 140.0 |
| D | 8 | 195 | 767332 | 5436.05 | 582 | 565 | 141.1 |
| D | 2 | 250 | 442201 | 3131.01 | 582 | 565 | 141.1 |
| D | 12 | 235 | 426014 | 3016.25 | 582 | 565 | 141.1 |
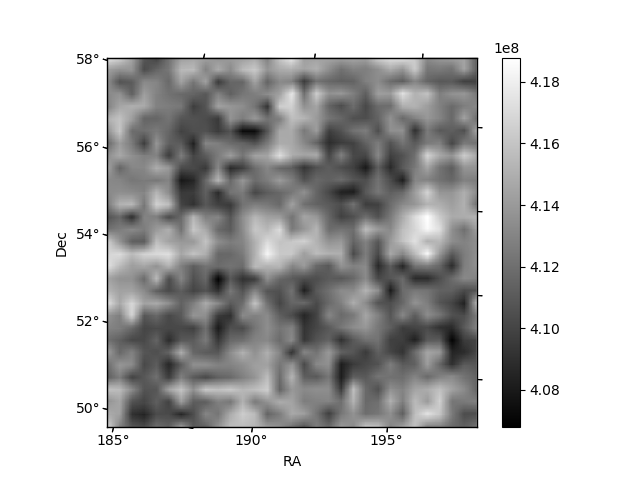
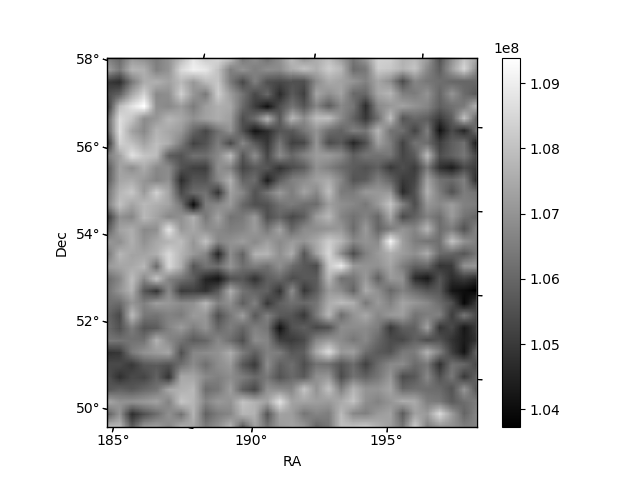
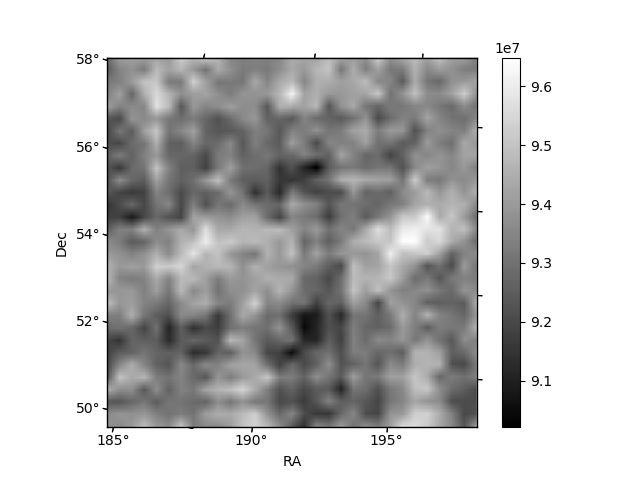
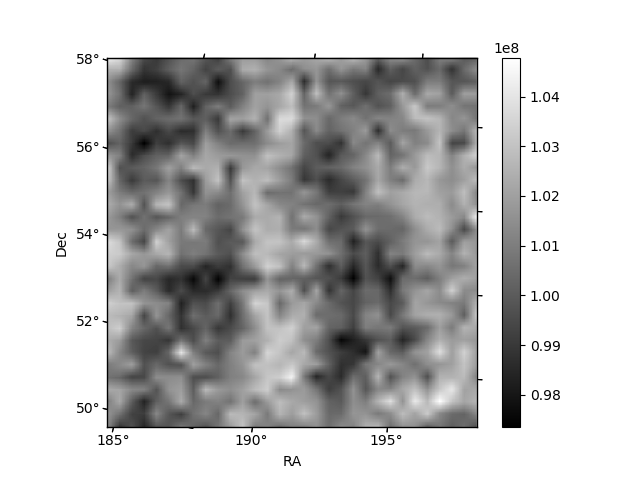
Histogram calculated using DETX and DETY for each event in the final _common_clean file
| Quadrant A | 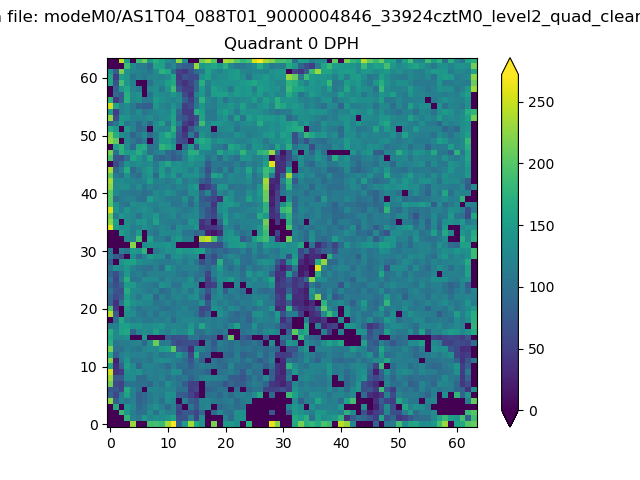 |
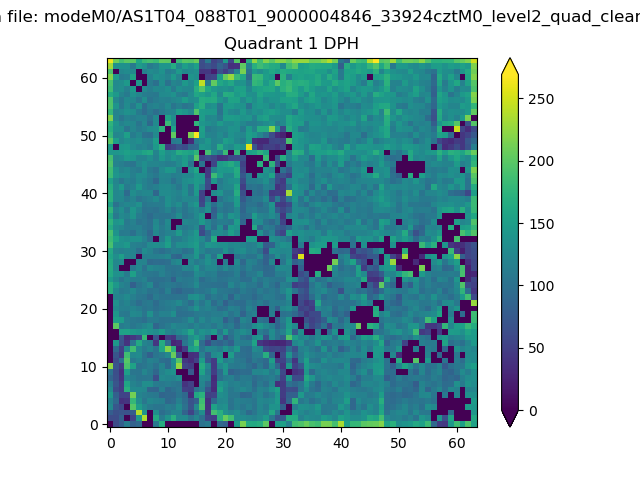 |
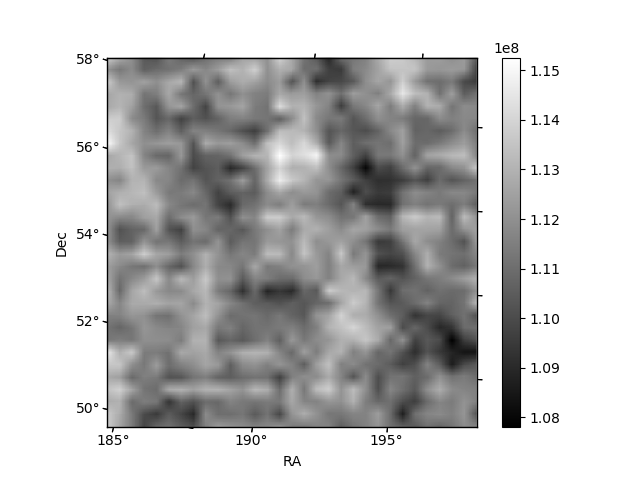
Quadrant B |
|---|---|---|---|
| Quadrant D | 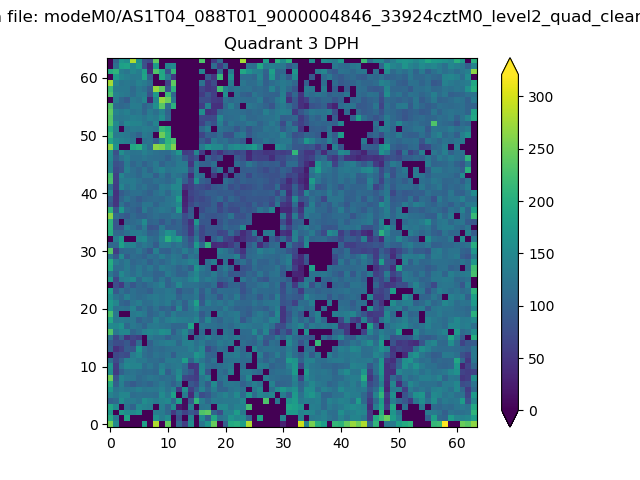 |
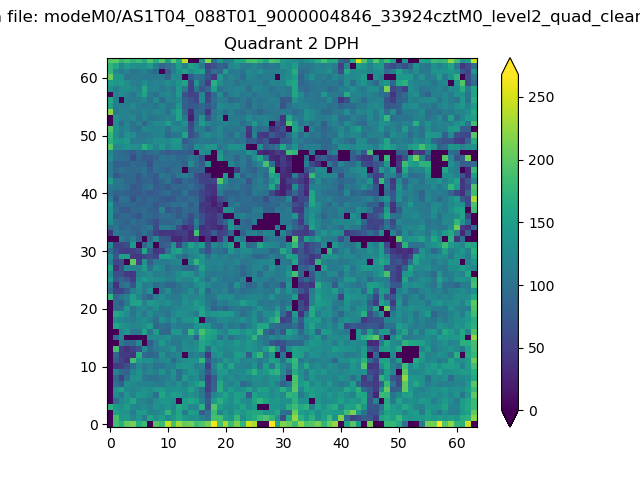 |
Quadrant C |
| Plot type | Count rate plots | Images |
|---|---|---|
| Comparison with Poisson distribution Blue bars denote a histogram of data divided into 1 sec bins. Red curve is a Poisson curve with rate = median count rate of data. |
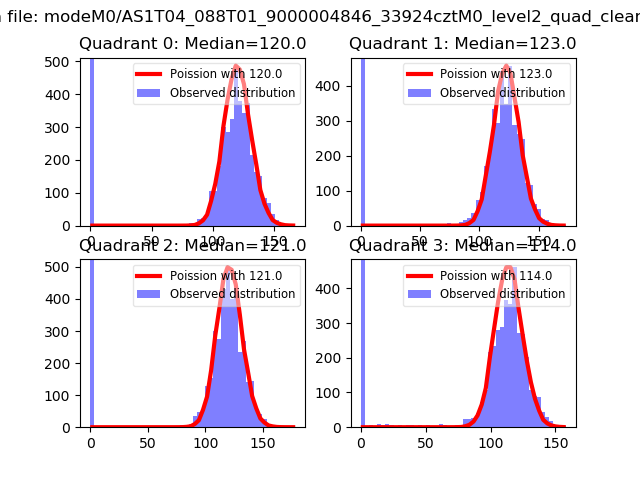 |
 |
| Quadrant-wise count rates Data is divided into 100 sec bins |
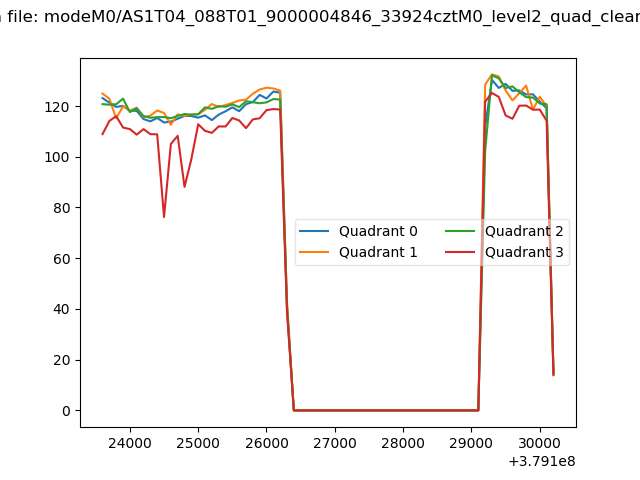 |
|
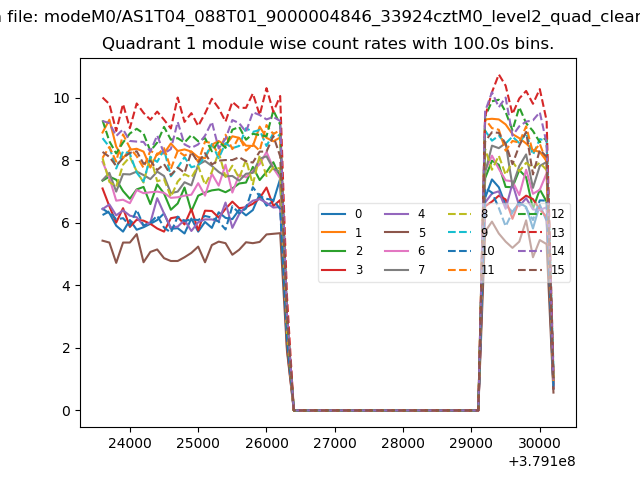
| Module-wise count rates for Quadrant A Data is divided into 100 sec bins |
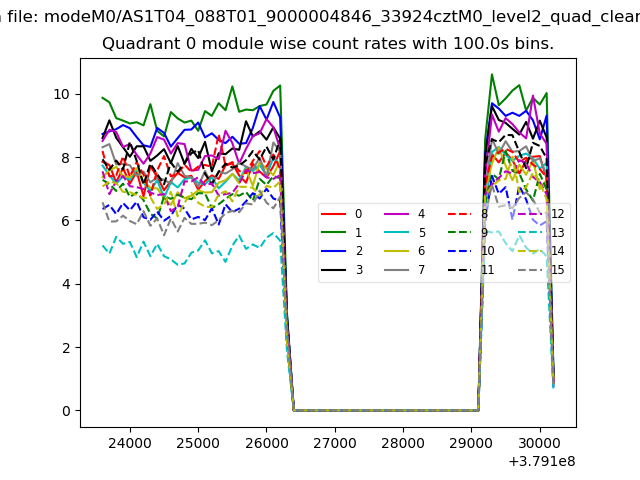 |
 |
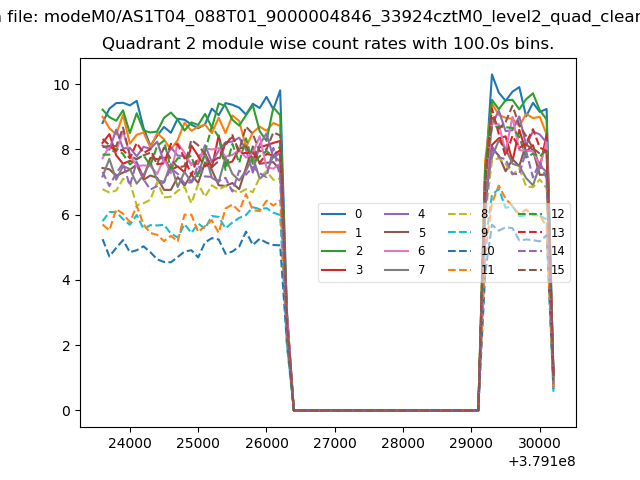
| Module-wise count rates for Quadrant B Data is divided into 100 sec bins |
 |
 |
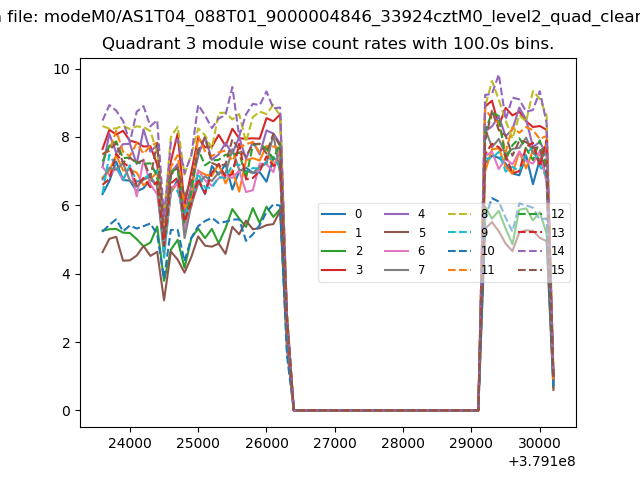
| Module-wise count rates for Quadrant C Data is divided into 100 sec bins |
 |
 |
| Module-wise count rates for Quadrant D Data is divided into 100 sec bins |
 |
 |
| Parameter | Plot |
|---|---|
| CZT HV Monitor | 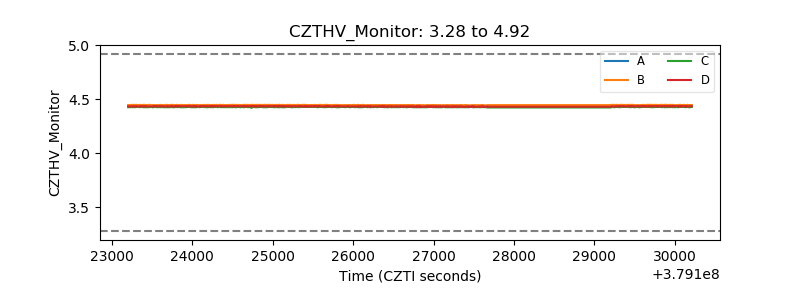 |
| D_VDD | 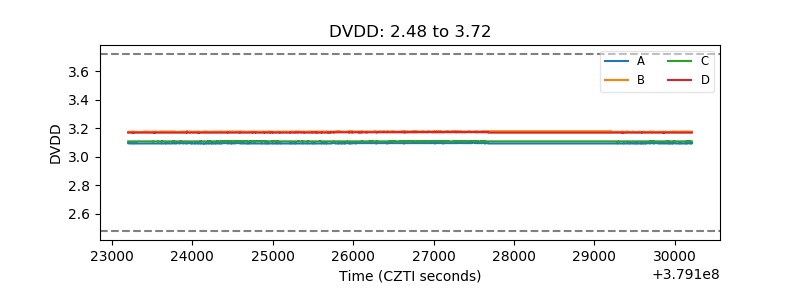 |
| Temperature 1 | 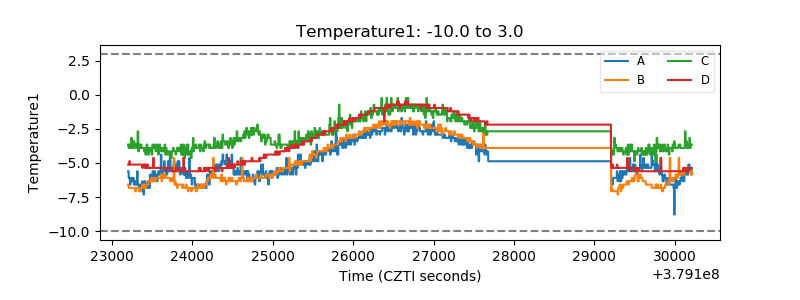 |
| Veto HV Monitor | 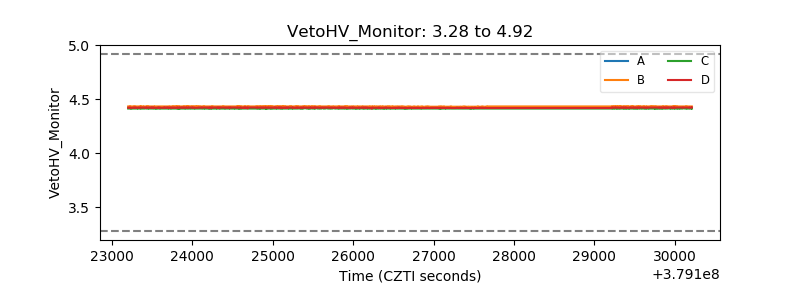 |
| Veto LLD | 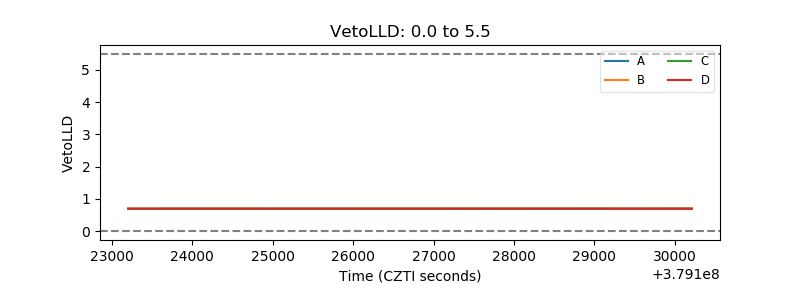 |
| Alpha Counter | 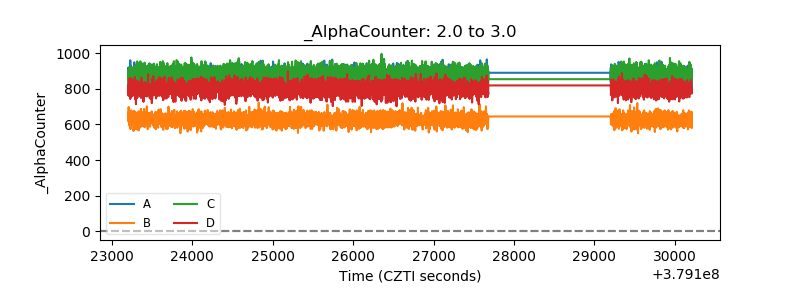 |
| _CPM_Rate | 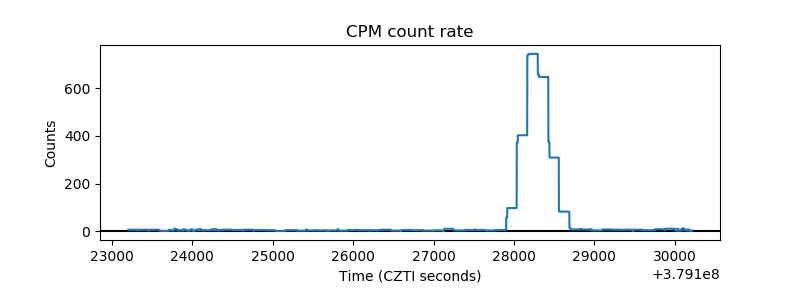 |
| CZT Counter | 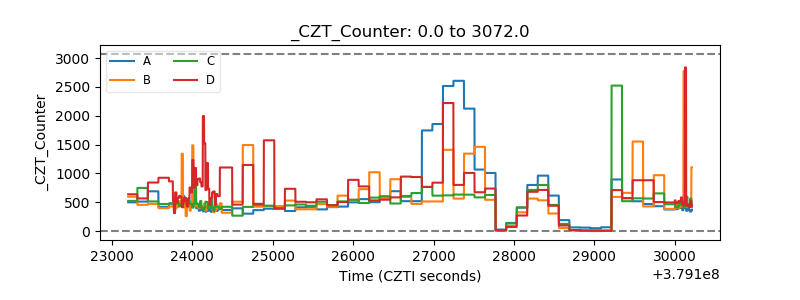 |
| +2.5 Volts monitor |  |
| +5 Volts monitor |  |
| _ROLL_ROT | 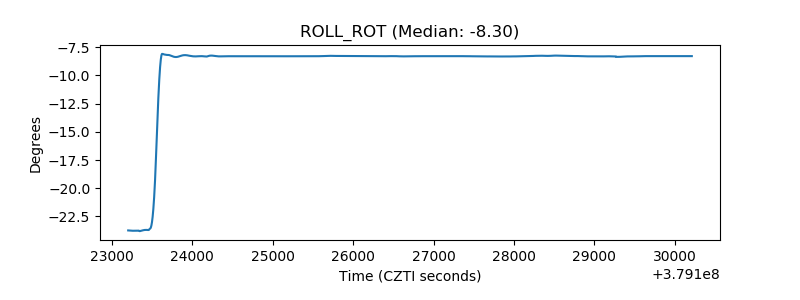 |
| _Roll_DEC | 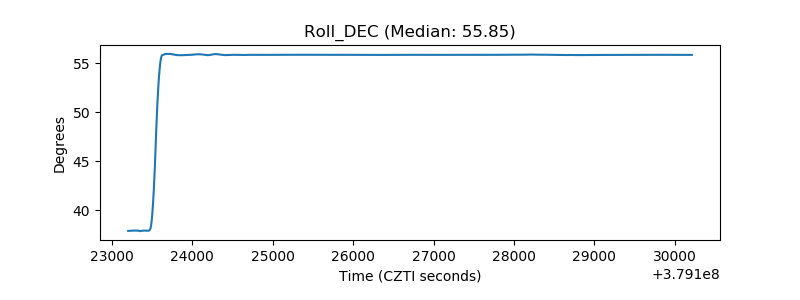 |
| _Roll_RA | 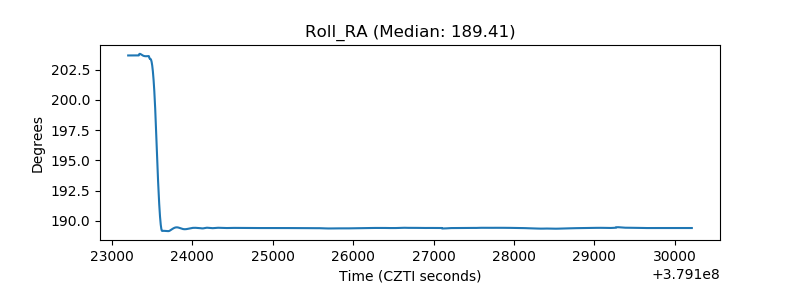 |
| Veto Counter | 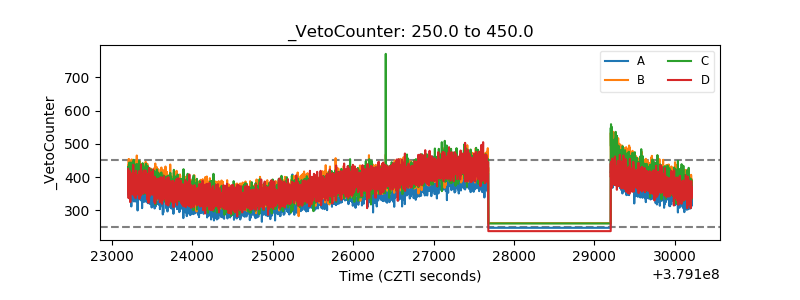 |