| Param | Original file | Final file |
|---|---|---|
| Filename | modeM0/AS1T04_088T01_9000004846_33928cztM0_level2.evt | modeM0/AS1T04_088T01_9000004846_33928cztM0_level2_quad_clean.evt |
| Size (bytes) | 801,112,320 | 129,372,480 |
| Size | 764.0 MB | 123.4 MB |
| Events in quadrant A | 4,472,110 | 846,869 |
| Events in quadrant B | 5,437,510 | 840,208 |
| Events in quadrant C | 5,031,940 | 824,416 |
| Events in quadrant D | 8,704,960 | 774,313 |
| Mode SS | |||
|---|---|---|---|
| Quadrant | BADHDUFLAG | Total packets | Discarded packets |
| A | 0 | 186 | 0 |
| B | 0 | 186 | 0 |
| C | 0 | 186 | 0 |
| D | 0 | 186 | 0 |
| Mode M9 | |||
|---|---|---|---|
| Quadrant | BADHDUFLAG | Total packets | Discarded packets |
| A | 0 | 37 | 0 |
| B | 0 | 37 | 0 |
| C | 0 | 37 | 0 |
| D | 0 | 37 | 0 |
| Mode M0 | |||
|---|---|---|---|
| Quadrant | BADHDUFLAG | Total packets | Discarded packets |
| A | 0 | 18962 | 3 |
| B | 0 | 21726 | 2 |
| C | 0 | 20135 | 2 |
| D | 0 | 32275 | 2 |
| Quadrant | Total seconds | Saturated seconds | Saturation percentage |
|---|---|---|---|
| A | 9114 | 15 | 0.164582% |
| B | 9114 | 308 | 3.379416% |
| C | 9114 | 81 | 0.888743% |
| D | 9114 | 405 | 4.443713% |
Noise dominated data is calculated using 1-second bins in cleaned event files. If a bin has >2000 counts, and if more than 50% of those come from <1% of pixels, then it is considered to be noise-dominated and hence unusable.
| Quadrant | # 1 sec bins | Bins with >0 counts | Bins with >2000 counts | High rate bins dominated by noise | Noise dominated (total time) | Noise dominated (detector-on time) | Marked lightcurve |
|---|---|---|---|---|---|---|---|
| A | 12819 | 9116 | 6 | 6 | 0.05% | 0.07% | 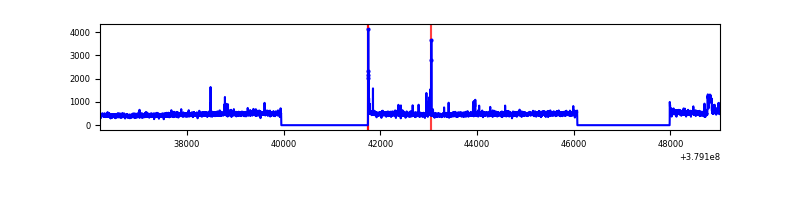 |
| B | 12819 | 9116 | 208 | 208 | 1.62% | 2.28% | 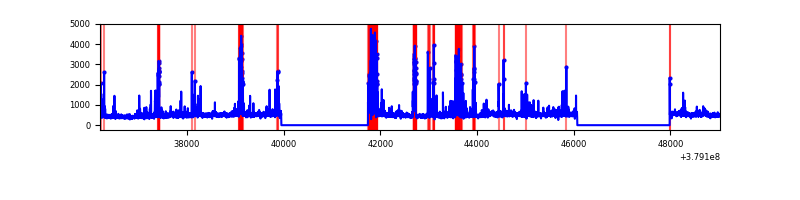 |
| C | 12819 | 9116 | 65 | 65 | 0.51% | 0.71% | 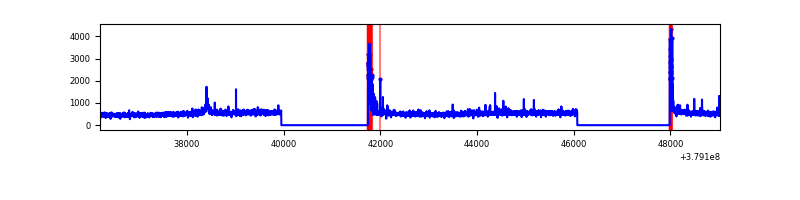 |
| D | 12819 | 9116 | 344 | 344 | 2.68% | 3.77% | 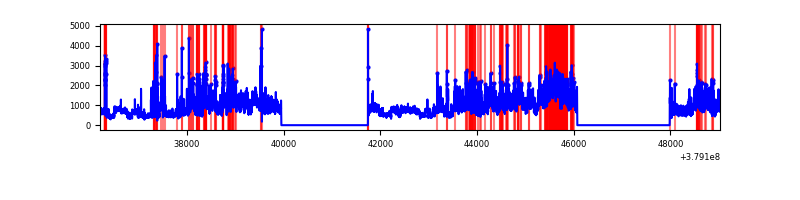 |
Top three noisy pixels from each quadrant. If the there are fewer than three noisy pixels in the level2.evt file, extra rows are filled as -1
| Pixel properties | Quadrant properties | ||||||
|---|---|---|---|---|---|---|---|
| Quadrant | DetID | PixID | Counts | Sigma | Mean | Median | Sigma |
| A | 15 | 169 | 166173 | 764.17 | 1102 | 1085 | 216.0 |
| A | 7 | 16 | 21814 | 95.95 | 1102 | 1085 | 216.0 |
| A | 10 | 83 | 14888 | 63.89 | 1102 | 1085 | 216.0 |
| B | 5 | 172 | 861153 | 4326.86 | 1069 | 1044 | 198.8 |
| B | 15 | 85 | 135092 | 674.34 | 1069 | 1044 | 198.8 |
| B | 0 | 190 | 71690 | 355.39 | 1069 | 1044 | 198.8 |
| C | 15 | 214 | 393674 | 1646.31 | 1045 | 1051 | 238.5 |
| C | 0 | 10 | 303235 | 1267.09 | 1045 | 1051 | 238.5 |
| C | 3 | 233 | 134513 | 559.62 | 1045 | 1051 | 238.5 |
| D | 8 | 195 | 1965518 | 7763.72 | 1050 | 1023 | 253.0 |
| D | 1 | 52 | 1498708 | 5918.88 | 1050 | 1023 | 253.0 |
| D | 2 | 250 | 466967 | 1841.42 | 1050 | 1023 | 253.0 |
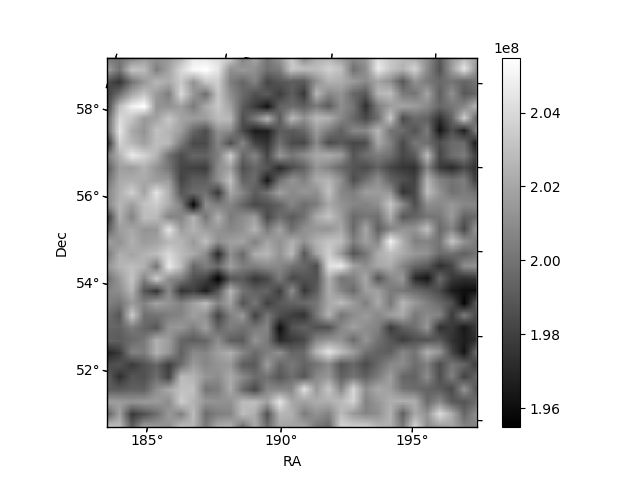
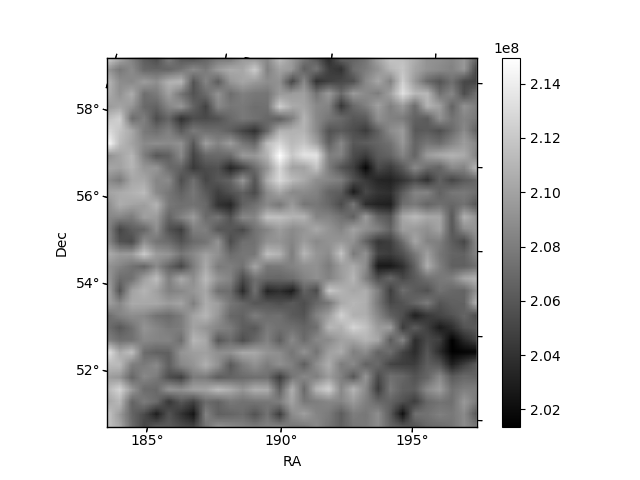
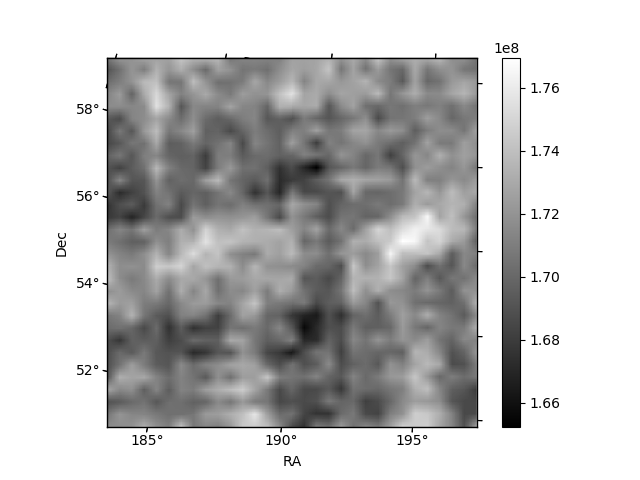
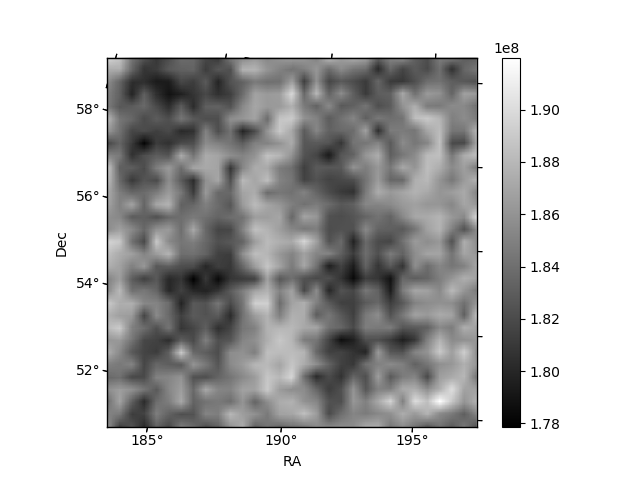
Histogram calculated using DETX and DETY for each event in the final _common_clean file
| Quadrant A | 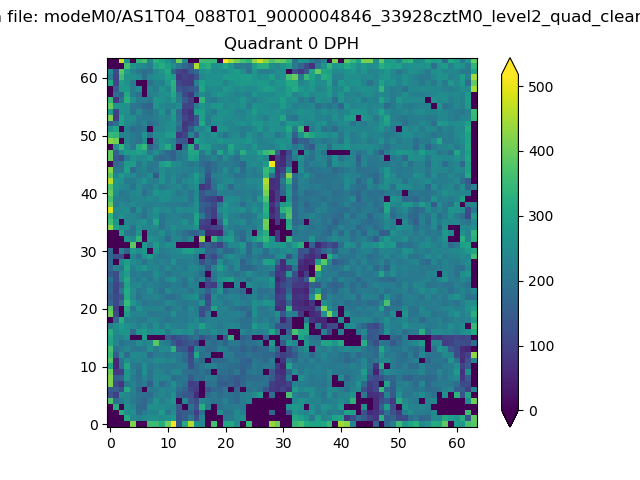 |
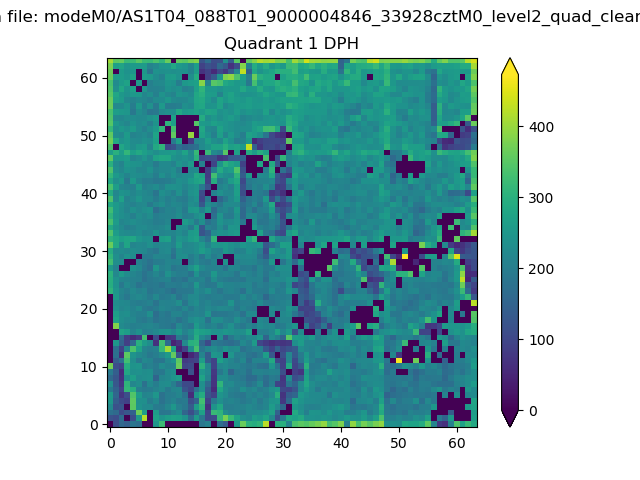 |
Quadrant B |
|---|---|---|---|
| Quadrant D | 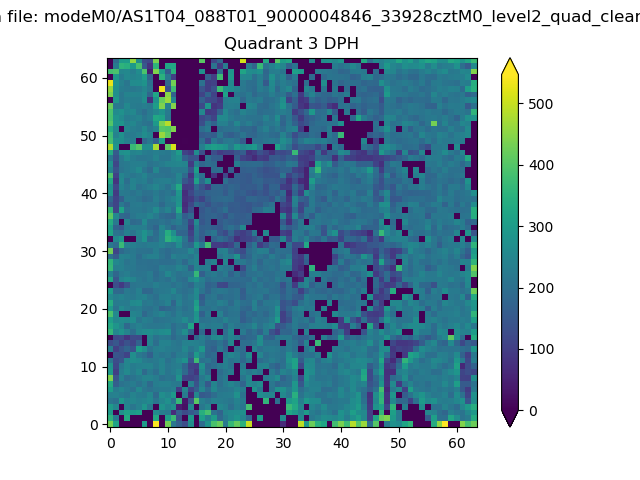 |
 |
Quadrant C |
| Plot type | Count rate plots | Images |
|---|---|---|
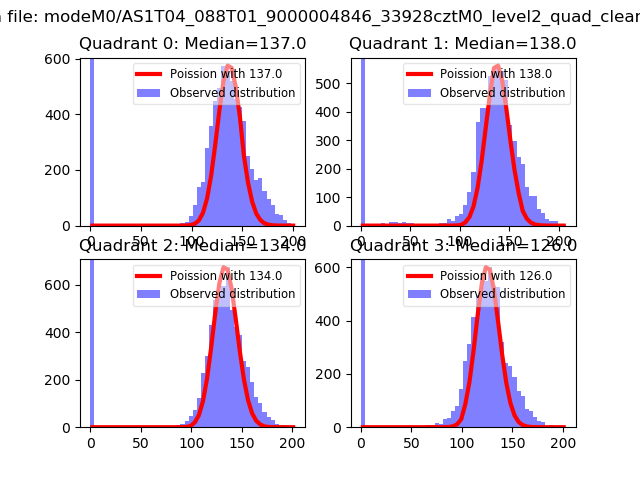
| Comparison with Poisson distribution Blue bars denote a histogram of data divided into 1 sec bins. Red curve is a Poisson curve with rate = median count rate of data. |
 |
 |
| Quadrant-wise count rates Data is divided into 100 sec bins |
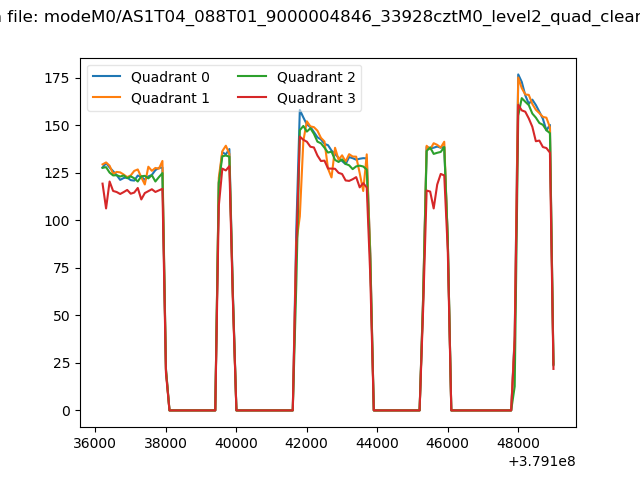 |
|
| Module-wise count rates for Quadrant A Data is divided into 100 sec bins |
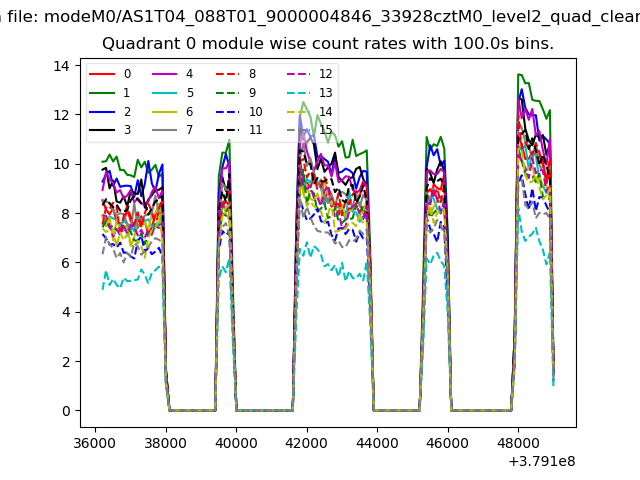 |
 |
| Module-wise count rates for Quadrant B Data is divided into 100 sec bins |
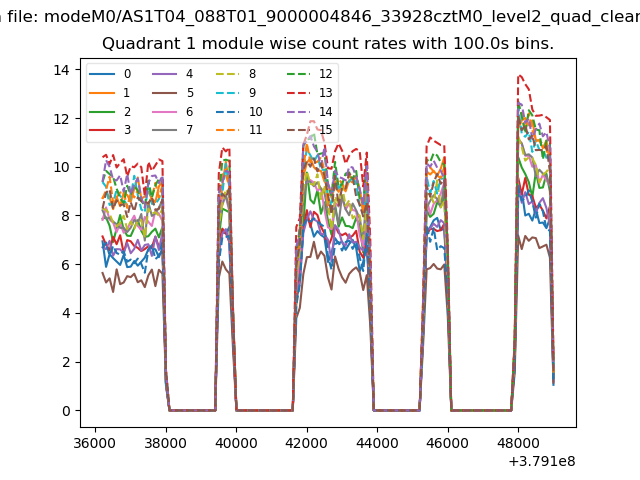 |
 |
| Module-wise count rates for Quadrant C Data is divided into 100 sec bins |
 |
 |
| Module-wise count rates for Quadrant D Data is divided into 100 sec bins |
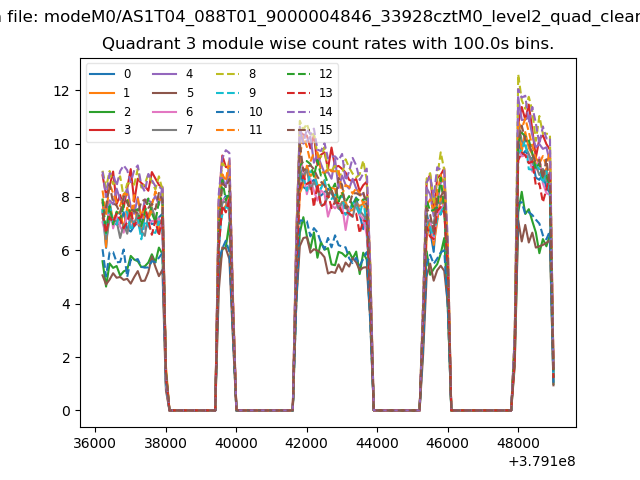 |
 |
| Parameter | Plot |
|---|---|
| CZT HV Monitor | 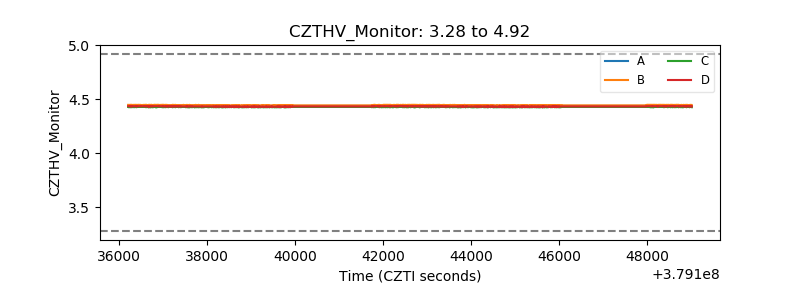 |
| D_VDD | 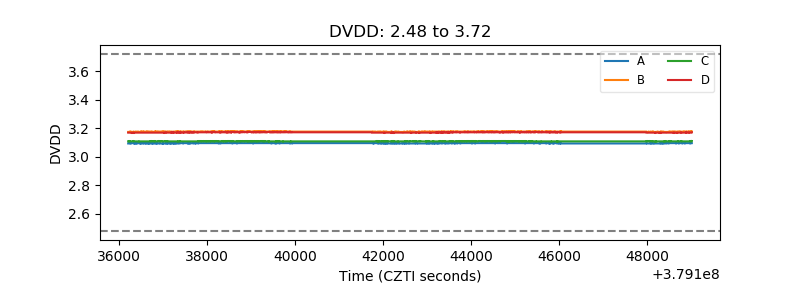 |
| Temperature 1 | 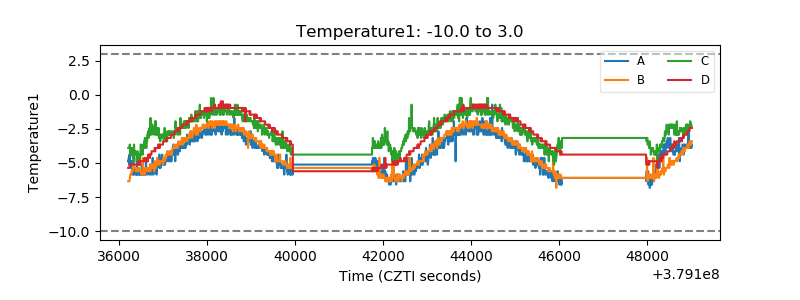 |
| Veto HV Monitor | 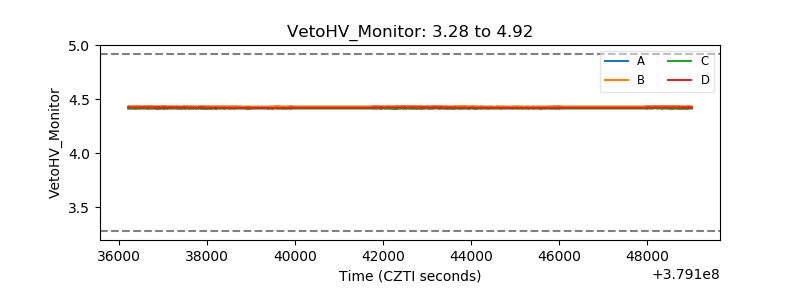 |
| Veto LLD | 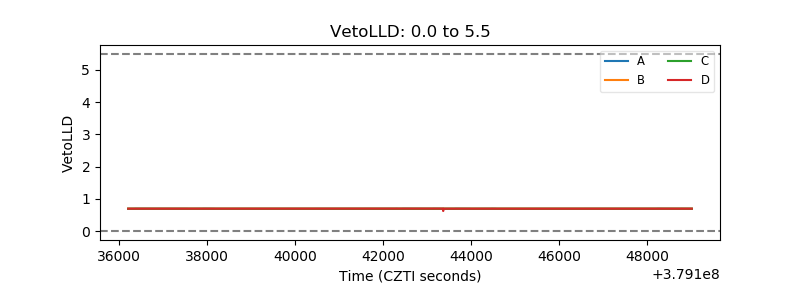 |
| Alpha Counter | 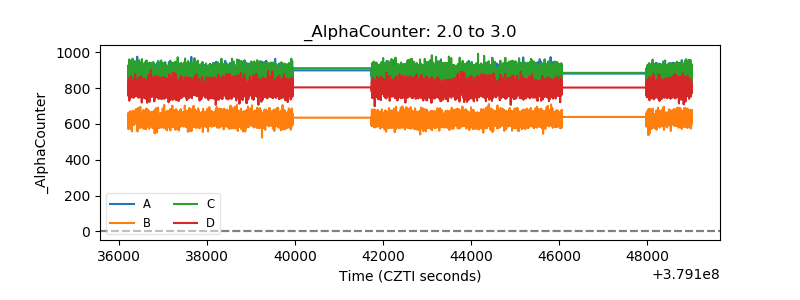 |
| _CPM_Rate | 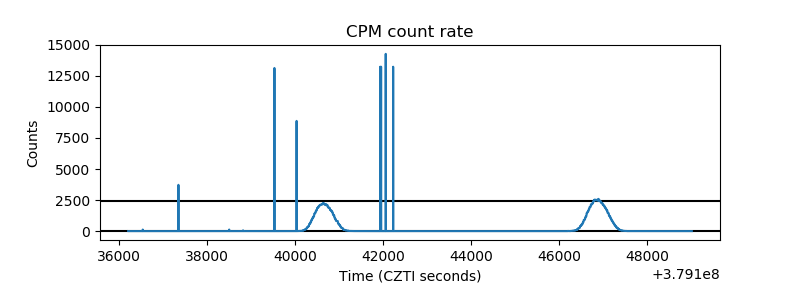 |
| CZT Counter | 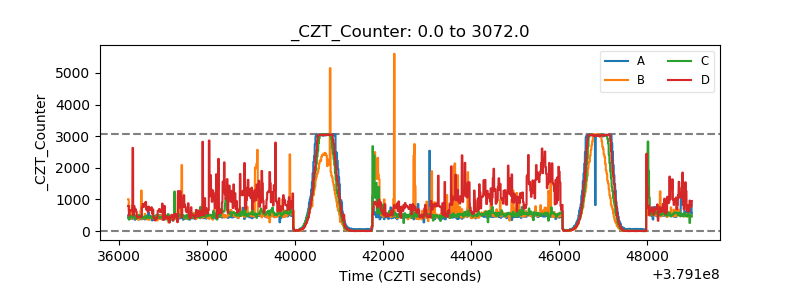 |
| +2.5 Volts monitor |  |
| +5 Volts monitor |  |
| _ROLL_ROT | 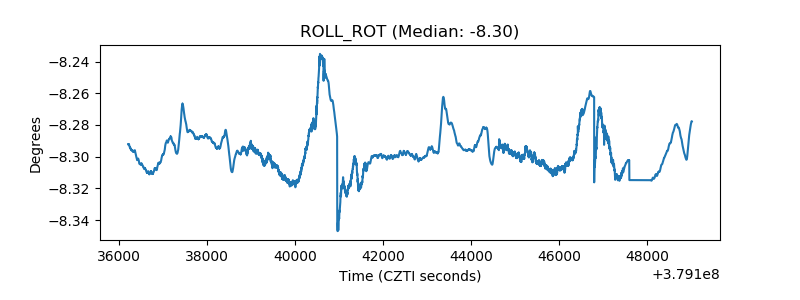 |
| _Roll_DEC | 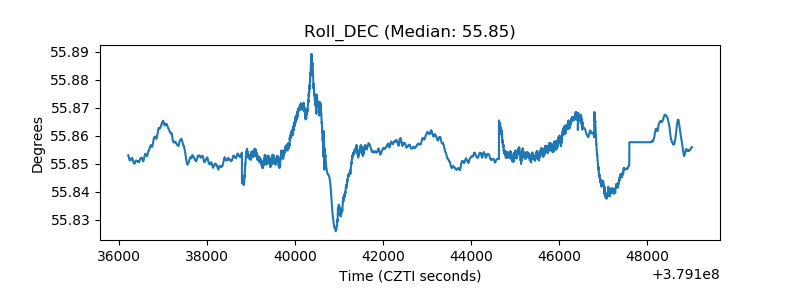 |
| _Roll_RA |  |
| Veto Counter | 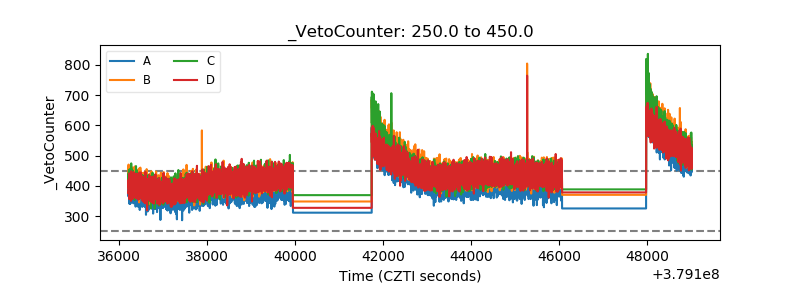 |