| Param | Original file | Final file |
|---|---|---|
| Filename | modeM0/AS1T04_088T01_9000004846_33929cztM0_level2.evt | modeM0/AS1T04_088T01_9000004846_33929cztM0_level2_quad_clean.evt |
| Size (bytes) | 489,326,400 | 78,442,560 |
| Size | 466.7 MB | 74.8 MB |
| Events in quadrant A | 2,655,716 | 528,610 |
| Events in quadrant B | 2,836,256 | 528,060 |
| Events in quadrant C | 2,930,296 | 509,923 |
| Events in quadrant D | 6,061,666 | 461,601 |
| Mode SS | |||
|---|---|---|---|
| Quadrant | BADHDUFLAG | Total packets | Discarded packets |
| A | 0 | 102 | 0 |
| B | 0 | 102 | 0 |
| C | 0 | 102 | 0 |
| D | 0 | 102 | 0 |
| Mode M9 | |||
|---|---|---|---|
| Quadrant | BADHDUFLAG | Total packets | Discarded packets |
| A | 0 | 20 | 0 |
| B | 0 | 20 | 0 |
| C | 0 | 20 | 0 |
| D | 0 | 20 | 0 |
| Mode M0 | |||
|---|---|---|---|
| Quadrant | BADHDUFLAG | Total packets | Discarded packets |
| A | 0 | 10606 | 2 |
| B | 0 | 11293 | 1 |
| C | 0 | 11566 | 1 |
| D | 0 | 21461 | 1 |
| Quadrant | Total seconds | Saturated seconds | Saturation percentage |
|---|---|---|---|
| A | 4945 | 21 | 0.424671% |
| B | 4945 | 36 | 0.728008% |
| C | 4945 | 58 | 1.172902% |
| D | 4945 | 771 | 15.591507% |
Noise dominated data is calculated using 1-second bins in cleaned event files. If a bin has >2000 counts, and if more than 50% of those come from <1% of pixels, then it is considered to be noise-dominated and hence unusable.
| Quadrant | # 1 sec bins | Bins with >0 counts | Bins with >2000 counts | High rate bins dominated by noise | Noise dominated (total time) | Noise dominated (detector-on time) | Marked lightcurve |
|---|---|---|---|---|---|---|---|
| A | 6948 | 4946 | 10 | 10 | 0.14% | 0.20% | 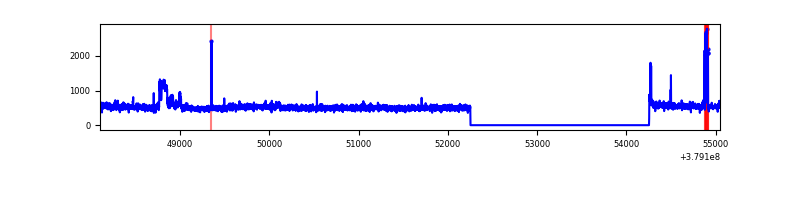 |
| B | 6948 | 4946 | 20 | 20 | 0.29% | 0.40% | 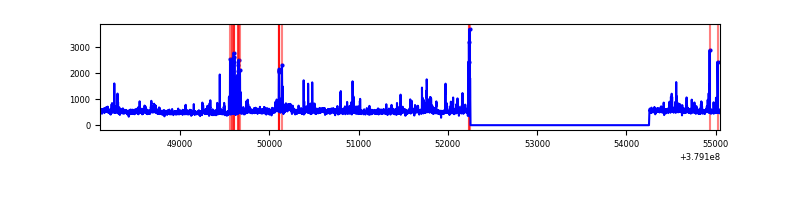 |
| C | 6948 | 4946 | 50 | 50 | 0.72% | 1.01% | 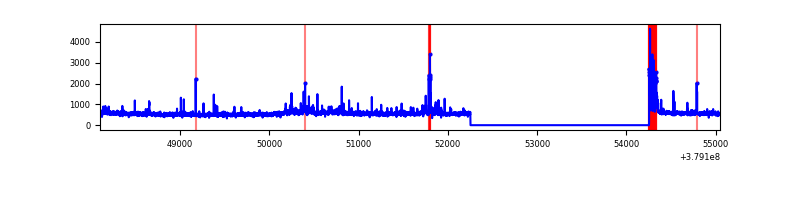 |
| D | 6948 | 4946 | 718 | 718 | 10.33% | 14.52% | 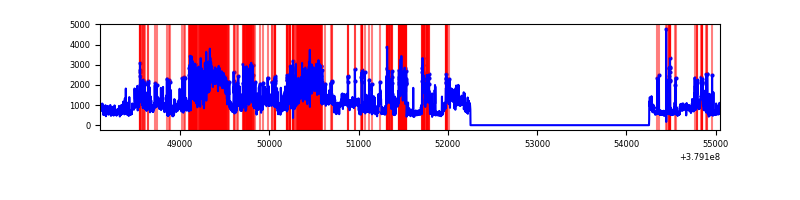 |
Top three noisy pixels from each quadrant. If the there are fewer than three noisy pixels in the level2.evt file, extra rows are filled as -1
| Pixel properties | Quadrant properties | ||||||
|---|---|---|---|---|---|---|---|
| Quadrant | DetID | PixID | Counts | Sigma | Mean | Median | Sigma |
| A | 15 | 169 | 143840 | 1138.06 | 637 | 627 | 125.8 |
| A | 13 | 6 | 36807 | 287.51 | 637 | 627 | 125.8 |
| A | 13 | 254 | 8578 | 63.18 | 637 | 627 | 125.8 |
| B | 5 | 172 | 186756 | 1603.46 | 620 | 606 | 116.1 |
| B | 0 | 189 | 32779 | 277.13 | 620 | 606 | 116.1 |
| B | 0 | 190 | 31084 | 262.53 | 620 | 606 | 116.1 |
| C | 15 | 214 | 219860 | 1616.98 | 599 | 604 | 135.6 |
| C | 3 | 233 | 148145 | 1088.09 | 599 | 604 | 135.6 |
| C | 0 | 10 | 147889 | 1086.2 | 599 | 604 | 135.6 |
| D | 1 | 52 | 1540029 | 10863.82 | 590 | 576 | 141.7 |
| D | 8 | 195 | 1020026 | 7194.19 | 590 | 576 | 141.7 |
| D | 10 | 118 | 468685 | 3303.41 | 590 | 576 | 141.7 |
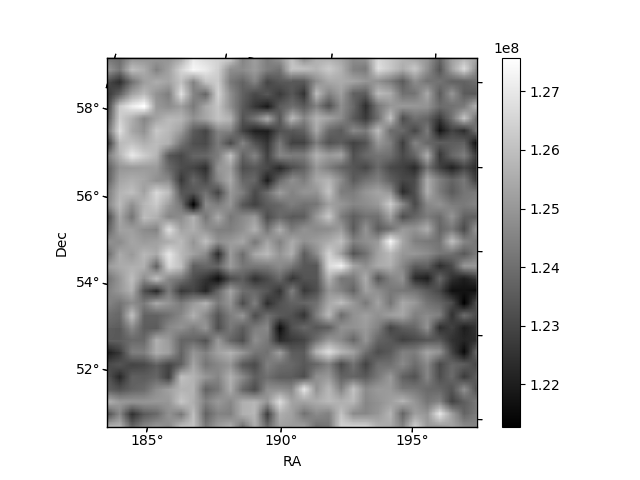
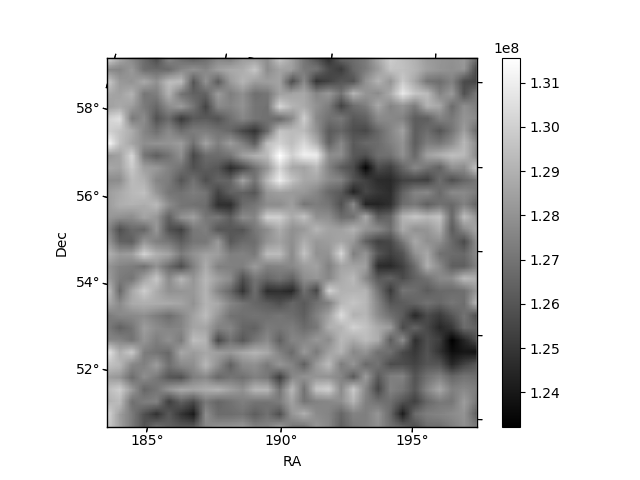
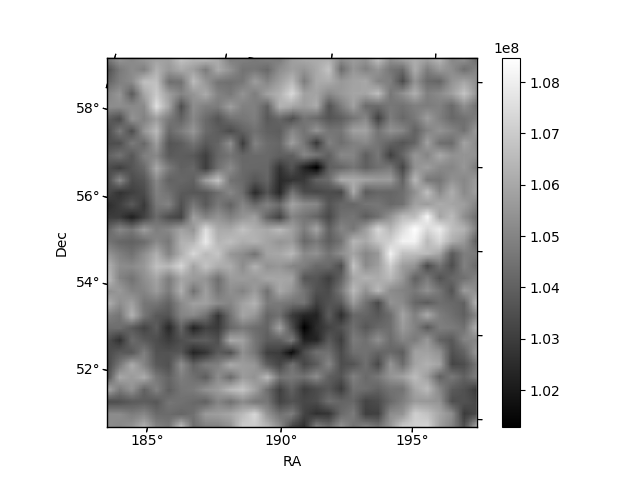
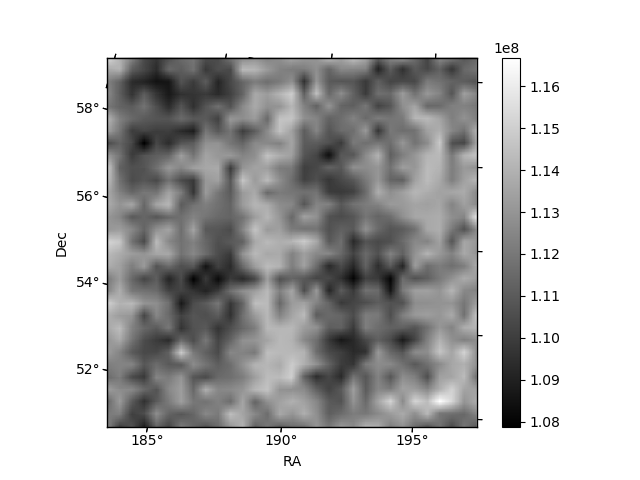
Histogram calculated using DETX and DETY for each event in the final _common_clean file
| Quadrant A | 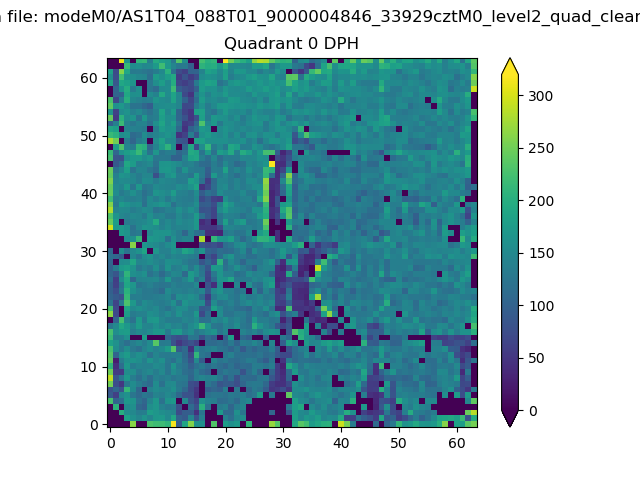 |
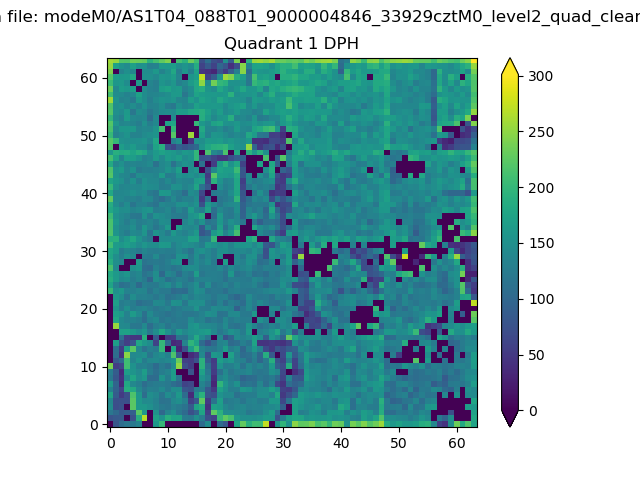 |
Quadrant B |
|---|---|---|---|
| Quadrant D | 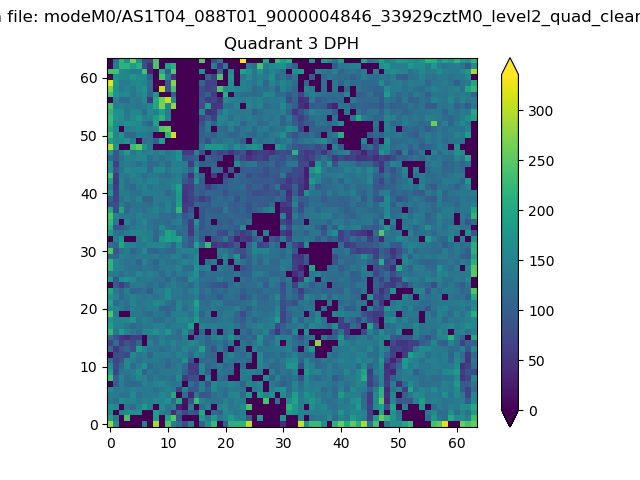 |
 |
Quadrant C |
| Plot type | Count rate plots | Images |
|---|---|---|
| Comparison with Poisson distribution Blue bars denote a histogram of data divided into 1 sec bins. Red curve is a Poisson curve with rate = median count rate of data. |
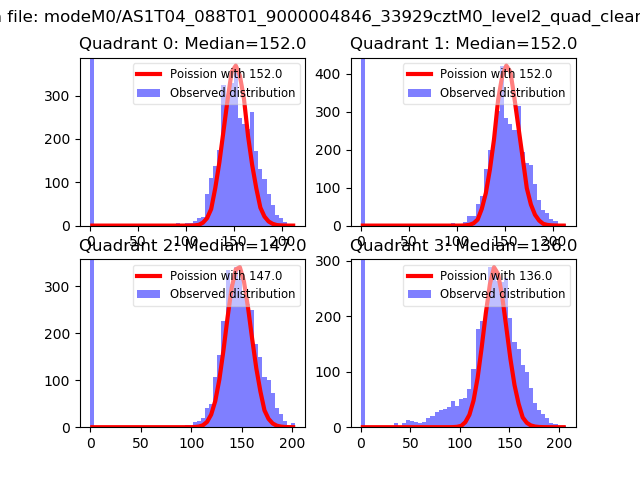 |
 |
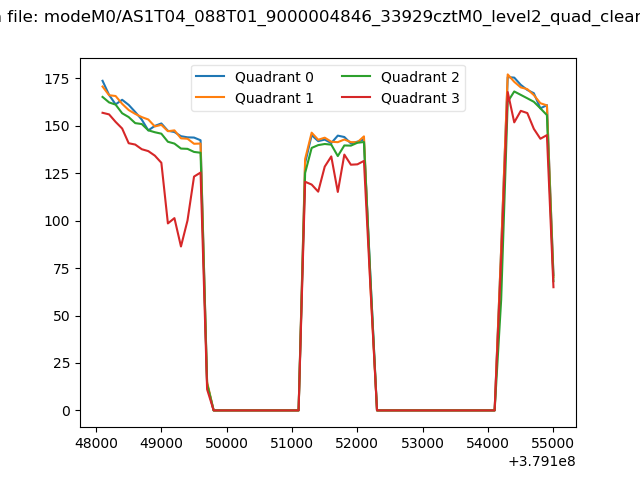
| Quadrant-wise count rates Data is divided into 100 sec bins |
 |
|
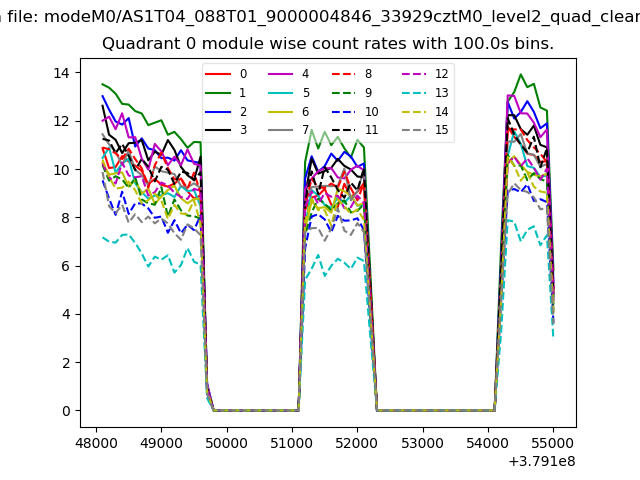
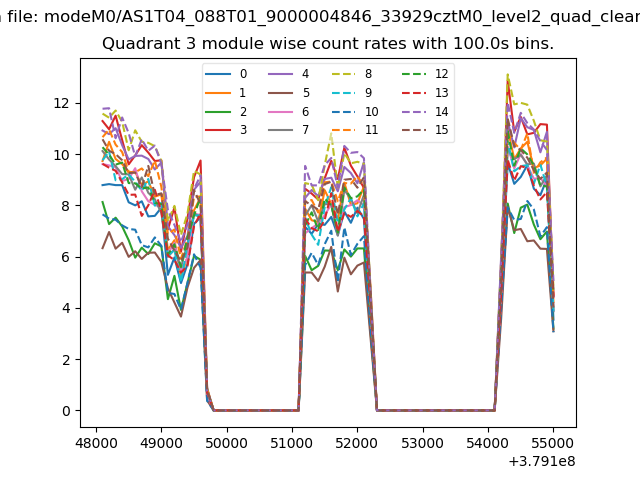
| Module-wise count rates for Quadrant A Data is divided into 100 sec bins |
 |
 |
| Module-wise count rates for Quadrant B Data is divided into 100 sec bins |
 |
 |
| Module-wise count rates for Quadrant C Data is divided into 100 sec bins |
 |
 |
| Module-wise count rates for Quadrant D Data is divided into 100 sec bins |
 |
 |
| Parameter | Plot |
|---|---|
| CZT HV Monitor | 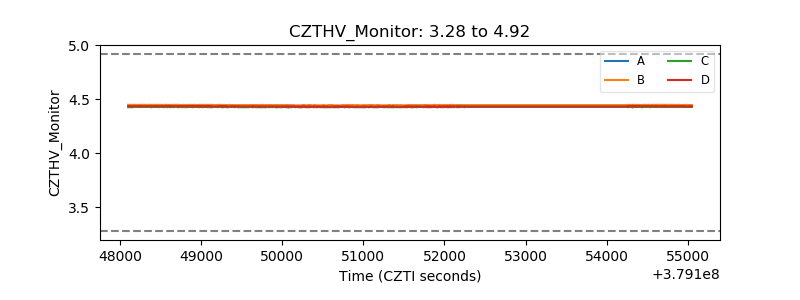 |
| D_VDD | 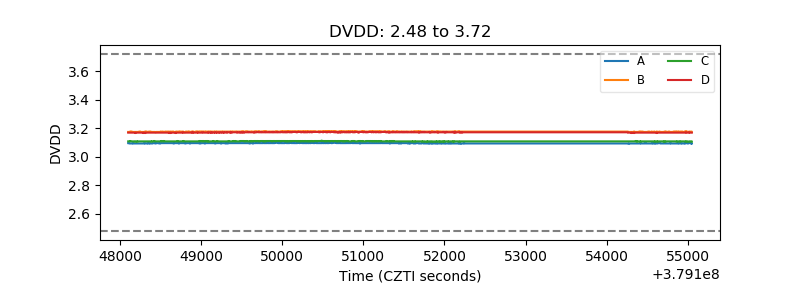 |
| Temperature 1 | 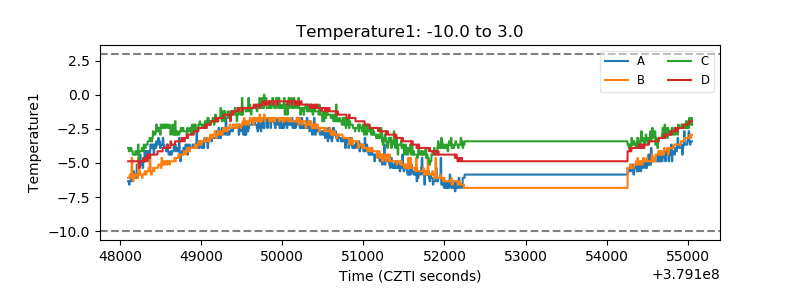 |
| Veto HV Monitor | 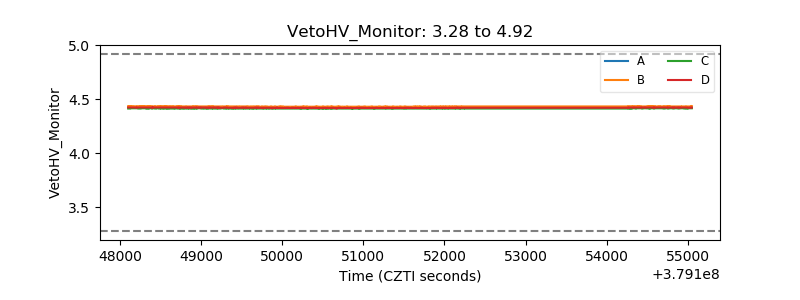 |
| Veto LLD | 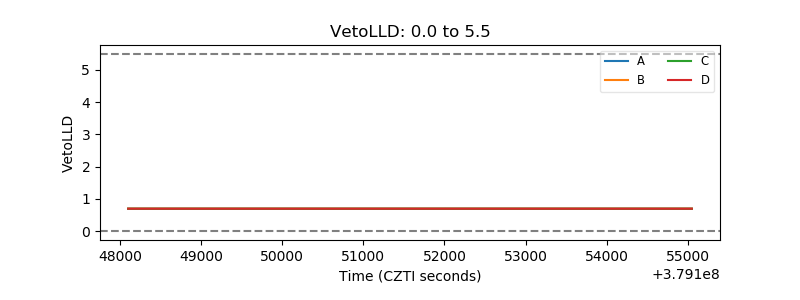 |
| Alpha Counter | 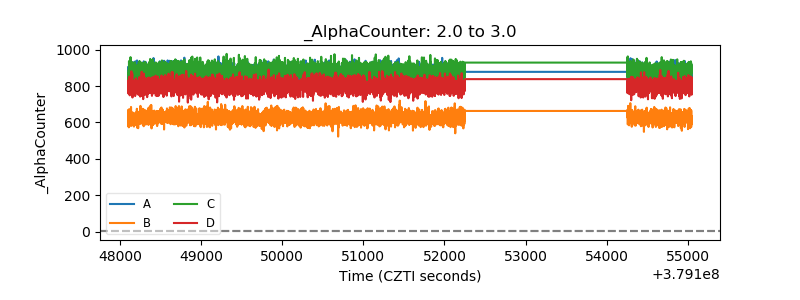 |
| _CPM_Rate | 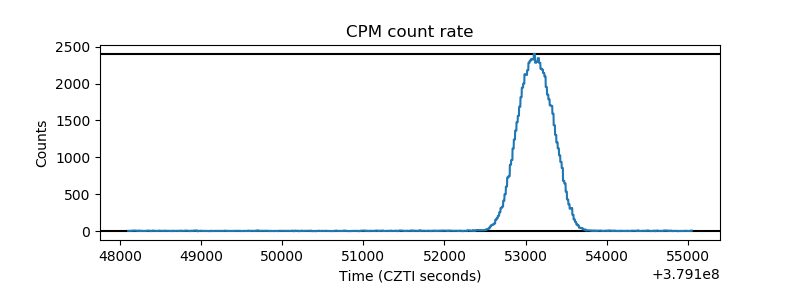 |
| CZT Counter | 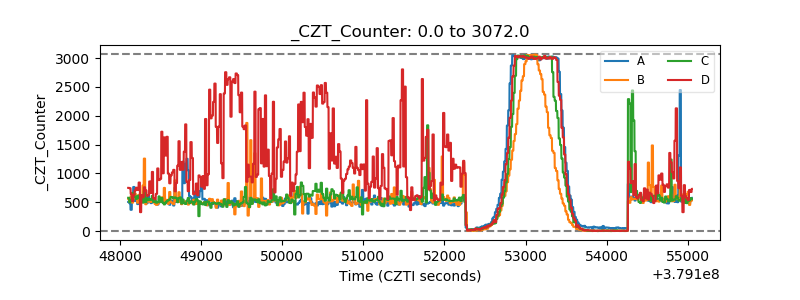 |
| +2.5 Volts monitor | 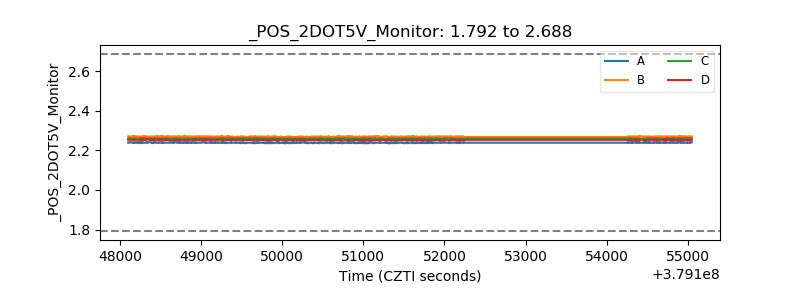 |
| +5 Volts monitor |  |
| _ROLL_ROT | 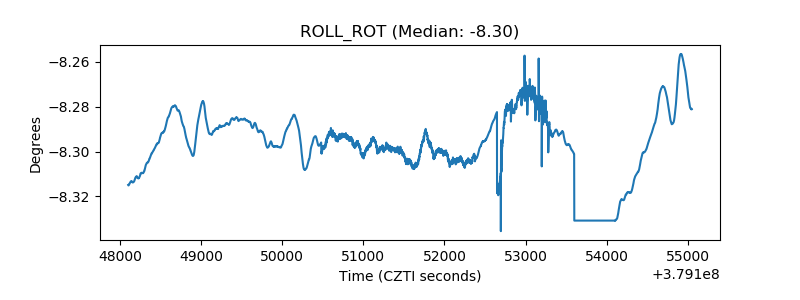 |
| _Roll_DEC | 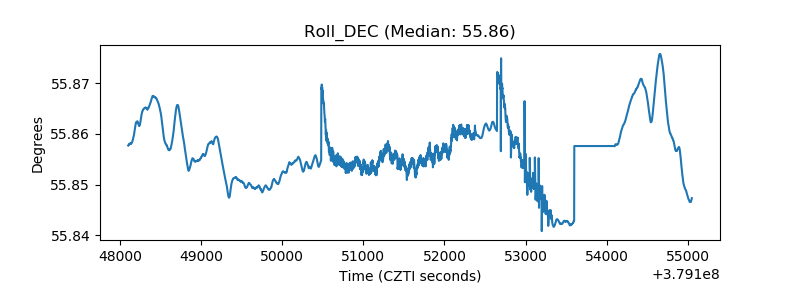 |
| _Roll_RA | 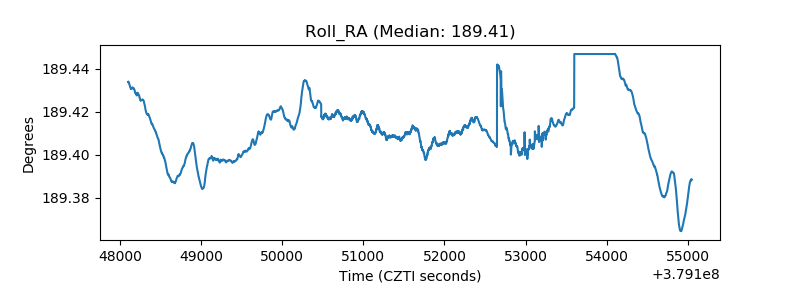 |
| Veto Counter | 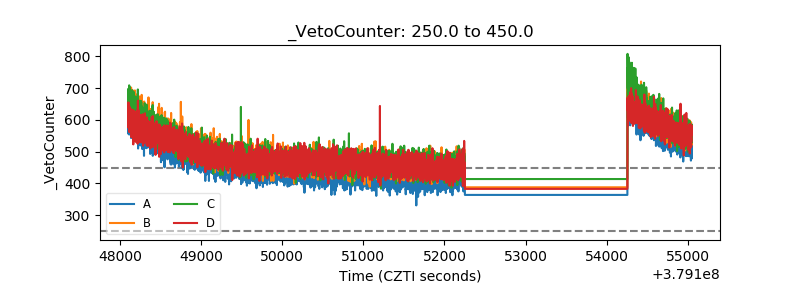 |