| Param | Original file | Final file |
|---|---|---|
| Filename | modeM0/AS1T04_088T01_9000004846_33933cztM0_level2.evt | modeM0/AS1T04_088T01_9000004846_33933cztM0_level2_quad_clean.evt |
| Size (bytes) | 605,427,840 | 56,681,280 |
| Size | 577.4 MB | 54.1 MB |
| Events in quadrant A | 6,492,345 | 195,269 |
| Events in quadrant B | 3,523,840 | 386,929 |
| Events in quadrant C | 3,138,645 | 382,891 |
| Events in quadrant D | 4,809,025 | 366,289 |
| Mode SS | |||
|---|---|---|---|
| Quadrant | BADHDUFLAG | Total packets | Discarded packets |
| A | 0 | 112 | 0 |
| B | 0 | 112 | 0 |
| C | 0 | 112 | 0 |
| D | 0 | 112 | 0 |
| Mode M9 | |||
|---|---|---|---|
| Quadrant | BADHDUFLAG | Total packets | Discarded packets |
| A | 0 | 18 | 0 |
| B | 0 | 18 | 0 |
| C | 0 | 18 | 0 |
| D | 0 | 18 | 0 |
| Mode M0 | |||
|---|---|---|---|
| Quadrant | BADHDUFLAG | Total packets | Discarded packets |
| A | 0 | 22925 | 3 |
| B | 0 | 14057 | 2 |
| C | 0 | 12498 | 2 |
| D | 0 | 18015 | 2 |
| Quadrant | Total seconds | Saturated seconds | Saturation percentage |
|---|---|---|---|
| A | 5480 | 2280 | 41.605839% |
| B | 5480 | 274 | 5.000000% |
| C | 5480 | 101 | 1.843066% |
| D | 5480 | 253 | 4.616788% |
Noise dominated data is calculated using 1-second bins in cleaned event files. If a bin has >2000 counts, and if more than 50% of those come from <1% of pixels, then it is considered to be noise-dominated and hence unusable.
| Quadrant | # 1 sec bins | Bins with >0 counts | Bins with >2000 counts | High rate bins dominated by noise | Noise dominated (total time) | Noise dominated (detector-on time) | Marked lightcurve |
|---|---|---|---|---|---|---|---|
| A | 7272 | 5480 | 1007 | 1007 | 13.85% | 18.38% | 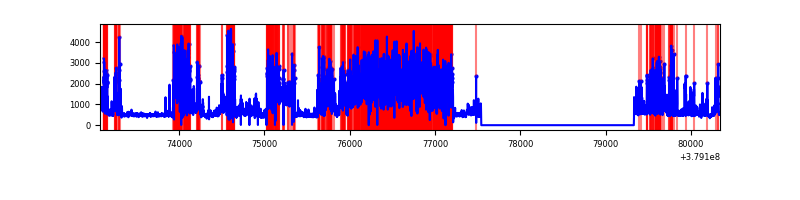 |
| B | 7272 | 5481 | 190 | 190 | 2.61% | 3.47% | 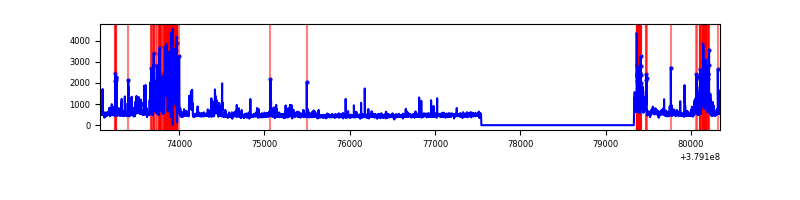 |
| C | 7272 | 5481 | 70 | 70 | 0.96% | 1.28% | 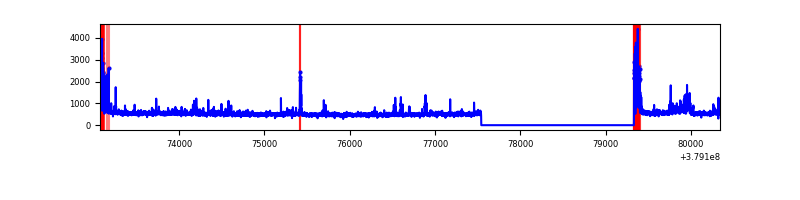 |
| D | 7272 | 5481 | 194 | 194 | 2.67% | 3.54% | 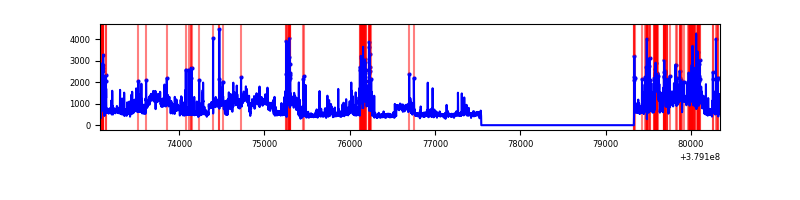 |
Top three noisy pixels from each quadrant. If the there are fewer than three noisy pixels in the level2.evt file, extra rows are filled as -1
| Pixel properties | Quadrant properties | ||||||
|---|---|---|---|---|---|---|---|
| Quadrant | DetID | PixID | Counts | Sigma | Mean | Median | Sigma |
| A | 15 | 169 | 4646450 | 48886.38 | 471 | 462 | 95.0 |
| A | 10 | 83 | 12389 | 125.5 | 471 | 462 | 95.0 |
| A | 0 | 127 | 7687 | 76.02 | 471 | 462 | 95.0 |
| B | 5 | 172 | 774857 | 6647.86 | 624 | 611 | 116.5 |
| B | 15 | 35 | 49883 | 423.06 | 624 | 611 | 116.5 |
| B | 0 | 190 | 48688 | 412.8 | 624 | 611 | 116.5 |
| C | 0 | 10 | 278186 | 1938.18 | 618 | 621 | 143.2 |
| C | 15 | 214 | 237131 | 1651.51 | 618 | 621 | 143.2 |
| C | 3 | 233 | 57696 | 398.54 | 618 | 621 | 143.2 |
| D | 8 | 195 | 1390752 | 8104.64 | 615 | 601 | 171.5 |
| D | 2 | 250 | 278523 | 1620.3 | 615 | 601 | 171.5 |
| D | 12 | 233 | 196661 | 1143.04 | 615 | 601 | 171.5 |
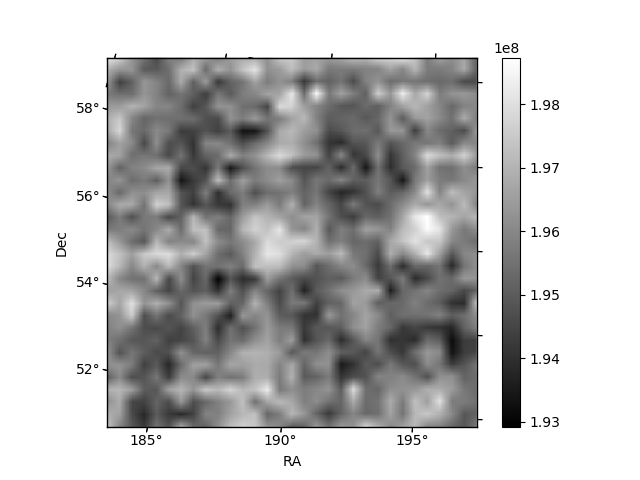
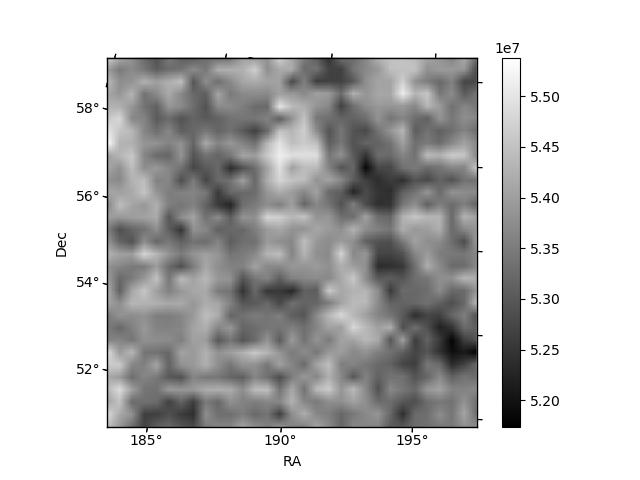
Histogram calculated using DETX and DETY for each event in the final _common_clean file
| Quadrant A | 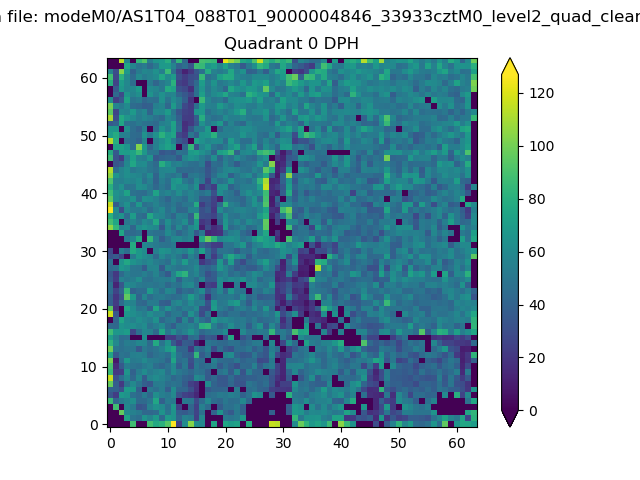 |
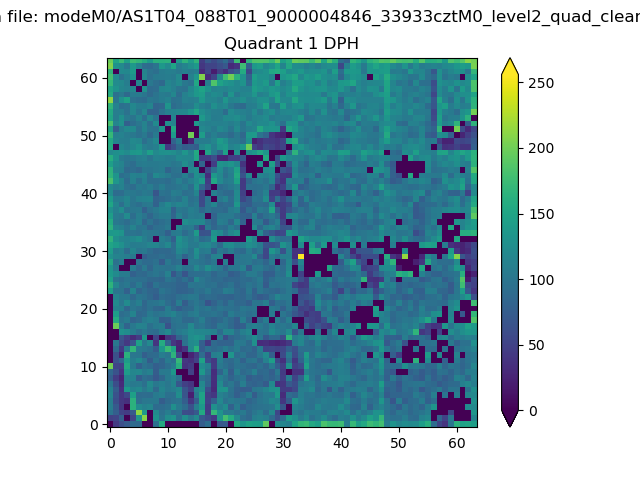 |
Quadrant B |
|---|---|---|---|
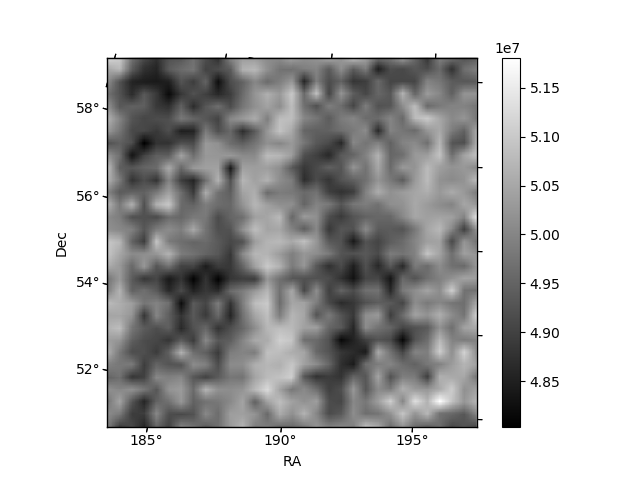
| Quadrant D |  |
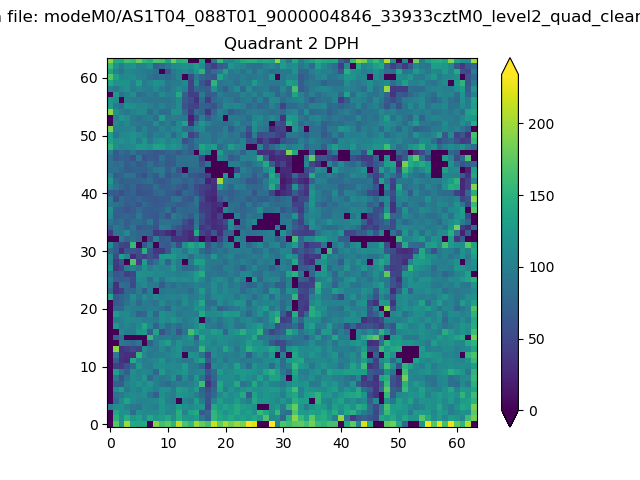 |
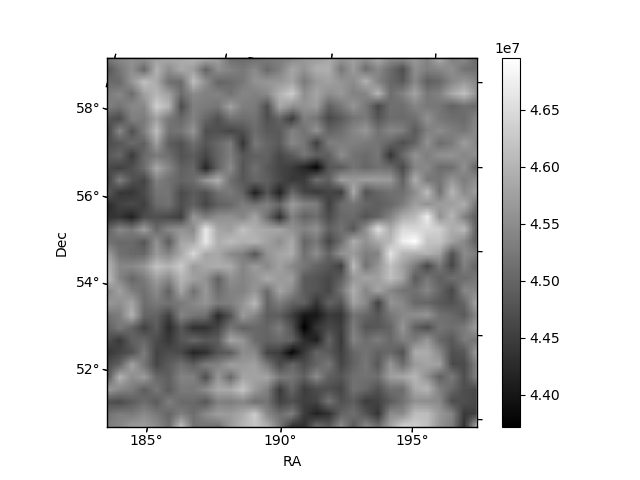
Quadrant C |
| Plot type | Count rate plots | Images |
|---|---|---|
| Comparison with Poisson distribution Blue bars denote a histogram of data divided into 1 sec bins. Red curve is a Poisson curve with rate = median count rate of data. |
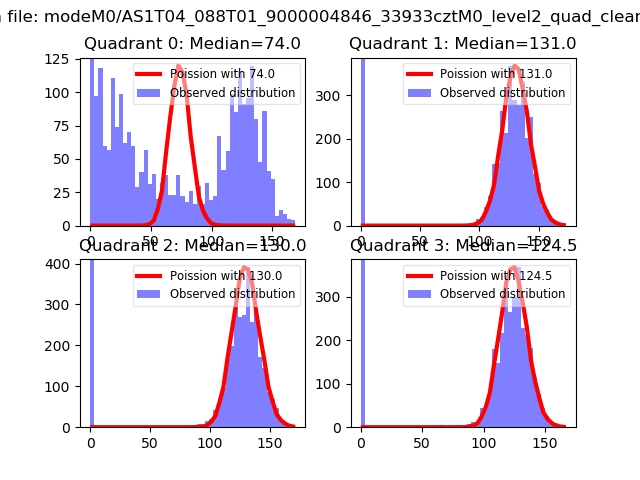 |
 |
| Quadrant-wise count rates Data is divided into 100 sec bins |
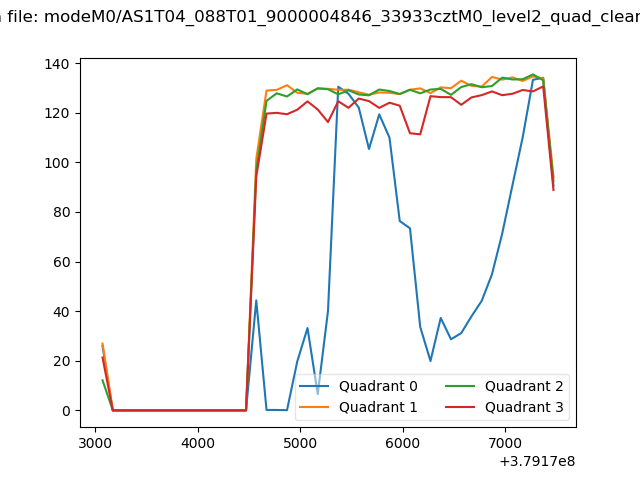 |
|
| Module-wise count rates for Quadrant A Data is divided into 100 sec bins |
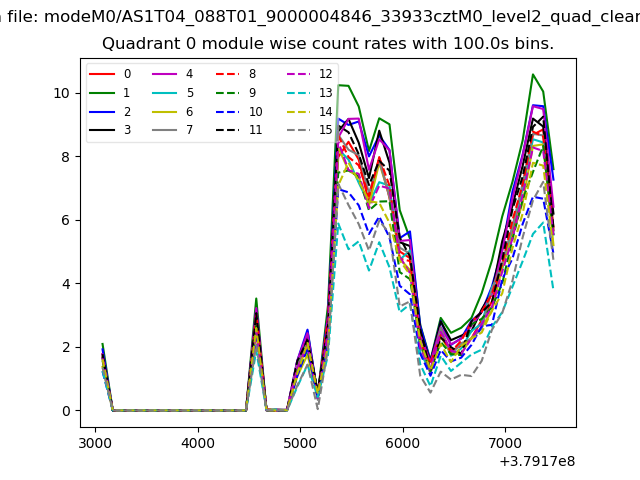 |
 |
| Module-wise count rates for Quadrant B Data is divided into 100 sec bins |
 |
 |
| Module-wise count rates for Quadrant C Data is divided into 100 sec bins |
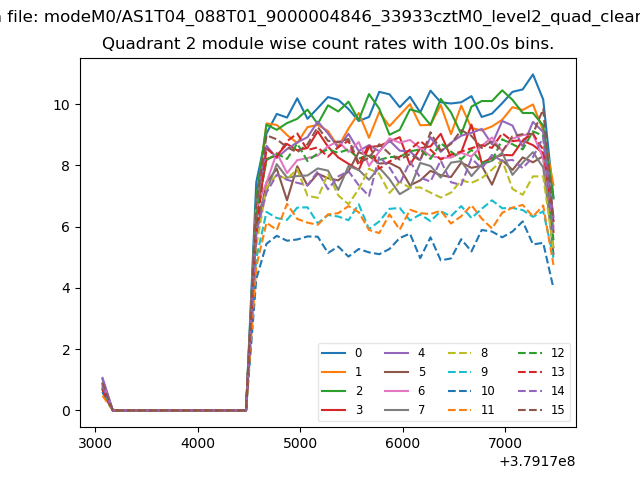 |
 |
| Module-wise count rates for Quadrant D Data is divided into 100 sec bins |
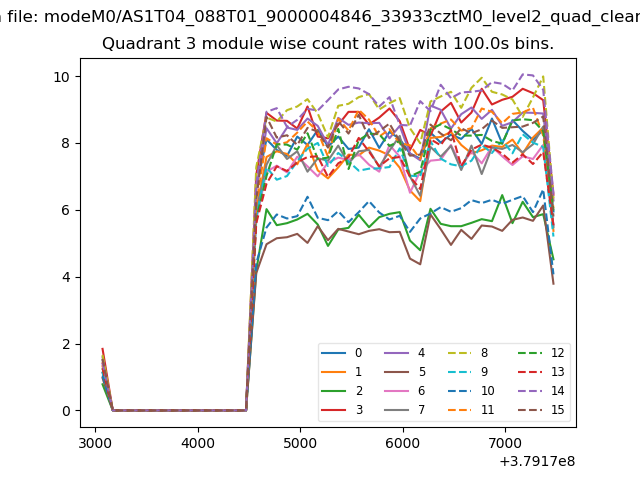 |
 |
| Parameter | Plot |
|---|---|
| CZT HV Monitor | 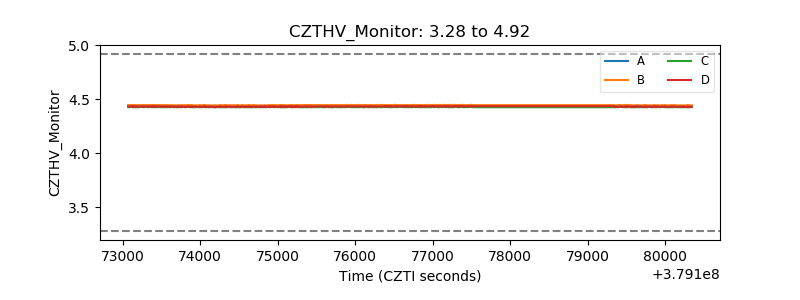 |
| D_VDD | 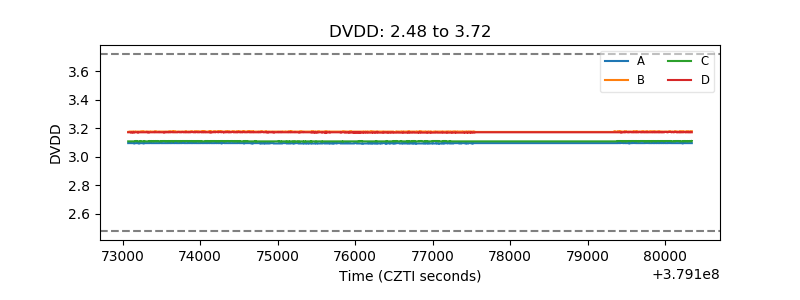 |
| Temperature 1 | 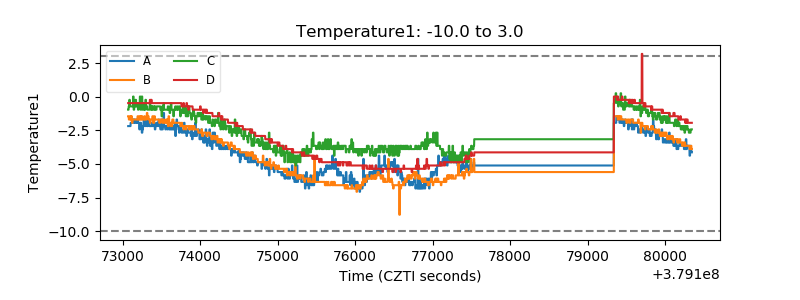 |
| Veto HV Monitor | 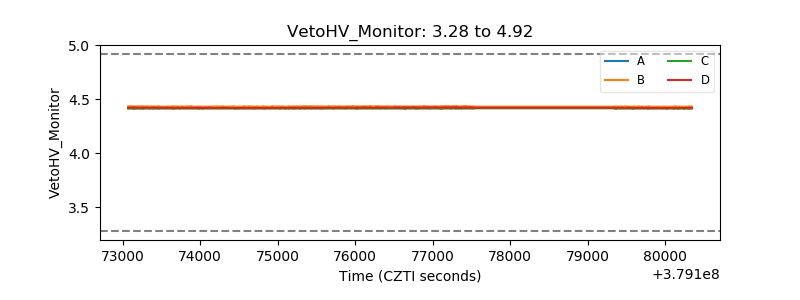 |
| Veto LLD | 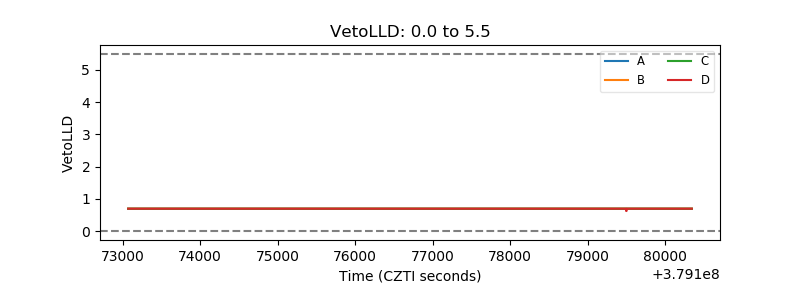 |
| Alpha Counter |  |
| _CPM_Rate |  |
| CZT Counter |  |
| +2.5 Volts monitor | 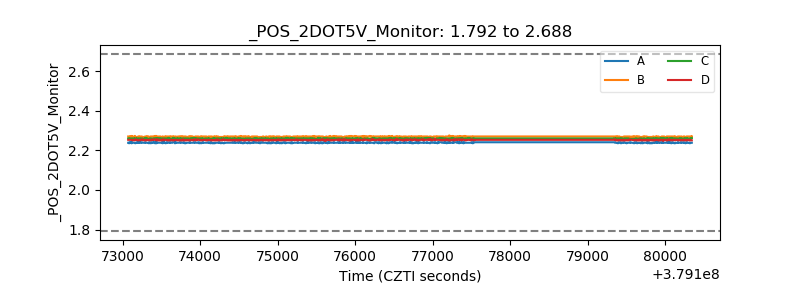 |
| +5 Volts monitor |  |
| _ROLL_ROT |  |
| _Roll_DEC | 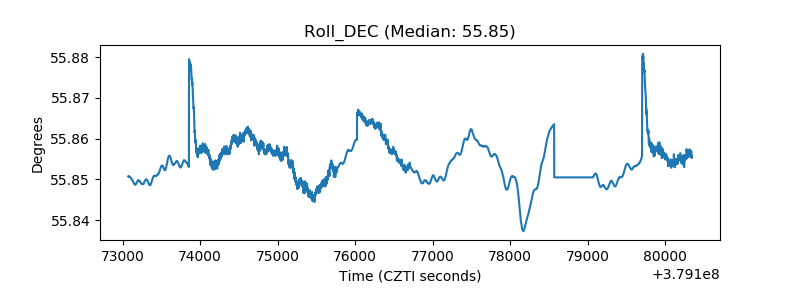 |
| _Roll_RA |  |
| Veto Counter | 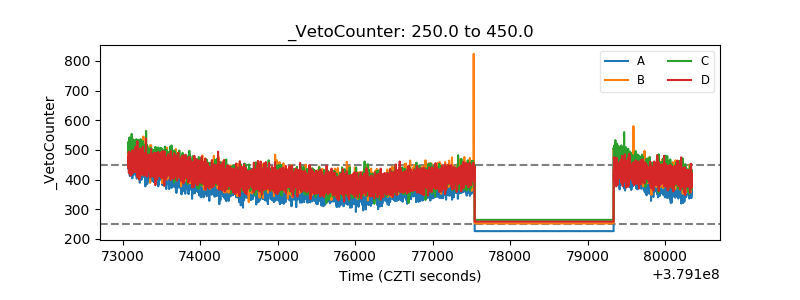 |