| Param | Original file | Final file |
|---|---|---|
| Filename | modeM0/AS1T04_088T01_9000004846_33934cztM0_level2.evt | modeM0/AS1T04_088T01_9000004846_33934cztM0_level2_quad_clean.evt |
| Size (bytes) | 564,099,840 | 77,558,400 |
| Size | 538.0 MB | 74.0 MB |
| Events in quadrant A | 4,274,912 | 493,638 |
| Events in quadrant B | 3,866,518 | 491,743 |
| Events in quadrant C | 3,184,590 | 497,675 |
| Events in quadrant D | 5,369,644 | 464,463 |
| Mode SS | |||
|---|---|---|---|
| Quadrant | BADHDUFLAG | Total packets | Discarded packets |
| A | 0 | 118 | 0 |
| B | 0 | 118 | 0 |
| C | 0 | 118 | 0 |
| D | 0 | 118 | 0 |
| Mode M9 | |||
|---|---|---|---|
| Quadrant | BADHDUFLAG | Total packets | Discarded packets |
| A | 0 | 16 | 0 |
| B | 0 | 16 | 0 |
| C | 0 | 16 | 0 |
| D | 0 | 17 | 0 |
| Mode M0 | |||
|---|---|---|---|
| Quadrant | BADHDUFLAG | Total packets | Discarded packets |
| A | 0 | 16581 | 3 |
| B | 0 | 15218 | 2 |
| C | 0 | 12838 | 2 |
| D | 0 | 19870 | 2 |
| Quadrant | Total seconds | Saturated seconds | Saturation percentage |
|---|---|---|---|
| A | 5731 | 360 | 6.281626% |
| B | 5731 | 268 | 4.676322% |
| C | 5731 | 108 | 1.884488% |
| D | 5731 | 455 | 7.939278% |
Noise dominated data is calculated using 1-second bins in cleaned event files. If a bin has >2000 counts, and if more than 50% of those come from <1% of pixels, then it is considered to be noise-dominated and hence unusable.
| Quadrant | # 1 sec bins | Bins with >0 counts | Bins with >2000 counts | High rate bins dominated by noise | Noise dominated (total time) | Noise dominated (detector-on time) | Marked lightcurve |
|---|---|---|---|---|---|---|---|
| A | 7193 | 5732 | 199 | 199 | 2.77% | 3.47% | 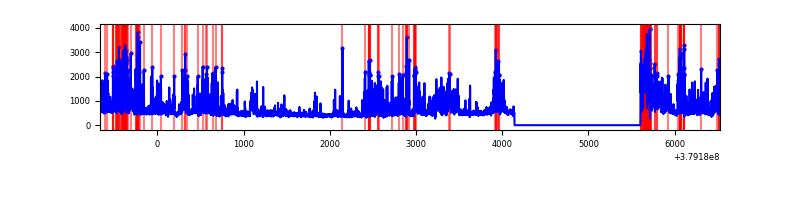 |
| B | 7193 | 5732 | 181 | 181 | 2.52% | 3.16% | 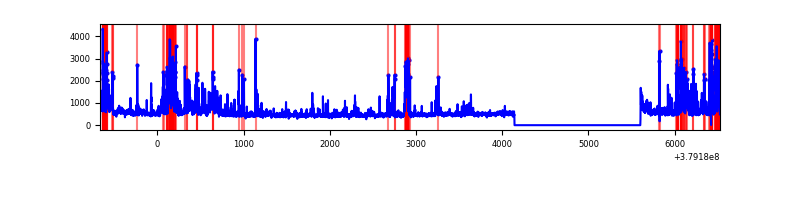 |
| C | 7193 | 5732 | 69 | 69 | 0.96% | 1.20% | 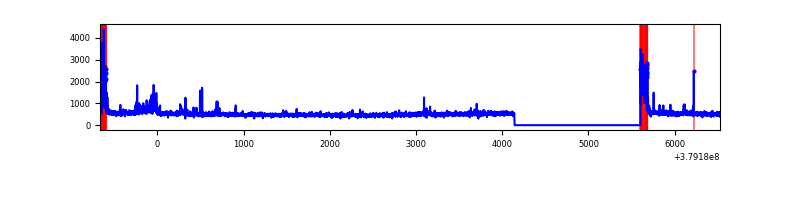 |
| D | 7193 | 5732 | 338 | 338 | 4.70% | 5.90% | 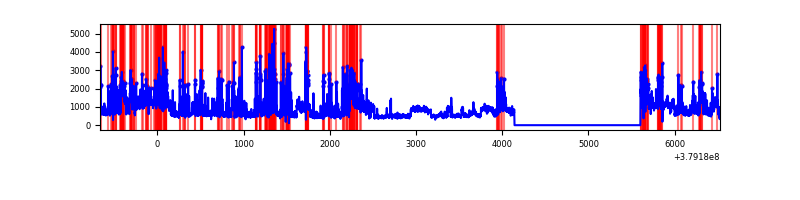 |
Top three noisy pixels from each quadrant. If the there are fewer than three noisy pixels in the level2.evt file, extra rows are filled as -1
| Pixel properties | Quadrant properties | ||||||
|---|---|---|---|---|---|---|---|
| Quadrant | DetID | PixID | Counts | Sigma | Mean | Median | Sigma |
| A | 15 | 169 | 1732342 | 13246.55 | 651 | 638 | 130.7 |
| A | 10 | 83 | 13697 | 99.89 | 651 | 638 | 130.7 |
| A | 13 | 6 | 10382 | 74.54 | 651 | 638 | 130.7 |
| B | 5 | 172 | 787571 | 6398.83 | 647 | 630 | 123.0 |
| B | 0 | 189 | 133780 | 1082.68 | 647 | 630 | 123.0 |
| B | 0 | 229 | 121068 | 979.31 | 647 | 630 | 123.0 |
| C | 0 | 10 | 298787 | 2006.65 | 639 | 642 | 148.6 |
| C | 15 | 214 | 248561 | 1668.61 | 639 | 642 | 148.6 |
| C | 5 | 1 | 52164 | 346.77 | 639 | 642 | 148.6 |
| D | 8 | 195 | 1289826 | 7606.85 | 625 | 610 | 169.5 |
| D | 13 | 249 | 631406 | 3721.93 | 625 | 610 | 169.5 |
| D | 12 | 233 | 260050 | 1530.79 | 625 | 610 | 169.5 |
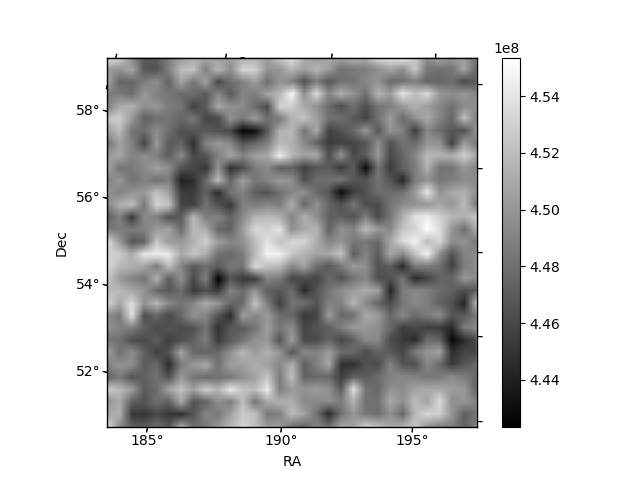
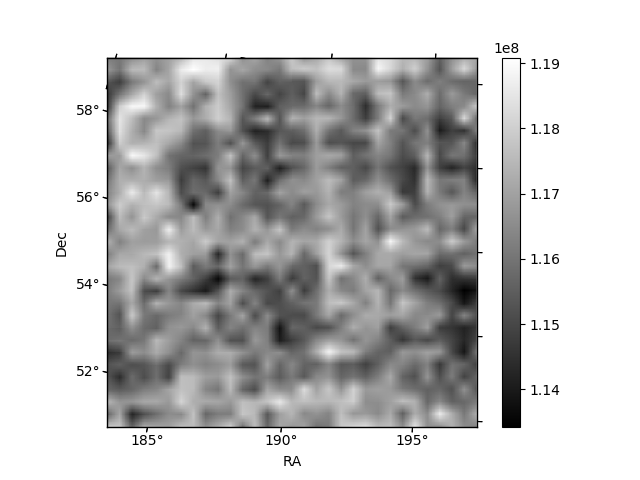
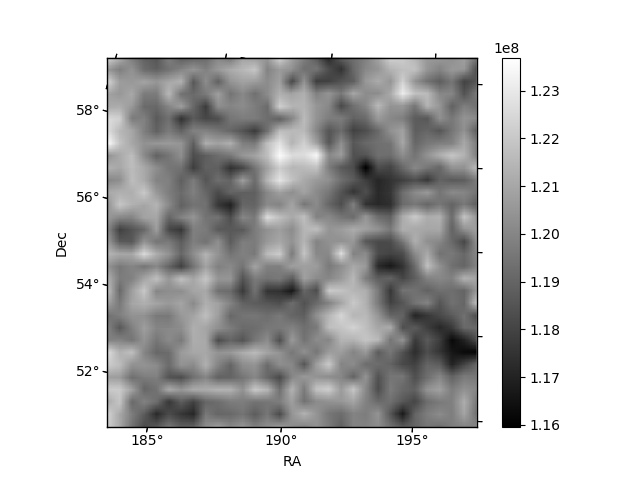
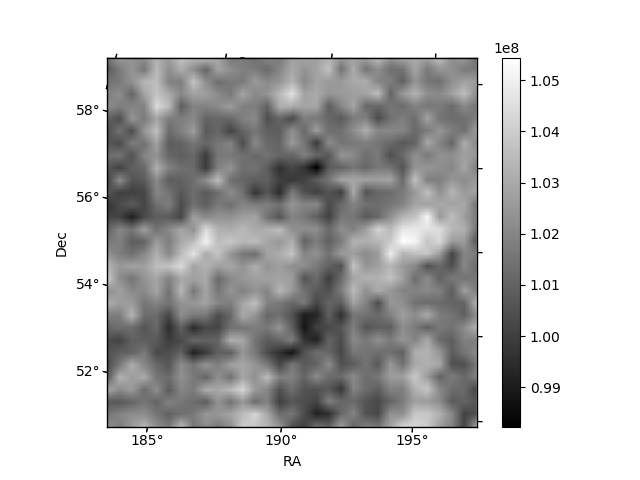
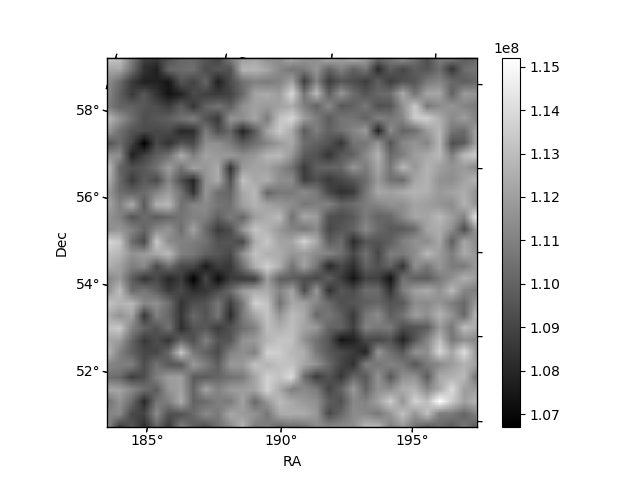
Histogram calculated using DETX and DETY for each event in the final _common_clean file
| Quadrant A | 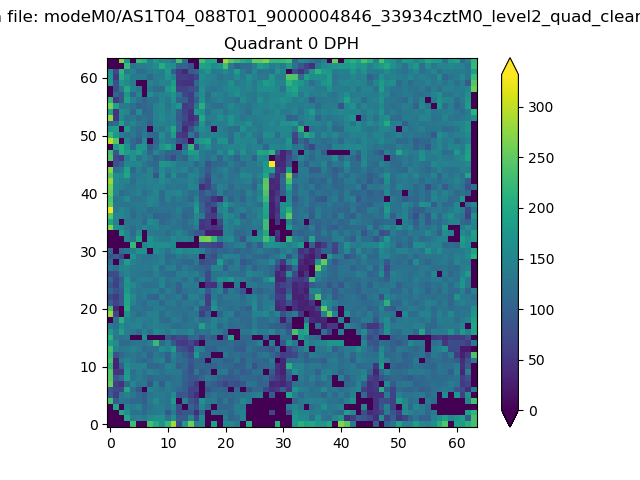 |
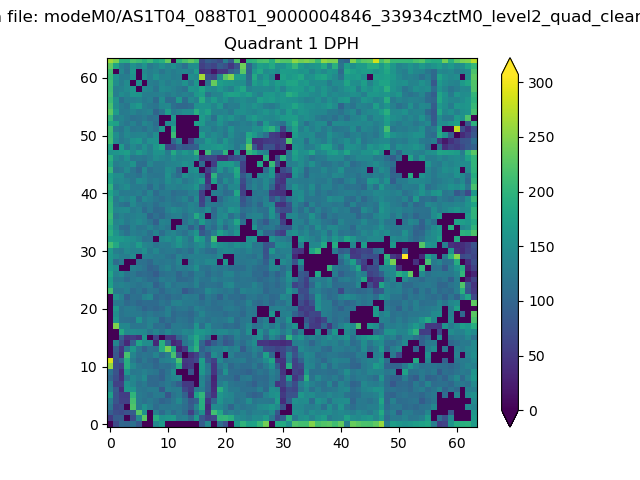 |
Quadrant B |
|---|---|---|---|
| Quadrant D |  |
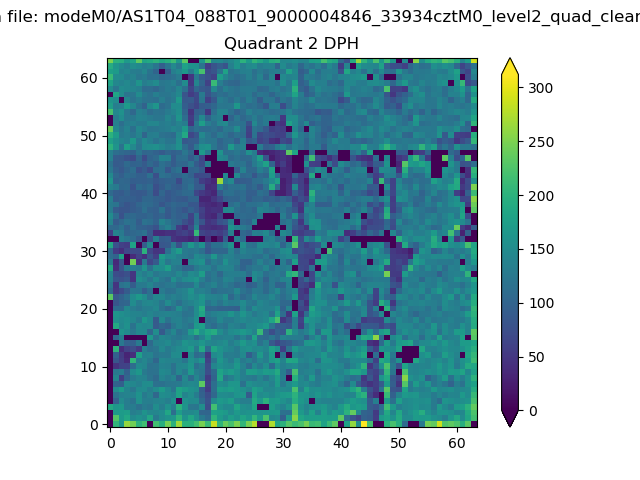 |
Quadrant C |
| Plot type | Count rate plots | Images |
|---|---|---|
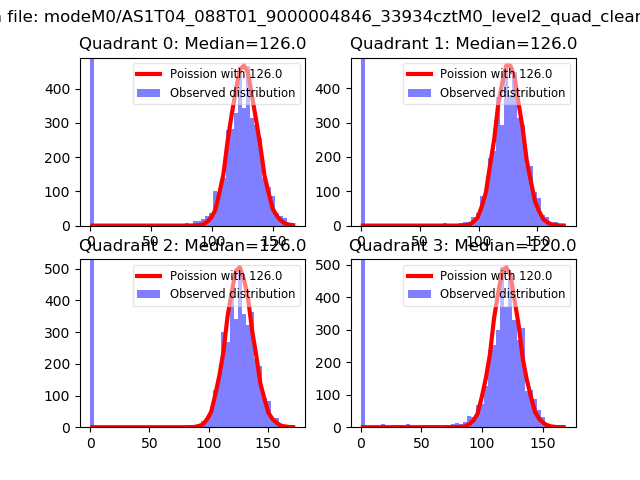
| Comparison with Poisson distribution Blue bars denote a histogram of data divided into 1 sec bins. Red curve is a Poisson curve with rate = median count rate of data. |
 |
 |
| Quadrant-wise count rates Data is divided into 100 sec bins |
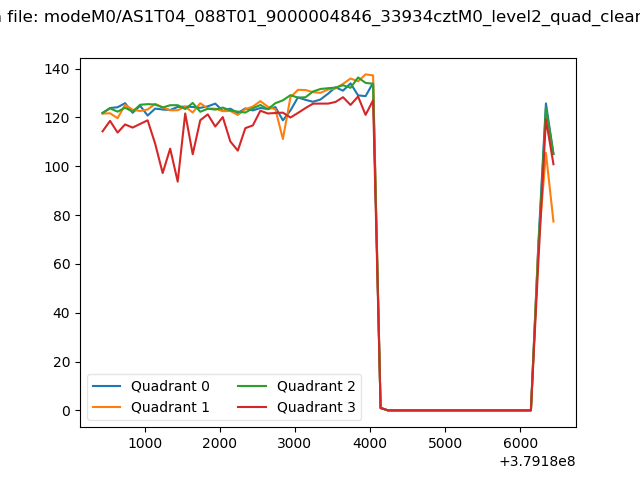 |
|
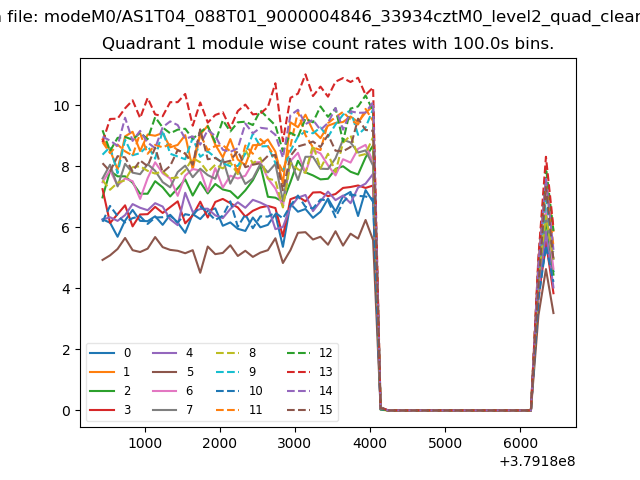
| Module-wise count rates for Quadrant A Data is divided into 100 sec bins |
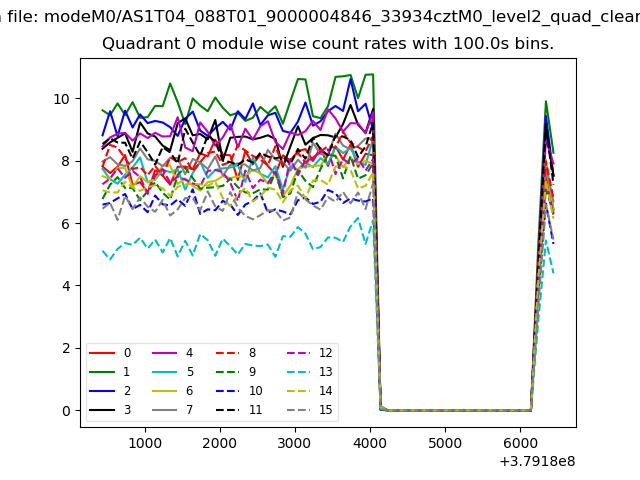 |
 |
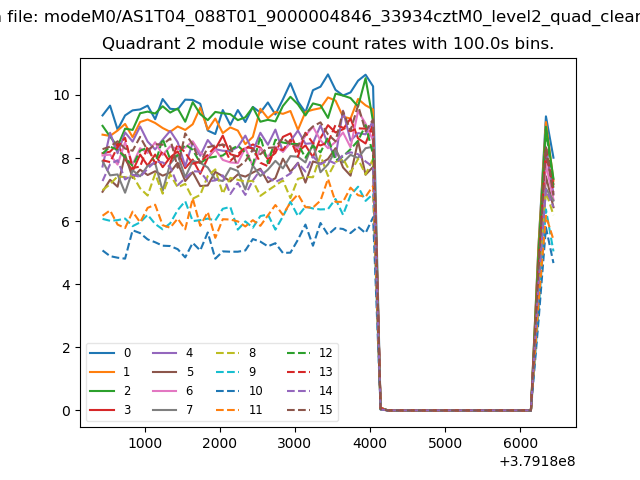
| Module-wise count rates for Quadrant B Data is divided into 100 sec bins |
 |
 |
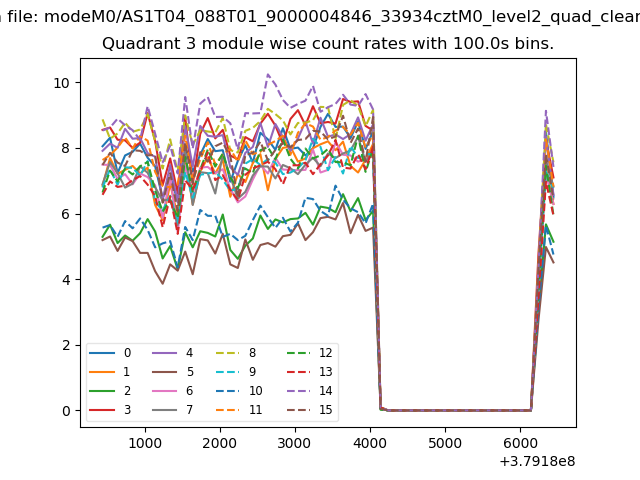
| Module-wise count rates for Quadrant C Data is divided into 100 sec bins |
 |
 |
| Module-wise count rates for Quadrant D Data is divided into 100 sec bins |
 |
 |
| Parameter | Plot |
|---|---|
| CZT HV Monitor |  |
| D_VDD | 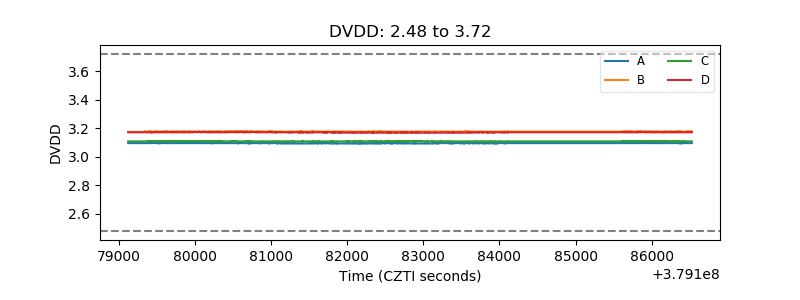 |
| Temperature 1 | 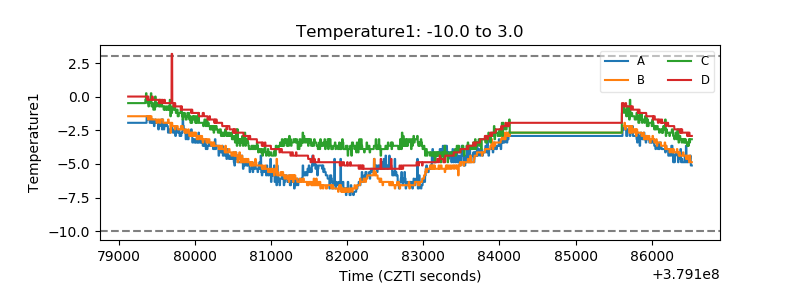 |
| Veto HV Monitor | 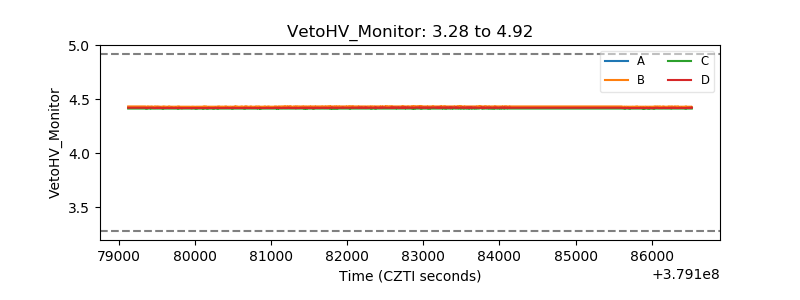 |
| Veto LLD | 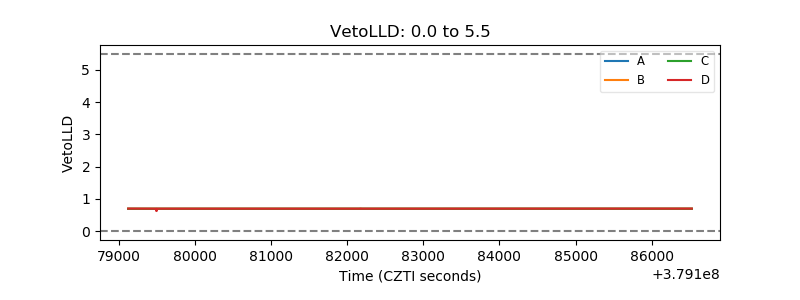 |
| Alpha Counter | 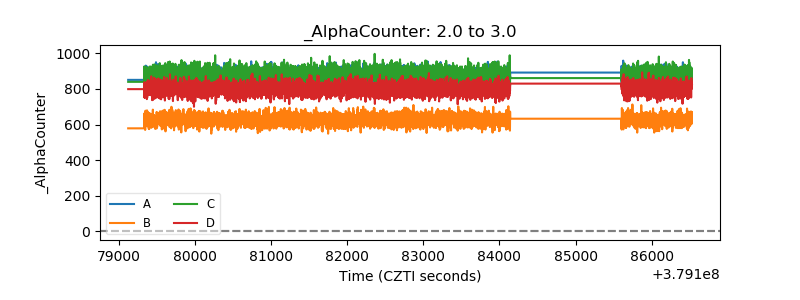 |
| _CPM_Rate |  |
| CZT Counter | 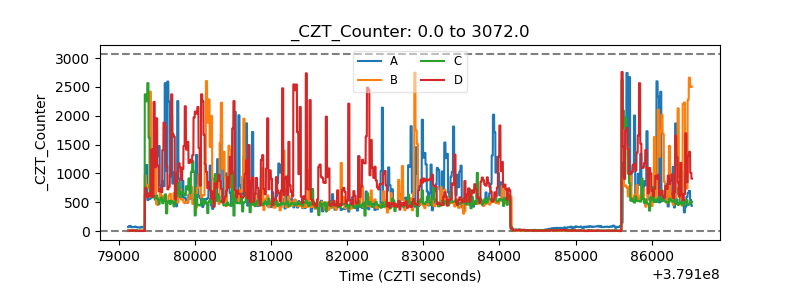 |
| +2.5 Volts monitor |  |
| +5 Volts monitor |  |
| _ROLL_ROT | 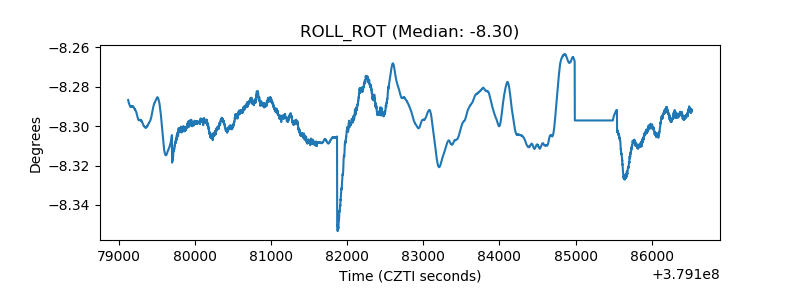 |
| _Roll_DEC | 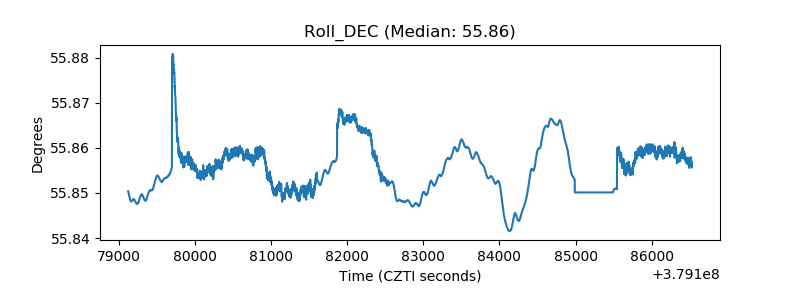 |
| _Roll_RA | 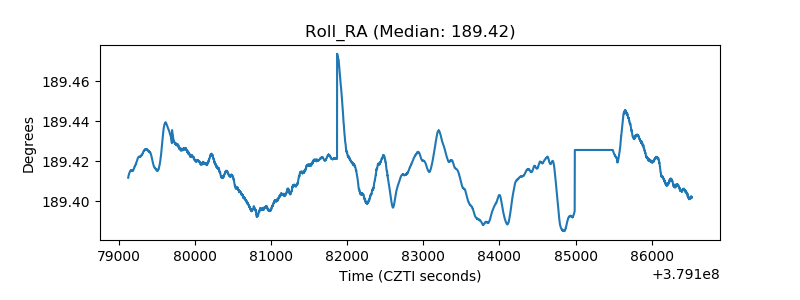 |
| Veto Counter | 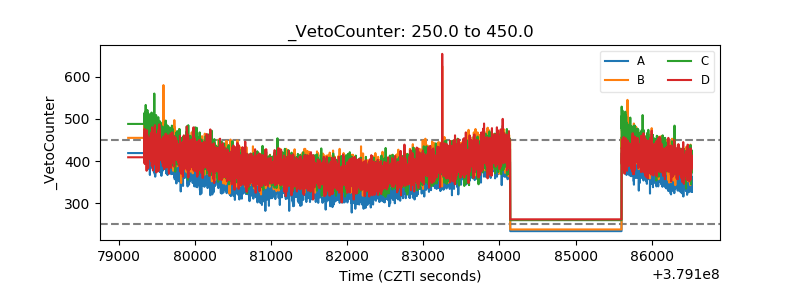 |