| Param | Original file | Final file |
|---|---|---|
| Filename | modeM0/AS1T04_088T01_9000004846_33935cztM0_level2.evt | modeM0/AS1T04_088T01_9000004846_33935cztM0_level2_quad_clean.evt |
| Size (bytes) | 260,386,560 | 28,209,600 |
| Size | 248.3 MB | 26.9 MB |
| Events in quadrant A | 2,734,010 | 147,007 |
| Events in quadrant B | 1,579,945 | 181,489 |
| Events in quadrant C | 1,266,175 | 187,090 |
| Events in quadrant D | 2,153,488 | 177,521 |
| Mode SS | |||
|---|---|---|---|
| Quadrant | BADHDUFLAG | Total packets | Discarded packets |
| A | 0 | 44 | 0 |
| B | 0 | 44 | 0 |
| C | 0 | 44 | 0 |
| D | 0 | 44 | 0 |
| Mode M9 | |||
|---|---|---|---|
| Quadrant | BADHDUFLAG | Total packets | Discarded packets |
| A | 1 | 140470221843240 | 46 |
| B | 1 | -1 | -1 |
| C | 1 | -1 | -1 |
| D | 1 | -1 | -1 |
| Mode M0 | |||
|---|---|---|---|
| Quadrant | BADHDUFLAG | Total packets | Discarded packets |
| A | 0 | 9646 | 1 |
| B | 0 | 6230 | 1 |
| C | 0 | 5040 | 1 |
| D | 0 | 7958 | 1 |
| Quadrant | Total seconds | Saturated seconds | Saturation percentage |
|---|---|---|---|
| A | 2220 | 591 | 26.621622% |
| B | 2220 | 160 | 7.207207% |
| C | 2220 | 53 | 2.387387% |
| D | 2220 | 136 | 6.126126% |
Noise dominated data is calculated using 1-second bins in cleaned event files. If a bin has >2000 counts, and if more than 50% of those come from <1% of pixels, then it is considered to be noise-dominated and hence unusable.
| Quadrant | # 1 sec bins | Bins with >0 counts | Bins with >2000 counts | High rate bins dominated by noise | Noise dominated (total time) | Noise dominated (detector-on time) | Marked lightcurve |
|---|---|---|---|---|---|---|---|
| A | 2219 | 2219 | 492 | 492 | 22.17% | 22.17% | 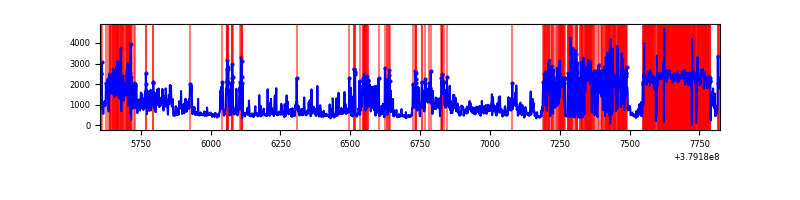 |
| B | 2220 | 2220 | 104 | 104 | 4.68% | 4.68% | 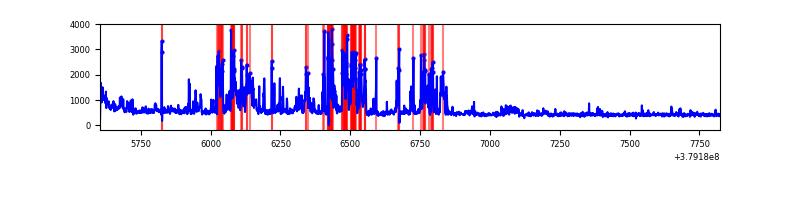 |
| C | 2220 | 2220 | 35 | 35 | 1.58% | 1.58% | 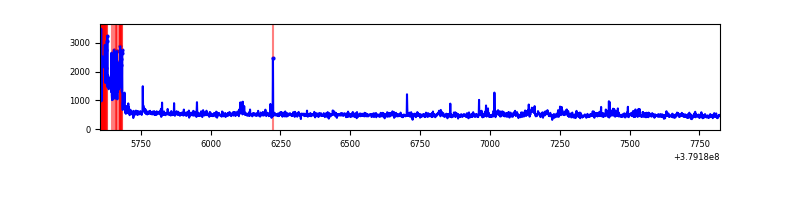 |
| D | 2220 | 2220 | 86 | 86 | 3.87% | 3.87% | 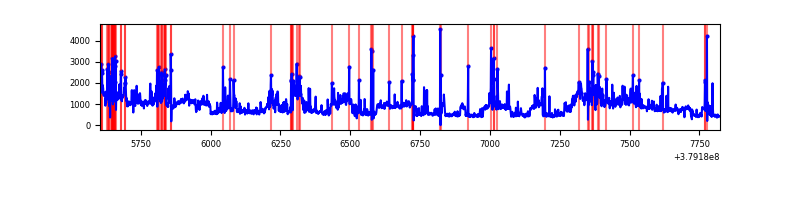 |
Top three noisy pixels from each quadrant. If the there are fewer than three noisy pixels in the level2.evt file, extra rows are filled as -1
| Pixel properties | Quadrant properties | ||||||
|---|---|---|---|---|---|---|---|
| Quadrant | DetID | PixID | Counts | Sigma | Mean | Median | Sigma |
| A | 15 | 169 | 1889492 | 42002.33 | 213 | 208 | 45.0 |
| A | 13 | 6 | 7358 | 158.96 | 213 | 208 | 45.0 |
| A | 10 | 83 | 6095 | 130.88 | 213 | 208 | 45.0 |
| B | 5 | 172 | 383877 | 8087.33 | 243 | 237 | 47.4 |
| B | 0 | 229 | 136039 | 2862.78 | 243 | 237 | 47.4 |
| B | 0 | 190 | 27940 | 583.99 | 243 | 237 | 47.4 |
| C | 0 | 10 | 174343 | 3006.44 | 245 | 246 | 57.9 |
| C | 15 | 214 | 96271 | 1658.24 | 245 | 246 | 57.9 |
| C | 14 | 67 | 28165 | 482.13 | 245 | 246 | 57.9 |
| D | 8 | 195 | 645848 | 9990.54 | 240 | 234 | 64.6 |
| D | 13 | 249 | 207862 | 3212.94 | 240 | 234 | 64.6 |
| D | 2 | 250 | 112250 | 1733.39 | 240 | 234 | 64.6 |
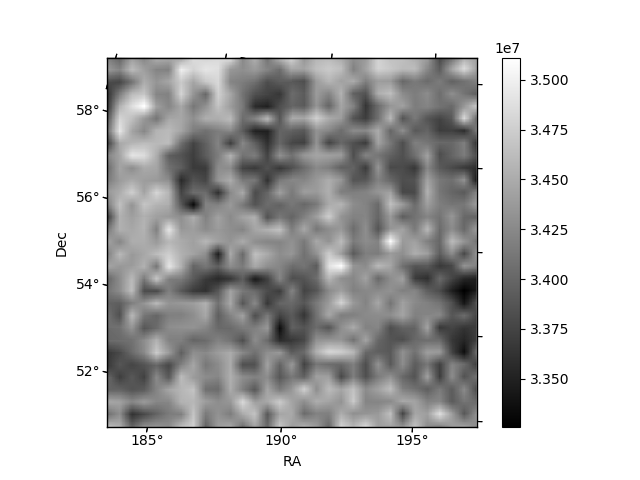
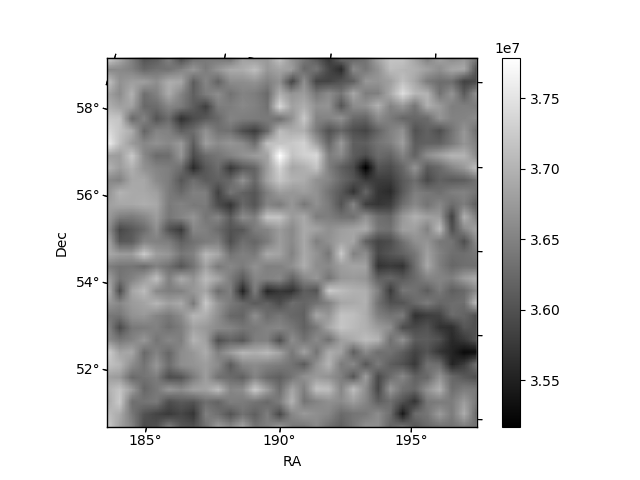
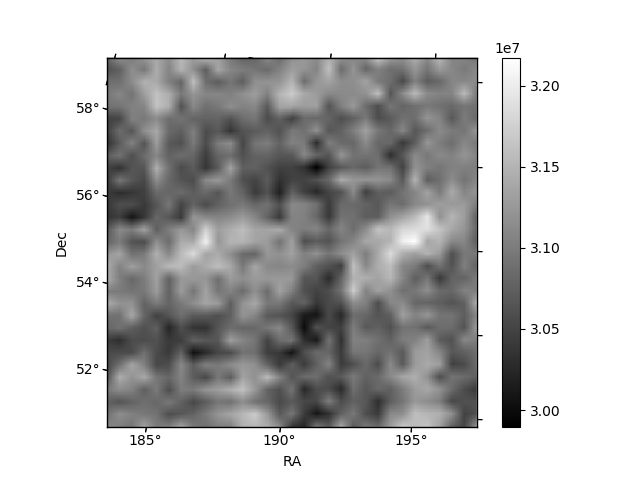
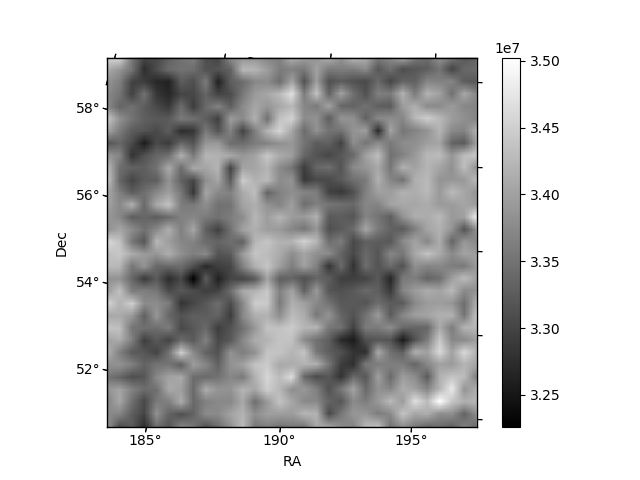
Histogram calculated using DETX and DETY for each event in the final _common_clean file
| Quadrant A | 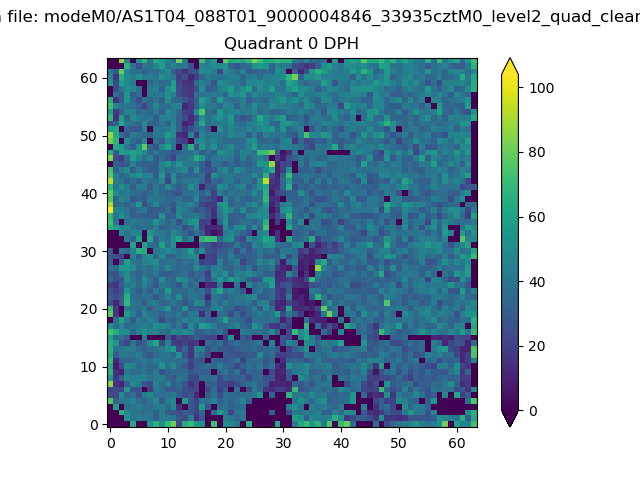 |
 |
Quadrant B |
|---|---|---|---|
| Quadrant D | 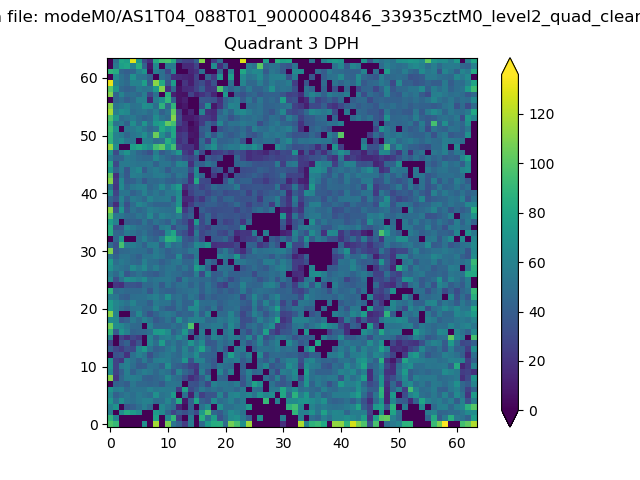 |
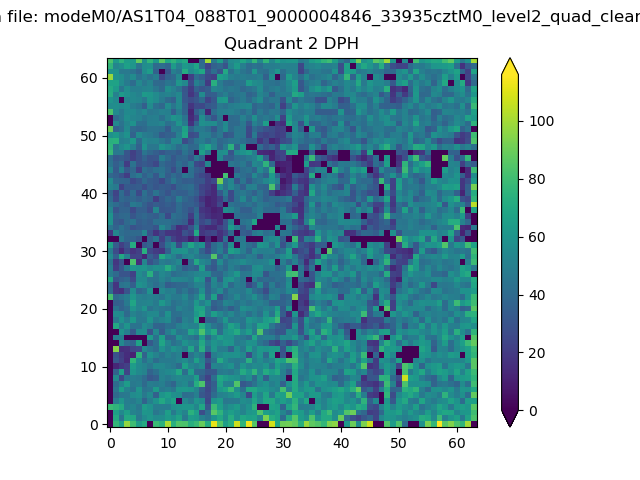 |
Quadrant C |
| Plot type | Count rate plots | Images |
|---|---|---|
| Comparison with Poisson distribution Blue bars denote a histogram of data divided into 1 sec bins. Red curve is a Poisson curve with rate = median count rate of data. |
 |
 |
| Quadrant-wise count rates Data is divided into 100 sec bins |
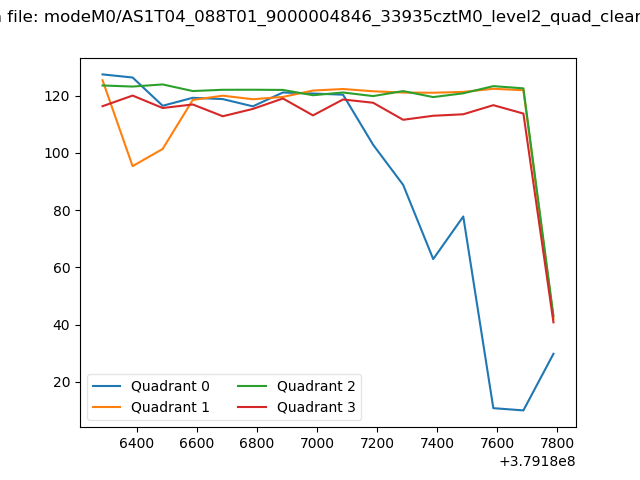 |
|
| Module-wise count rates for Quadrant A Data is divided into 100 sec bins |
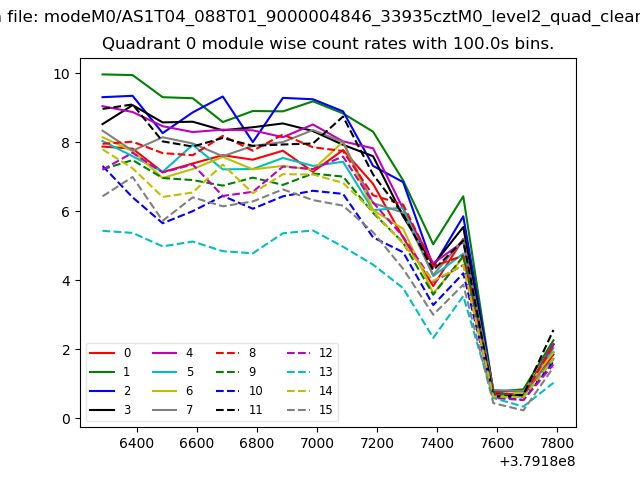 |
 |
| Module-wise count rates for Quadrant B Data is divided into 100 sec bins |
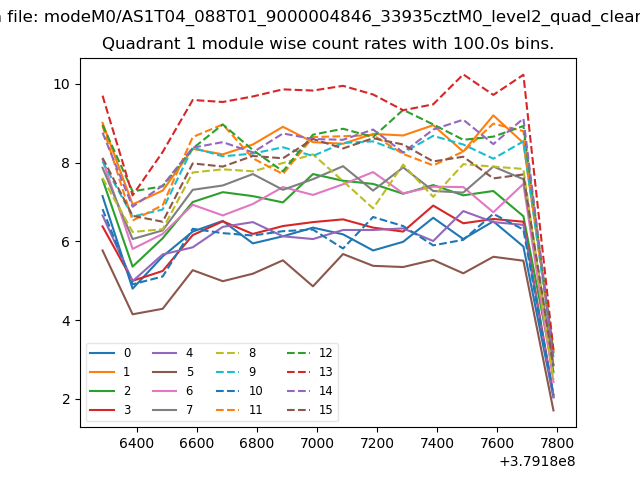 |
 |
| Module-wise count rates for Quadrant C Data is divided into 100 sec bins |
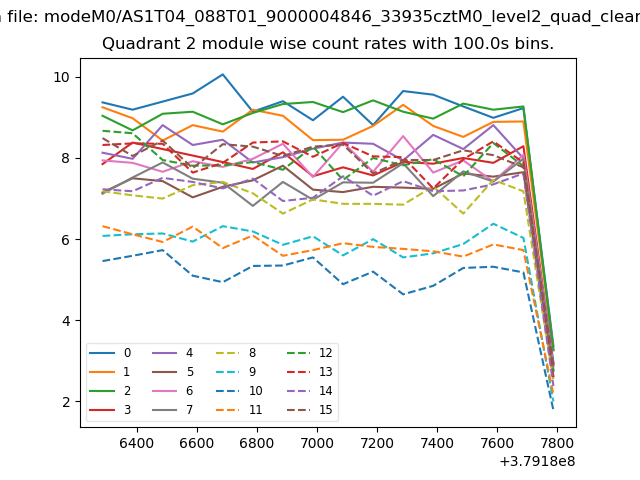 |
 |
| Module-wise count rates for Quadrant D Data is divided into 100 sec bins |
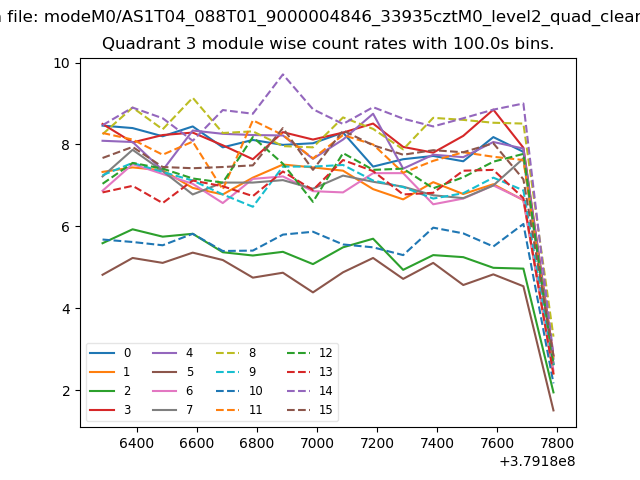 |
 |
| Parameter | Plot |
|---|---|
| CZT HV Monitor | 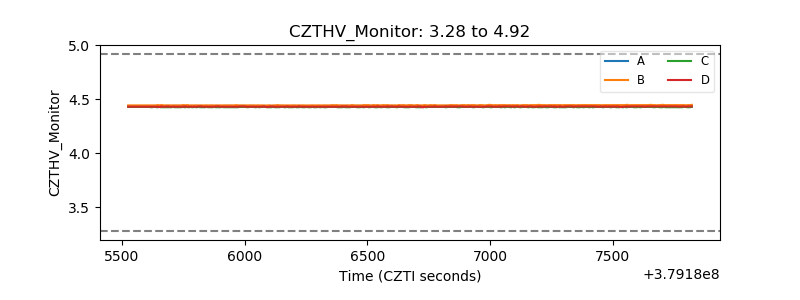 |
| D_VDD | 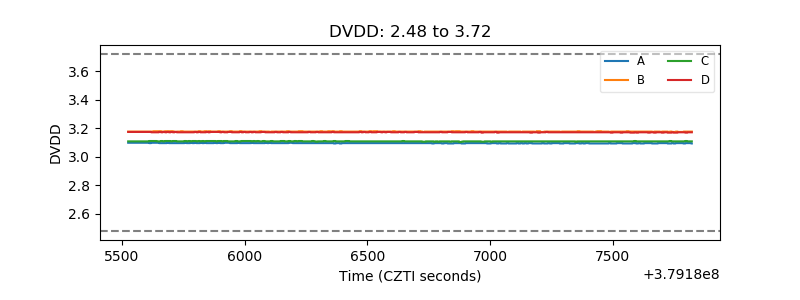 |
| Temperature 1 | 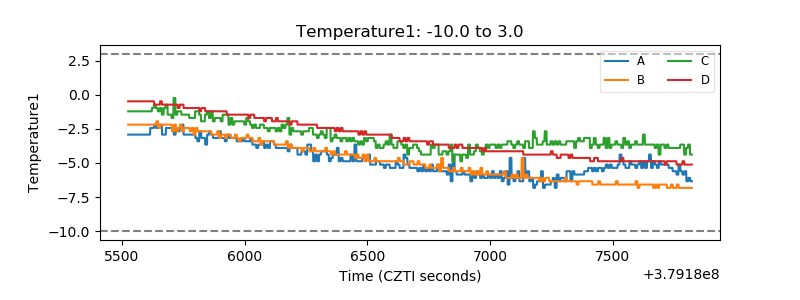 |
| Veto HV Monitor | 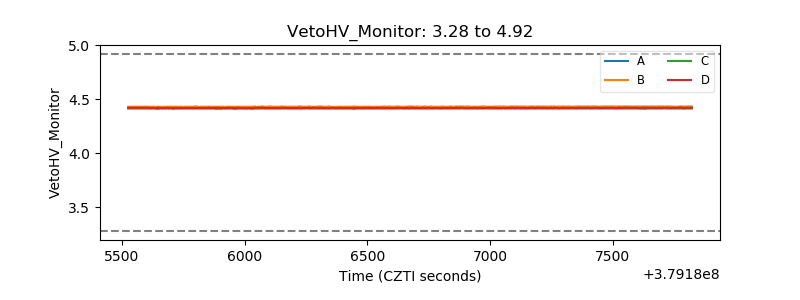 |
| Veto LLD | 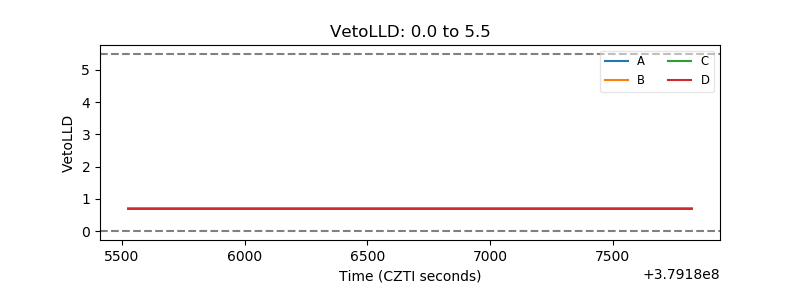 |
| Alpha Counter | 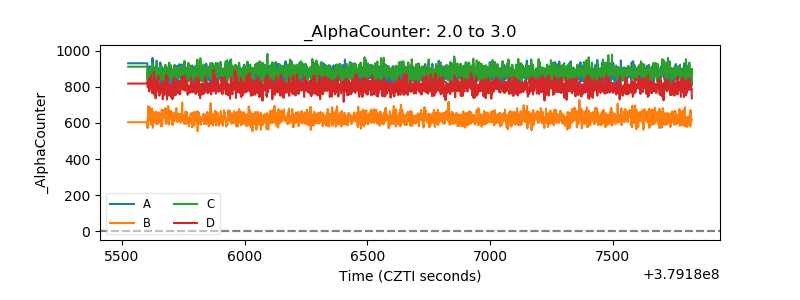 |
| _CPM_Rate | 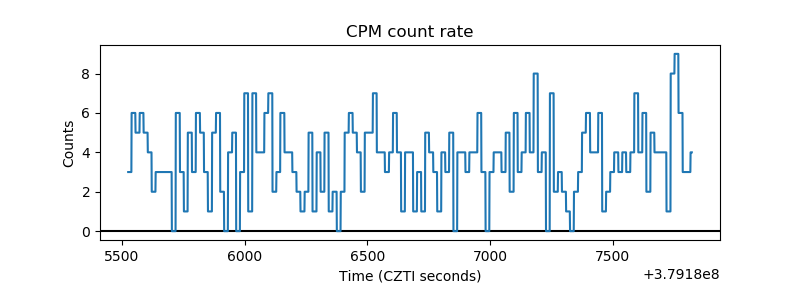 |
| CZT Counter | 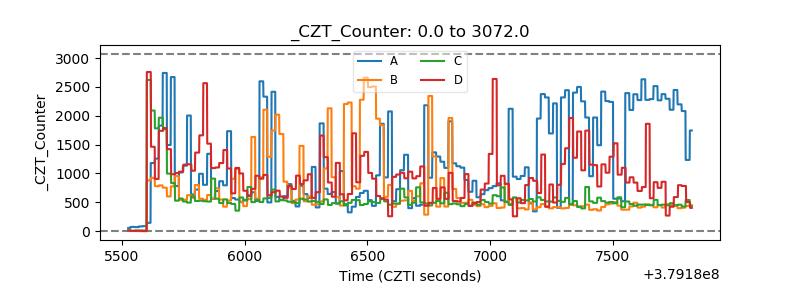 |
| +2.5 Volts monitor |  |
| +5 Volts monitor |  |
| _ROLL_ROT | 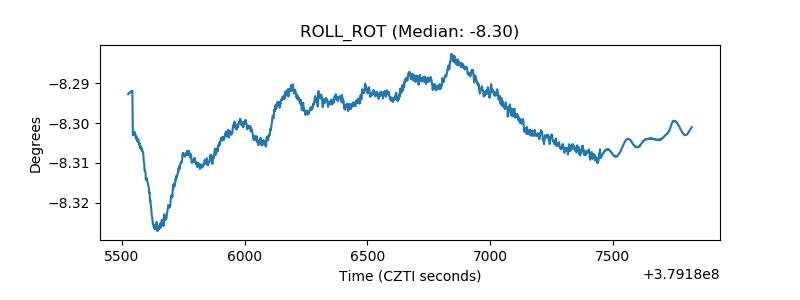 |
| _Roll_DEC | 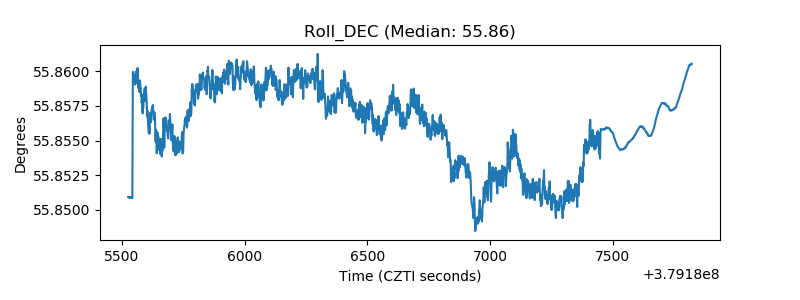 |
| _Roll_RA | 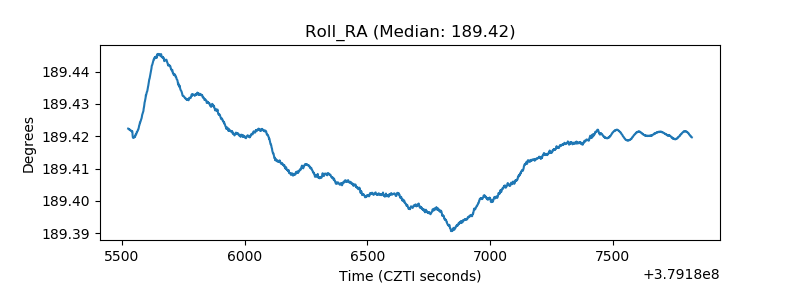 |
| Veto Counter | 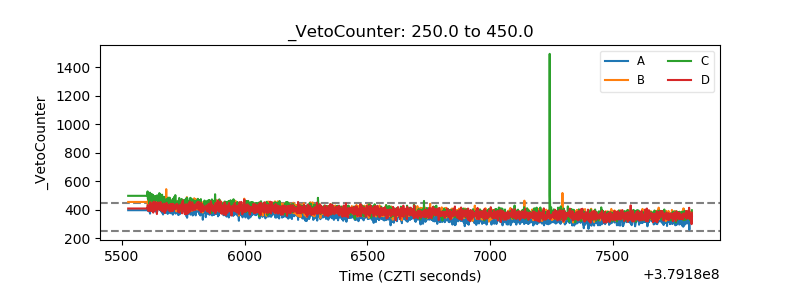 |