| Param | Original file | Final file |
|---|---|---|
| Filename | modeM0/AS1A11_068T02_9000004850cztM0_level2.fits | modeM0/AS1A11_068T02_9000004850cztM0_level2_quad_clean.evt |
| Size (bytes) | 237,162,240 | 254,148,480 |
| Size | 226.2 MB | 242.4 MB |
| Events in quadrant A | 1,489,506 | 1,613,288 |
| Events in quadrant B | 1,375,384 | 1,577,124 |
| Events in quadrant C | 1,415,912 | 1,503,733 |
| Events in quadrant D | 1,201,124 | 1,302,904 |
| Mode M9 | |||
|---|---|---|---|
| Quadrant | BADHDUFLAG | Total packets | Discarded packets |
| A | 0 | 100 | 0 |
| B | 0 | 100 | 0 |
| C | 0 | 100 | 0 |
| D | 0 | 100 | 0 |
| Mode SS | |||
|---|---|---|---|
| Quadrant | BADHDUFLAG | Total packets | Discarded packets |
| A | 0 | 504 | 0 |
| B | 0 | 504 | 0 |
| C | 0 | 504 | 0 |
| D | 0 | 504 | 0 |
| Mode M0 | |||
|---|---|---|---|
| Quadrant | BADHDUFLAG | Total packets | Discarded packets |
| A | 0 | 50126 | 0 |
| B | 0 | 61138 | 0 |
| C | 0 | 71897 | 0 |
| D | 0 | 81681 | 0 |
| Quadrant | Total seconds | Saturated seconds | Saturation percentage |
|---|---|---|---|
| A | 24705 | 24 | 0.097146% |
| B | 24705 | 1057 | 4.278486% |
| C | 24705 | 724 | 2.930581% |
| D | 24705 | 2024 | 8.192674% |
Noise dominated data is calculated using 1-second bins in cleaned event files. If a bin has >2000 counts, and if more than 50% of those come from <1% of pixels, then it is considered to be noise-dominated and hence unusable.
| Quadrant | # 1 sec bins | Bins with >0 counts | Bins with >2000 counts | High rate bins dominated by noise | Noise dominated (total time) | Noise dominated (detector-on time) | Marked lightcurve |
|---|---|---|---|---|---|---|---|
| A | 33039 | 24705 | 0 | 0 | 0.00% | 0.00% |  |
| B | 33038 | 24699 | 0 | 0 | 0.00% | 0.00% |  |
| C | 33037 | 24701 | 0 | 0 | 0.00% | 0.00% |  |
| D | 33038 | 24684 | 0 | 0 | 0.00% | 0.00% |  |
Top three noisy pixels from each quadrant. If the there are fewer than three noisy pixels in the level2.evt file, extra rows are filled as -1
| Pixel properties | Quadrant properties | ||||||
|---|---|---|---|---|---|---|---|
| Quadrant | DetID | PixID | Counts | Sigma | Mean | Median | Sigma |
| A | 9 | 19 | 1288 | 9.45 | 388 | 366 | 97.5 |
| A | 0 | 29 | 1248 | 9.04 | 388 | 366 | 97.5 |
| A | 7 | 110 | 1179 | 8.33 | 388 | 366 | 97.5 |
| B | 2 | 9 | 1180 | 11.15 | 364 | 346 | 74.8 |
| B | 3 | 80 | 1073 | 9.72 | 364 | 346 | 74.8 |
| B | 2 | 8 | 1010 | 8.88 | 364 | 346 | 74.8 |
| C | 1 | 81 | 1223 | 8.93 | 374 | 351 | 97.7 |
| C | 1 | 80 | 1214 | 8.83 | 374 | 351 | 97.7 |
| C | 3 | 202 | 1109 | 7.76 | 374 | 351 | 97.7 |
| D | 10 | 189 | 886 | 6.19 | 344 | 315 | 92.2 |
| D | 6 | 62 | 871 | 6.03 | 344 | 315 | 92.2 |
| D | 6 | 231 | 862 | 5.93 | 344 | 315 | 92.2 |
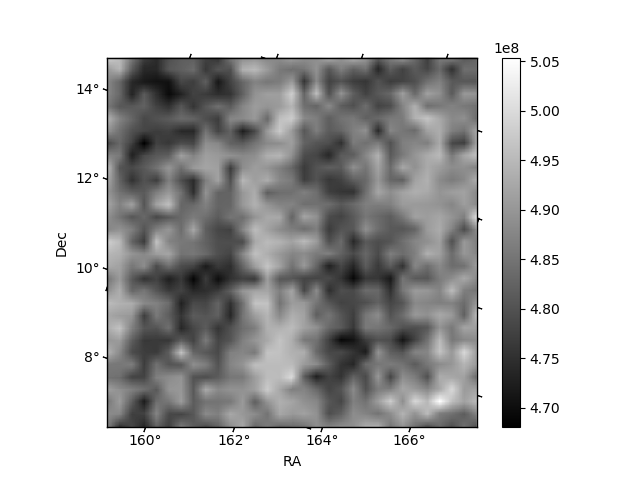
Histogram calculated using DETX and DETY for each event in the final _common_clean file
| Quadrant A |  |
 |
Quadrant B |
|---|---|---|---|
| Quadrant D |  |
 |
Quadrant C |
| Plot type | Count rate plots | Images |
|---|---|---|
| Comparison with Poisson distribution Blue bars denote a histogram of data divided into 1 sec bins. Red curve is a Poisson curve with rate = median count rate of data. |
 |
 |
| Quadrant-wise count rates Data is divided into 100 sec bins |
 |
|
| Module-wise count rates for Quadrant A Data is divided into 100 sec bins |
 |
 |
| Module-wise count rates for Quadrant B Data is divided into 100 sec bins |
 |
 |
| Module-wise count rates for Quadrant C Data is divided into 100 sec bins |
 |
 |
| Module-wise count rates for Quadrant D Data is divided into 100 sec bins |
 |
 |
| Parameter | Plot |
|---|---|
| CZT HV Monitor |  |
| D_VDD | 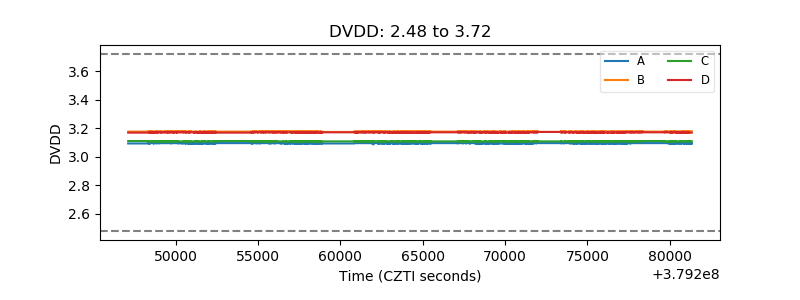 |
| Temperature 1 |  |
| Veto HV Monitor |  |
| Veto LLD |  |
| Alpha Counter |  |
| _CPM_Rate |  |
| CZT Counter |  |
| +2.5 Volts monitor |  |
| +5 Volts monitor |  |
| _ROLL_ROT |  |
| _Roll_DEC |  |
| _Roll_RA |  |
| Veto Counter |  |