| Param | Original file | Final file |
|---|---|---|
| Filename | modeM0/AS1A11_068T02_9000004850_33946cztM0_level2.evt | modeM0/AS1A11_068T02_9000004850_33946cztM0_level2_quad_clean.evt |
| Size (bytes) | 484,464,960 | 49,230,720 |
| Size | 462.0 MB | 47.0 MB |
| Events in quadrant A | 2,627,895 | 288,545 |
| Events in quadrant B | 3,283,349 | 289,063 |
| Events in quadrant C | 4,047,060 | 280,495 |
| Events in quadrant D | 4,362,267 | 268,583 |
| Mode M9 | |||
|---|---|---|---|
| Quadrant | BADHDUFLAG | Total packets | Discarded packets |
| A | 0 | 32 | 0 |
| B | 0 | 32 | 0 |
| C | 0 | 32 | 0 |
| D | 0 | 33 | 0 |
| Mode SS | |||
|---|---|---|---|
| Quadrant | BADHDUFLAG | Total packets | Discarded packets |
| A | 0 | 106 | 0 |
| B | 0 | 106 | 0 |
| C | 0 | 106 | 0 |
| D | 0 | 106 | 0 |
| Mode M0 | |||
|---|---|---|---|
| Quadrant | BADHDUFLAG | Total packets | Discarded packets |
| A | 0 | 10702 | 3 |
| B | 0 | 12872 | 2 |
| C | 0 | 15743 | 2 |
| D | 0 | 16535 | 2 |
| Quadrant | Total seconds | Saturated seconds | Saturation percentage |
|---|---|---|---|
| A | 5186 | 4 | 0.077131% |
| B | 5186 | 148 | 2.853837% |
| C | 5186 | 171 | 3.297339% |
| D | 5186 | 302 | 5.823371% |
Noise dominated data is calculated using 1-second bins in cleaned event files. If a bin has >2000 counts, and if more than 50% of those come from <1% of pixels, then it is considered to be noise-dominated and hence unusable.
| Quadrant | # 1 sec bins | Bins with >0 counts | Bins with >2000 counts | High rate bins dominated by noise | Noise dominated (total time) | Noise dominated (detector-on time) | Marked lightcurve |
|---|---|---|---|---|---|---|---|
| A | 7309 | 5187 | 0 | 0 | 0.00% | 0.00% | 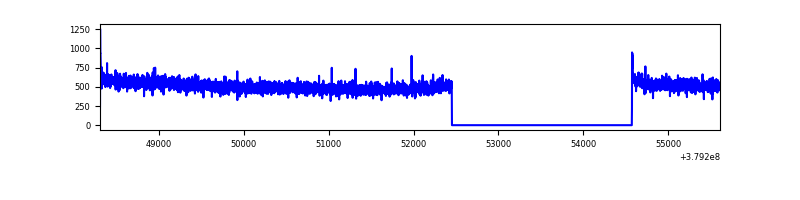 |
| B | 7309 | 5187 | 92 | 92 | 1.26% | 1.77% | 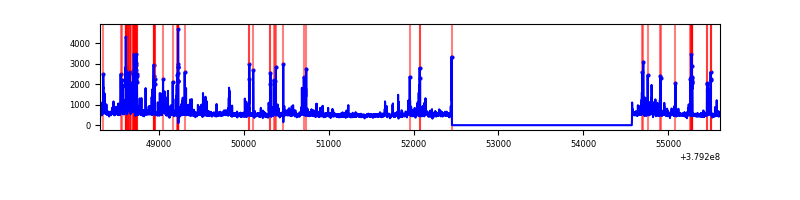 |
| C | 7309 | 5187 | 113 | 113 | 1.55% | 2.18% | 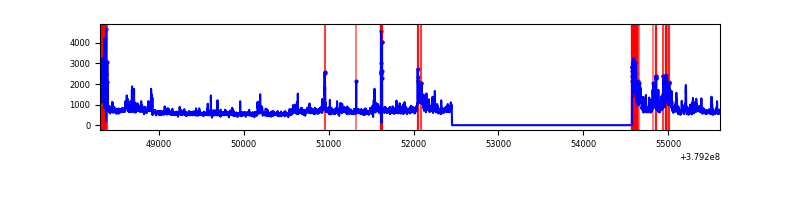 |
| D | 7309 | 5187 | 242 | 242 | 3.31% | 4.67% | 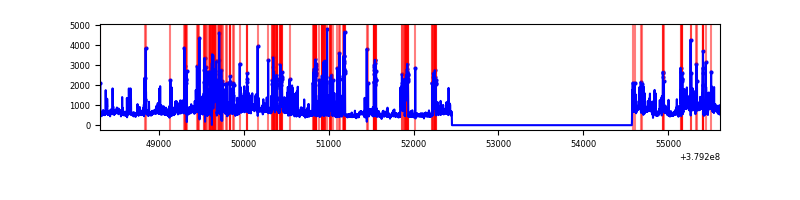 |
Top three noisy pixels from each quadrant. If the there are fewer than three noisy pixels in the level2.evt file, extra rows are filled as -1
| Pixel properties | Quadrant properties | ||||||
|---|---|---|---|---|---|---|---|
| Quadrant | DetID | PixID | Counts | Sigma | Mean | Median | Sigma |
| A | 13 | 6 | 15633 | 110.89 | 673 | 661 | 135.0 |
| A | 10 | 83 | 14820 | 104.86 | 673 | 661 | 135.0 |
| A | 13 | 254 | 8251 | 56.21 | 673 | 661 | 135.0 |
| B | 5 | 172 | 448729 | 3620.87 | 655 | 641 | 123.8 |
| B | 15 | 35 | 100971 | 810.74 | 655 | 641 | 123.8 |
| B | 4 | 251 | 42500 | 338.25 | 655 | 641 | 123.8 |
| C | 3 | 233 | 999798 | 6761.34 | 642 | 648 | 147.8 |
| C | 0 | 10 | 232267 | 1567.39 | 642 | 648 | 147.8 |
| C | 15 | 214 | 225210 | 1519.63 | 642 | 648 | 147.8 |
| D | 13 | 249 | 520764 | 3241.05 | 643 | 625 | 160.5 |
| D | 8 | 195 | 455506 | 2834.42 | 643 | 625 | 160.5 |
| D | 8 | 230 | 229668 | 1427.19 | 643 | 625 | 160.5 |
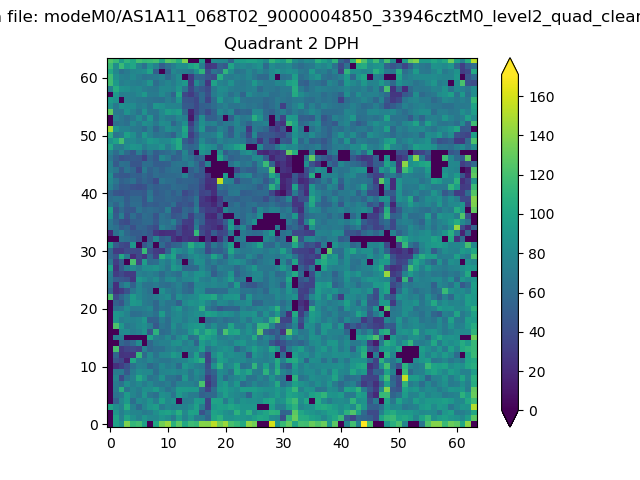
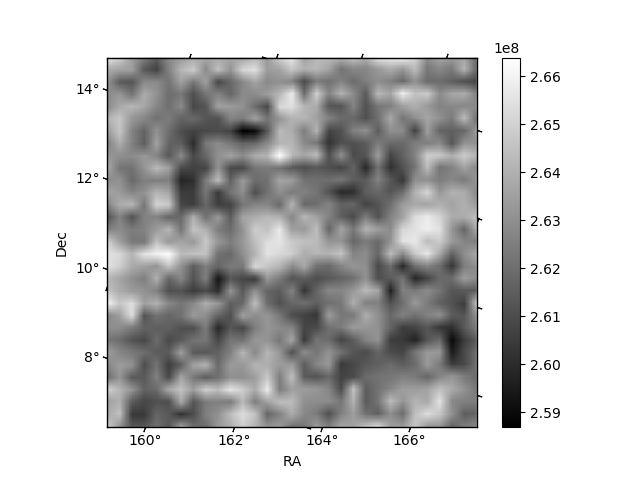
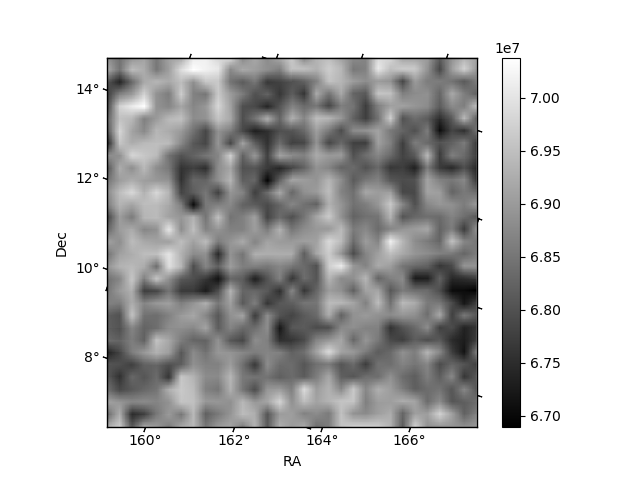
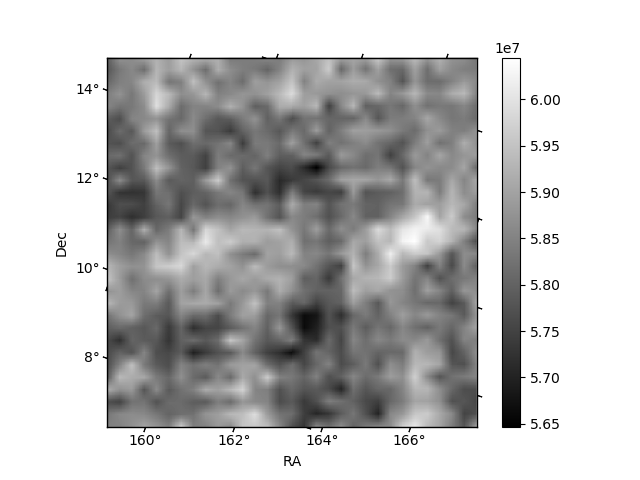
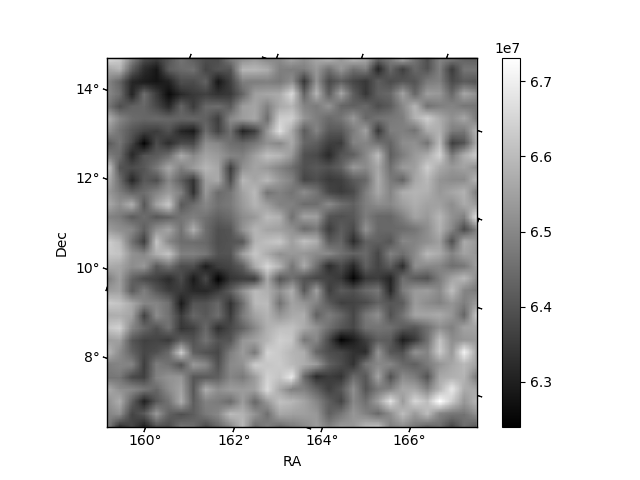
Histogram calculated using DETX and DETY for each event in the final _common_clean file
| Quadrant A | 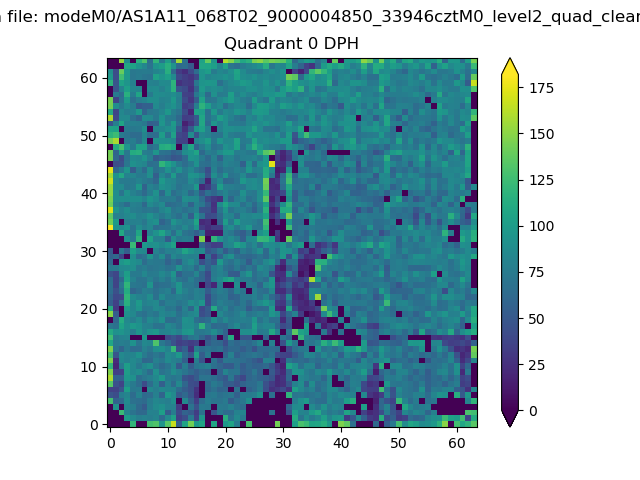 |
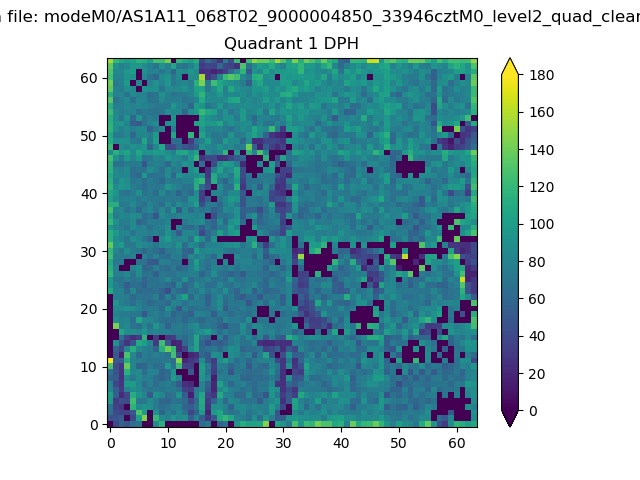 |
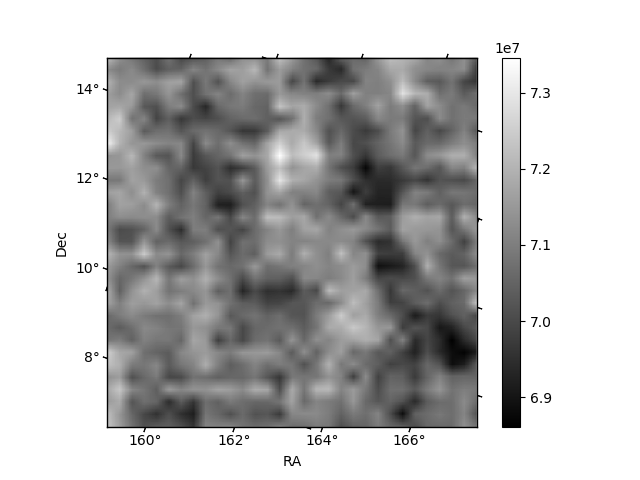
Quadrant B |
|---|---|---|---|
| Quadrant D | 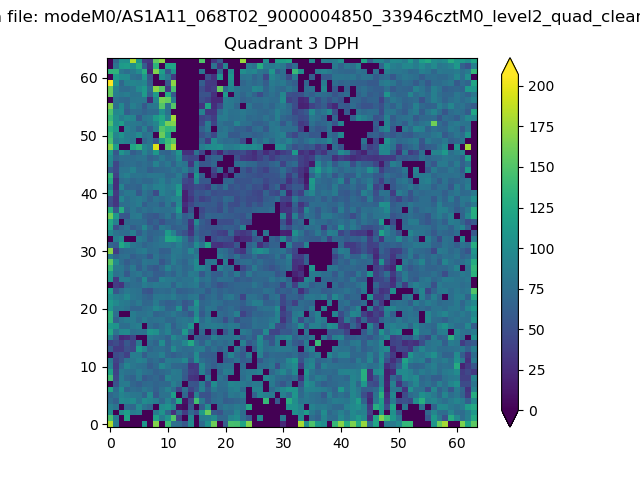 |
 |
Quadrant C |
| Plot type | Count rate plots | Images |
|---|---|---|
| Comparison with Poisson distribution Blue bars denote a histogram of data divided into 1 sec bins. Red curve is a Poisson curve with rate = median count rate of data. |
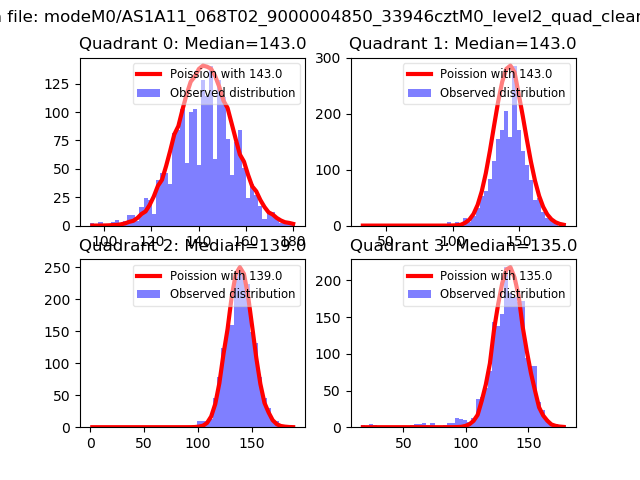 |
 |
| Quadrant-wise count rates Data is divided into 100 sec bins |
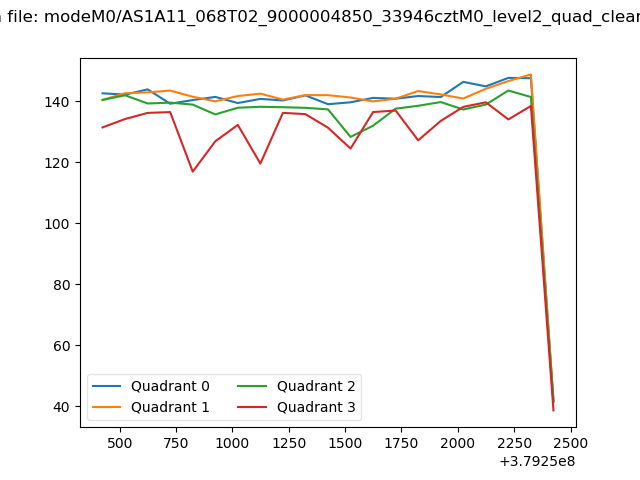 |
|
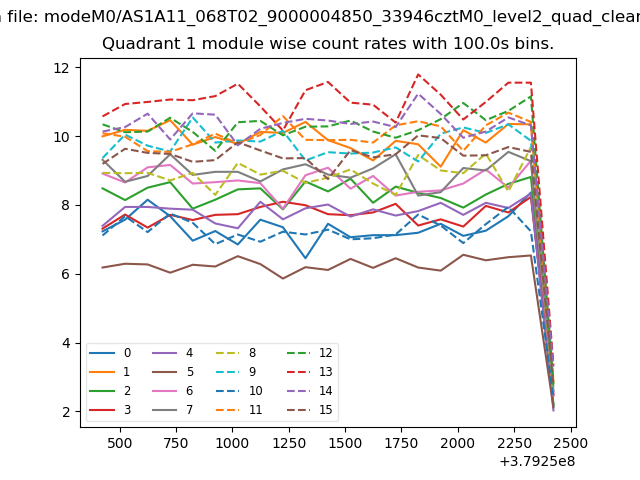
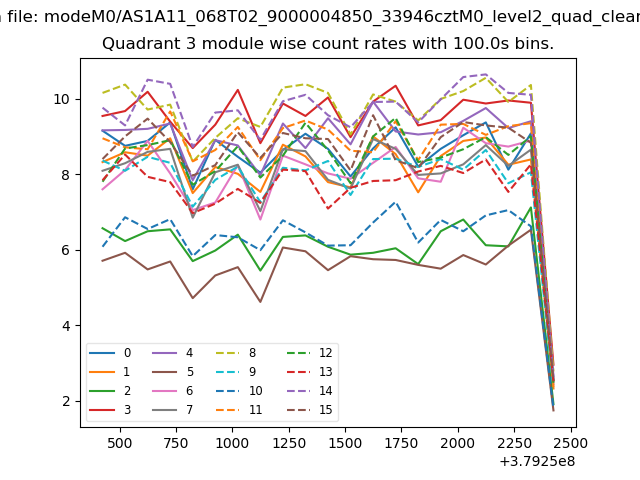
| Module-wise count rates for Quadrant A Data is divided into 100 sec bins |
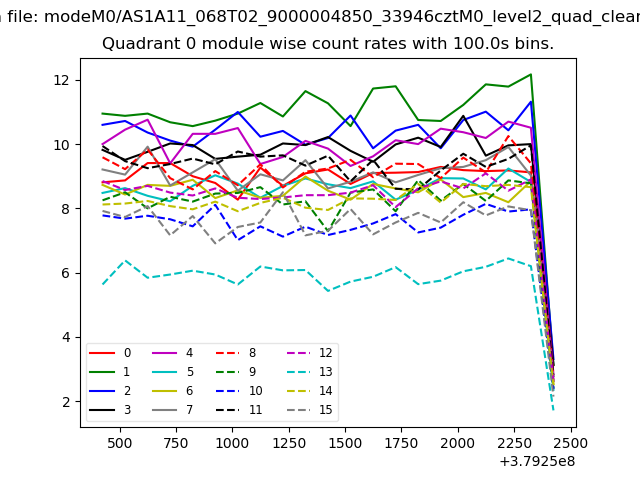 |
 |
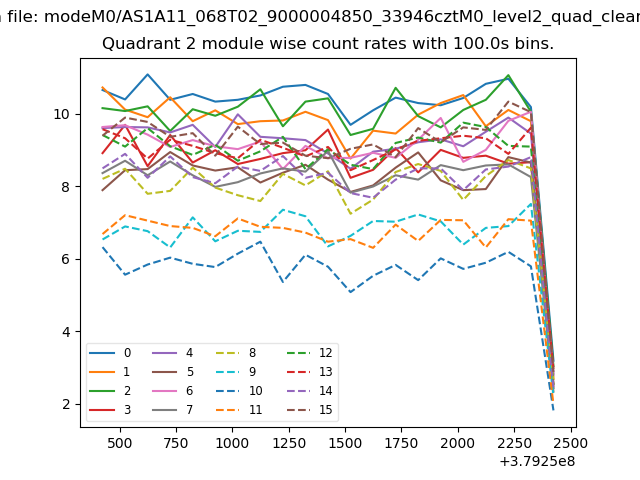
| Module-wise count rates for Quadrant B Data is divided into 100 sec bins |
 |
 |
| Module-wise count rates for Quadrant C Data is divided into 100 sec bins |
 |
 |
| Module-wise count rates for Quadrant D Data is divided into 100 sec bins |
 |
 |
| Parameter | Plot |
|---|---|
| CZT HV Monitor | 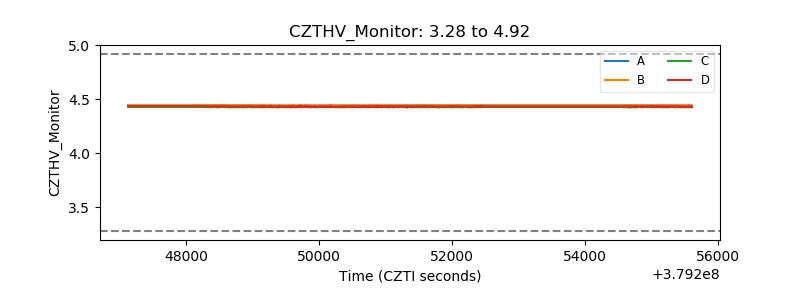 |
| D_VDD | 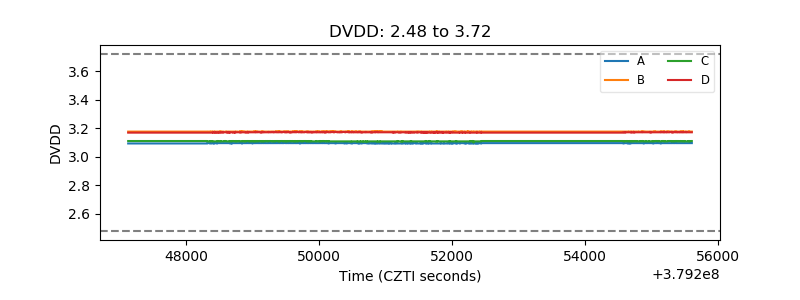 |
| Temperature 1 | 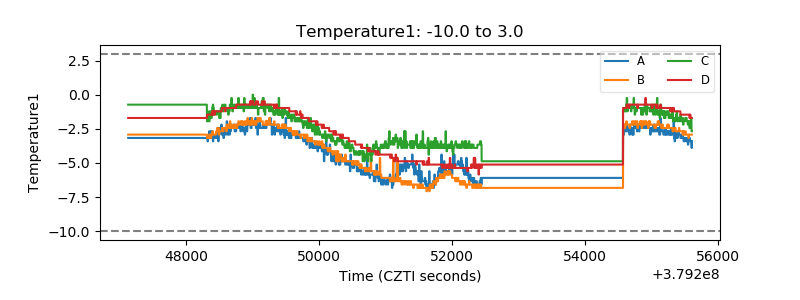 |
| Veto HV Monitor | 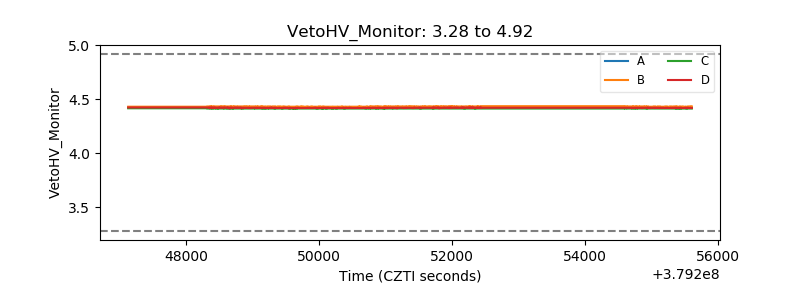 |
| Veto LLD | 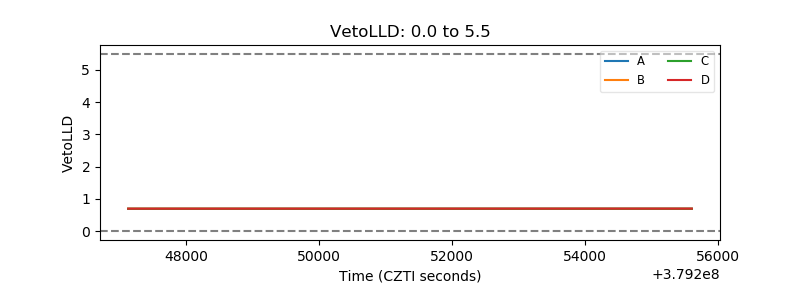 |
| Alpha Counter | 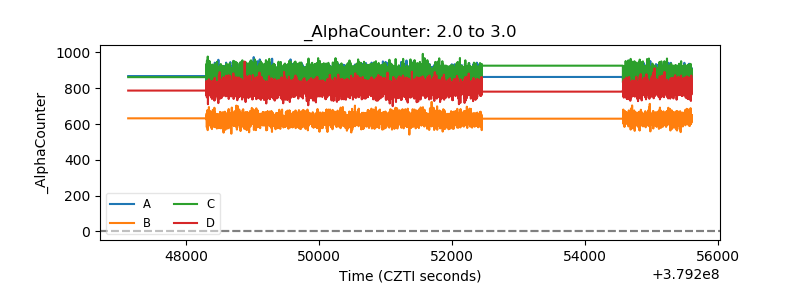 |
| _CPM_Rate | 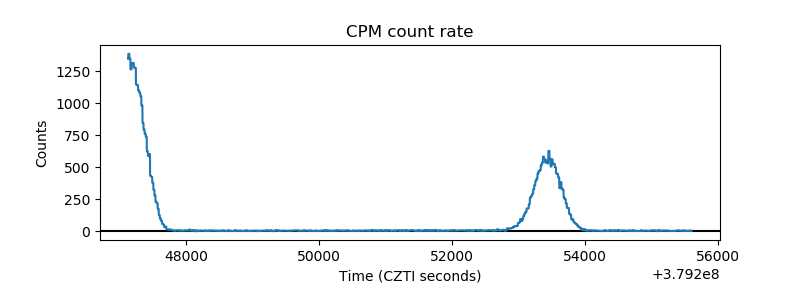 |
| CZT Counter | 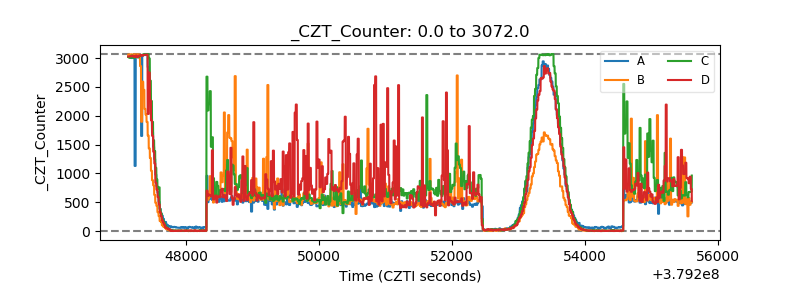 |
| +2.5 Volts monitor |  |
| +5 Volts monitor |  |
| _ROLL_ROT | 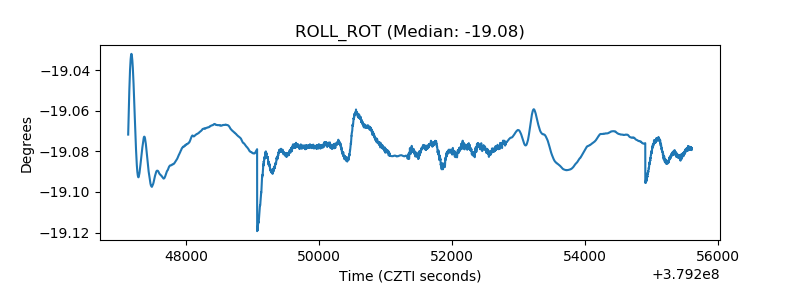 |
| _Roll_DEC | 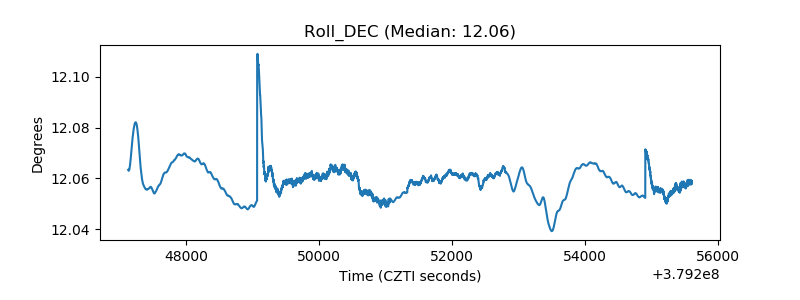 |
| _Roll_RA | 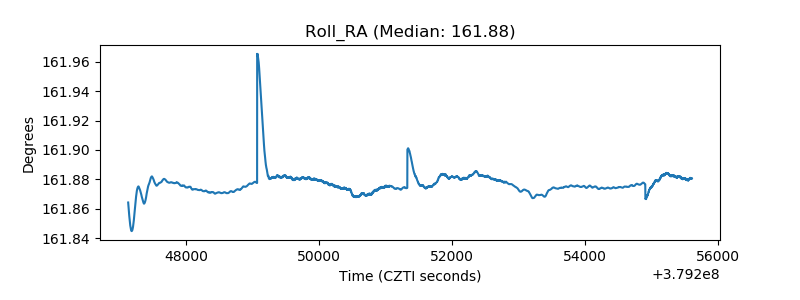 |
| Veto Counter |  |