| Param | Original file | Final file |
|---|---|---|
| Filename | modeM0/AS1A11_068T02_9000004850_33947cztM0_level2.evt | modeM0/AS1A11_068T02_9000004850_33947cztM0_level2_quad_clean.evt |
| Size (bytes) | 570,695,040 | 57,576,960 |
| Size | 544.3 MB | 54.9 MB |
| Events in quadrant A | 2,580,642 | 357,846 |
| Events in quadrant B | 3,402,135 | 356,681 |
| Events in quadrant C | 5,351,144 | 343,681 |
| Events in quadrant D | 5,588,676 | 310,783 |
| Mode M9 | |||
|---|---|---|---|
| Quadrant | BADHDUFLAG | Total packets | Discarded packets |
| A | 0 | 30 | 0 |
| B | 0 | 30 | 0 |
| C | 0 | 30 | 0 |
| D | 0 | 31 | 0 |
| Mode SS | |||
|---|---|---|---|
| Quadrant | BADHDUFLAG | Total packets | Discarded packets |
| A | 0 | 108 | 0 |
| B | 0 | 108 | 0 |
| C | 0 | 108 | 0 |
| D | 0 | 108 | 0 |
| Mode M0 | |||
|---|---|---|---|
| Quadrant | BADHDUFLAG | Total packets | Discarded packets |
| A | 0 | 10852 | 3 |
| B | 0 | 13360 | 2 |
| C | 0 | 19572 | 2 |
| D | 0 | 20258 | 2 |
| Quadrant | Total seconds | Saturated seconds | Saturation percentage |
|---|---|---|---|
| A | 5341 | 5 | 0.093615% |
| B | 5341 | 313 | 5.860326% |
| C | 5341 | 391 | 7.320726% |
| D | 5341 | 609 | 11.402359% |
Noise dominated data is calculated using 1-second bins in cleaned event files. If a bin has >2000 counts, and if more than 50% of those come from <1% of pixels, then it is considered to be noise-dominated and hence unusable.
| Quadrant | # 1 sec bins | Bins with >0 counts | Bins with >2000 counts | High rate bins dominated by noise | Noise dominated (total time) | Noise dominated (detector-on time) | Marked lightcurve |
|---|---|---|---|---|---|---|---|
| A | 7283 | 5342 | 0 | 0 | 0.00% | 0.00% | 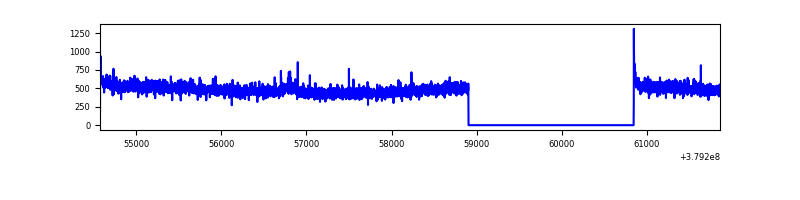 |
| B | 7283 | 5341 | 248 | 248 | 3.41% | 4.64% | 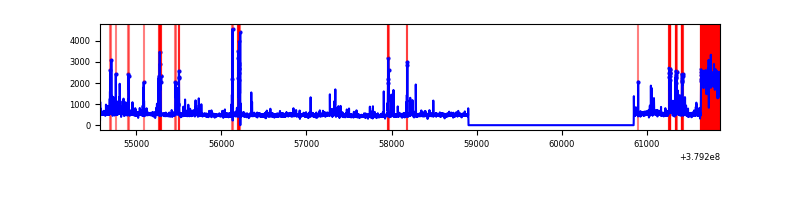 |
| C | 7283 | 5342 | 285 | 285 | 3.91% | 5.34% | 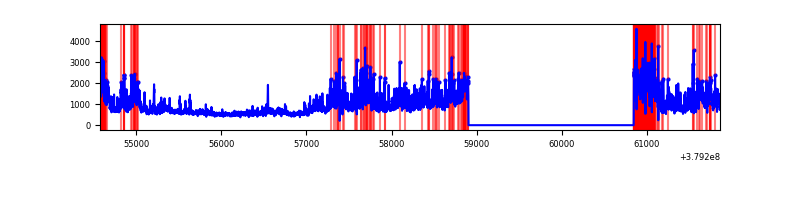 |
| D | 7283 | 5342 | 575 | 575 | 7.90% | 10.76% | 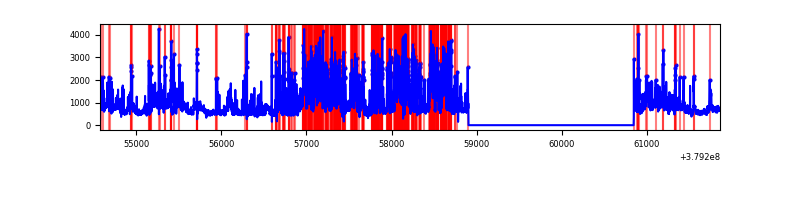 |
Top three noisy pixels from each quadrant. If the there are fewer than three noisy pixels in the level2.evt file, extra rows are filled as -1
| Pixel properties | Quadrant properties | ||||||
|---|---|---|---|---|---|---|---|
| Quadrant | DetID | PixID | Counts | Sigma | Mean | Median | Sigma |
| A | 13 | 6 | 20958 | 153.82 | 658 | 647 | 132.0 |
| A | 10 | 83 | 15454 | 112.13 | 658 | 647 | 132.0 |
| A | 13 | 254 | 8668 | 60.74 | 658 | 647 | 132.0 |
| B | 0 | 182 | 479386 | 3913.92 | 640 | 625 | 122.3 |
| B | 5 | 172 | 244174 | 1991.04 | 640 | 625 | 122.3 |
| B | 4 | 81 | 47483 | 383.07 | 640 | 625 | 122.3 |
| C | 3 | 233 | 2391004 | 16574.11 | 623 | 628 | 144.2 |
| C | 15 | 214 | 229071 | 1583.95 | 623 | 628 | 144.2 |
| C | 0 | 10 | 181243 | 1252.33 | 623 | 628 | 144.2 |
| D | 12 | 6 | 1510565 | 8899.78 | 613 | 599 | 169.7 |
| D | 8 | 195 | 730340 | 4301.11 | 613 | 599 | 169.7 |
| D | 2 | 250 | 305365 | 1796.3 | 613 | 599 | 169.7 |
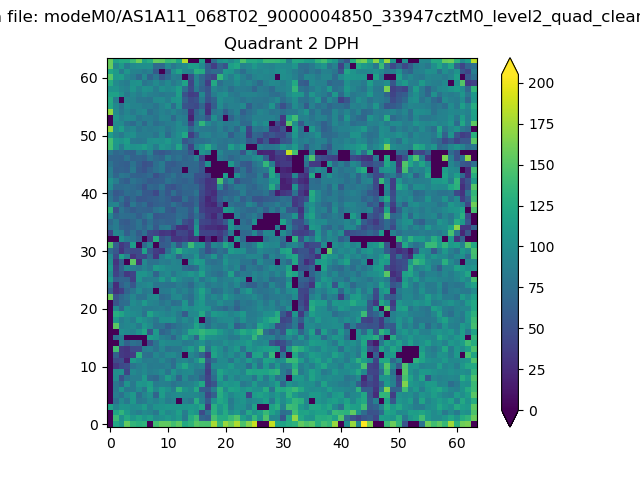
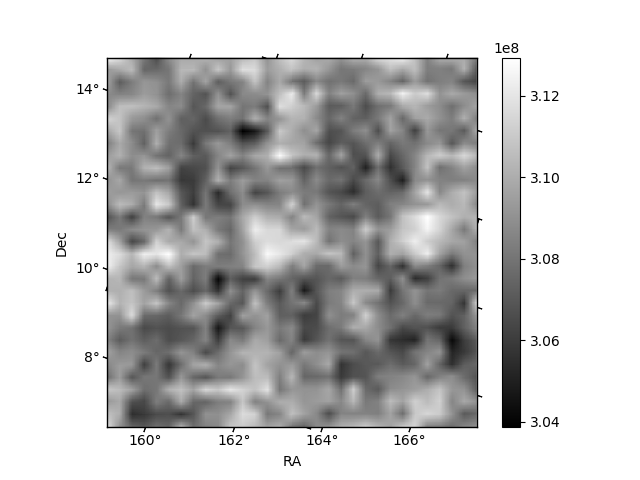
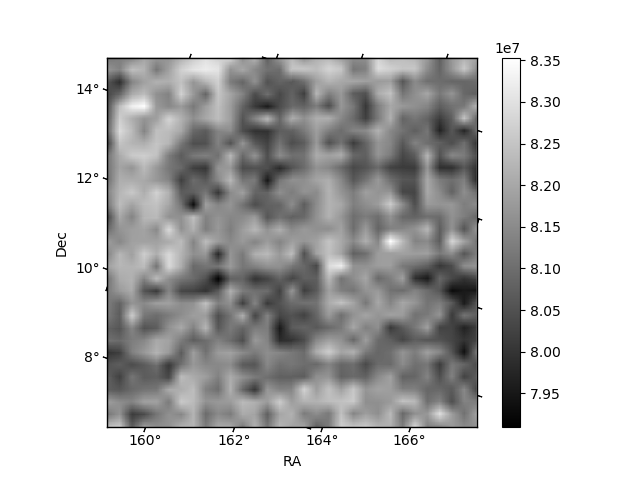
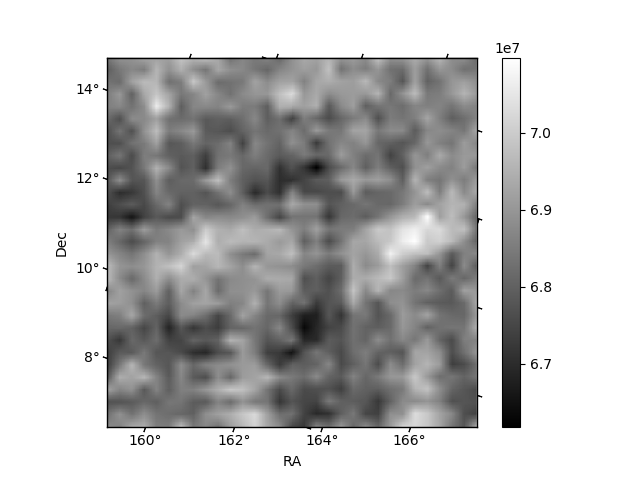
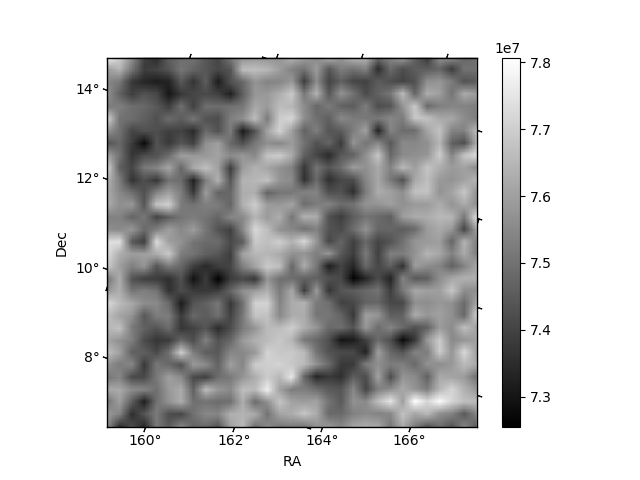
Histogram calculated using DETX and DETY for each event in the final _common_clean file
| Quadrant A | 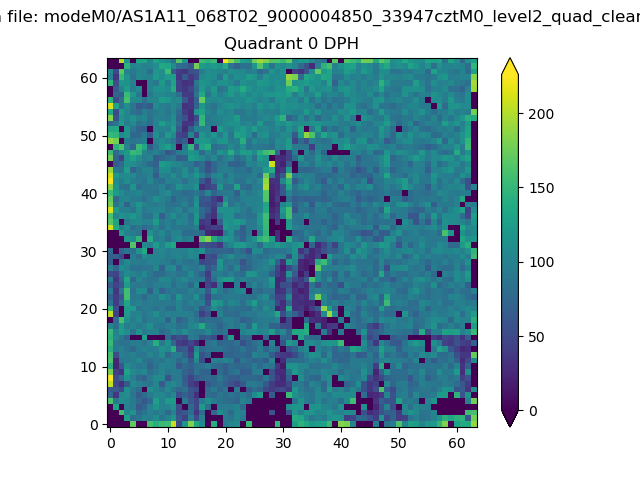 |
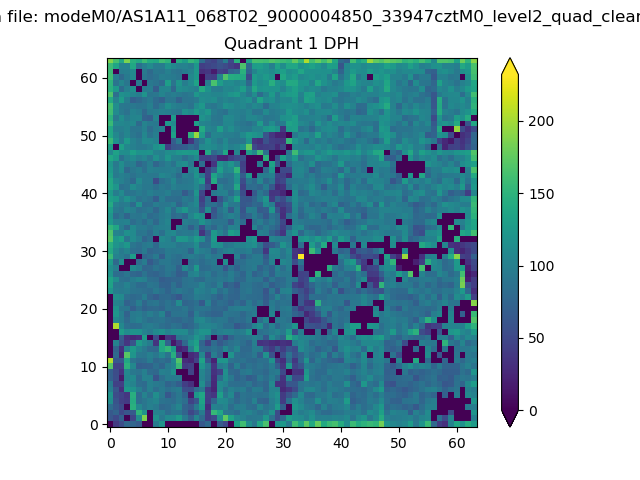 |
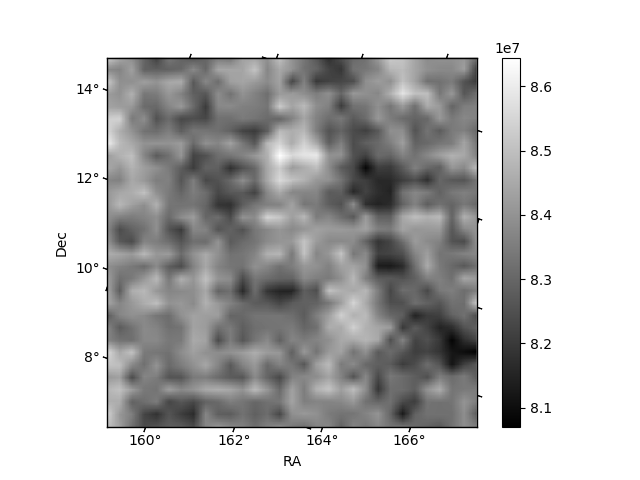
Quadrant B |
|---|---|---|---|
| Quadrant D | 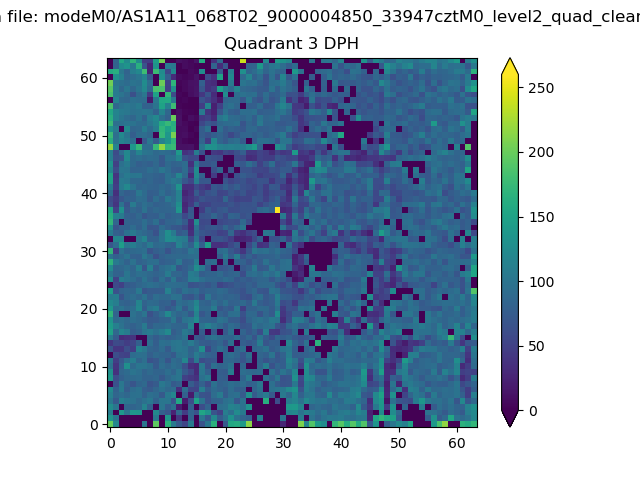 |
 |
Quadrant C |
| Plot type | Count rate plots | Images |
|---|---|---|
| Comparison with Poisson distribution Blue bars denote a histogram of data divided into 1 sec bins. Red curve is a Poisson curve with rate = median count rate of data. |
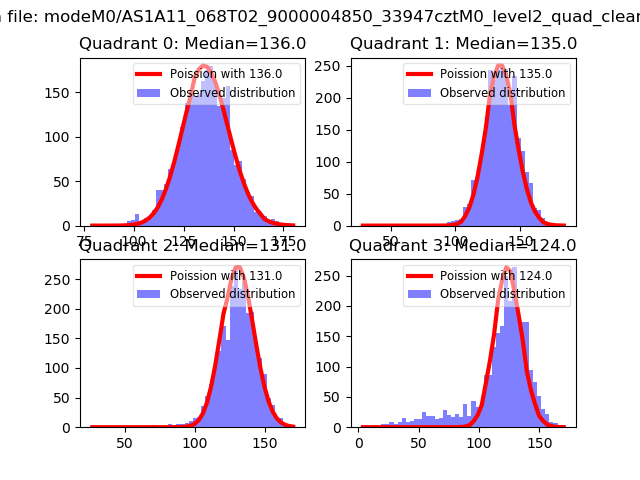 |
 |
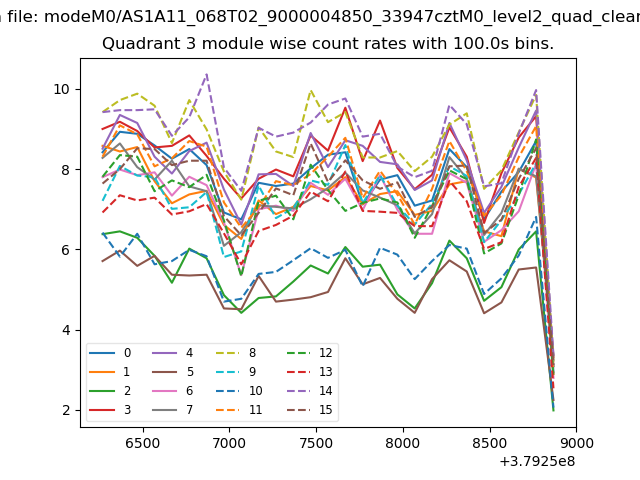
| Quadrant-wise count rates Data is divided into 100 sec bins |
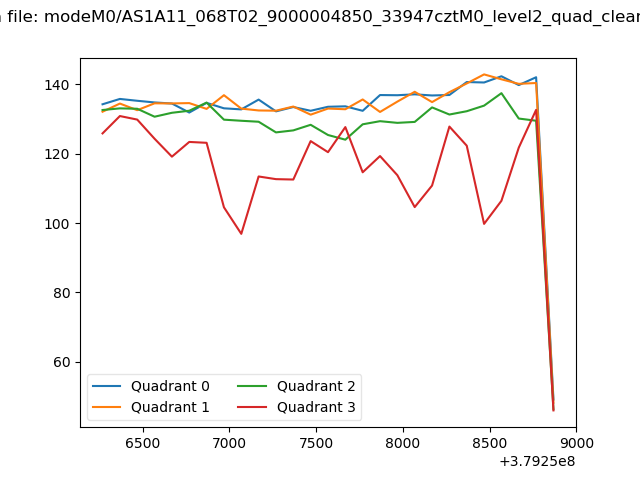 |
|
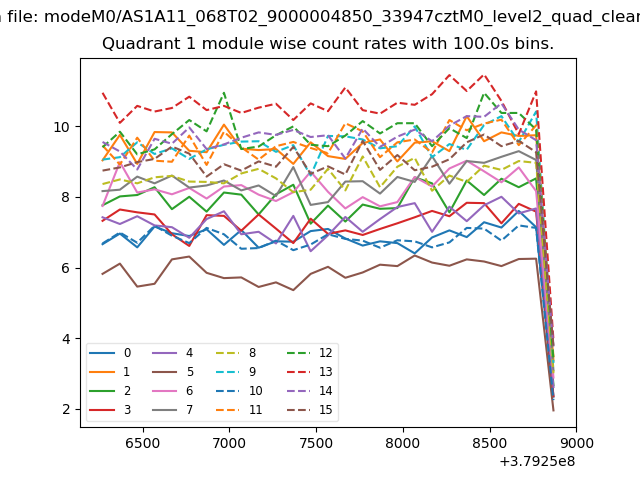
| Module-wise count rates for Quadrant A Data is divided into 100 sec bins |
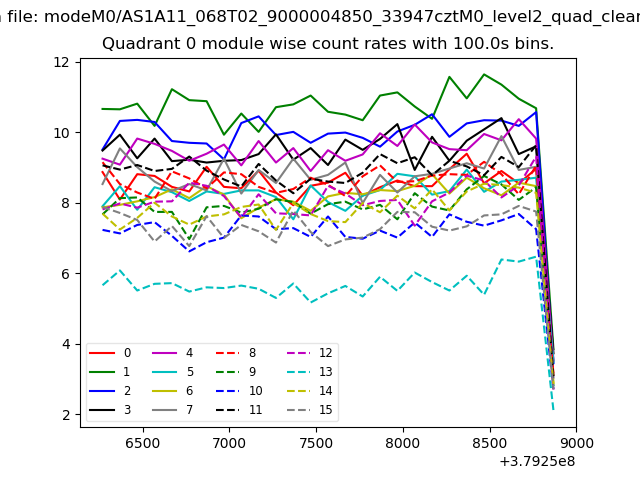 |
 |
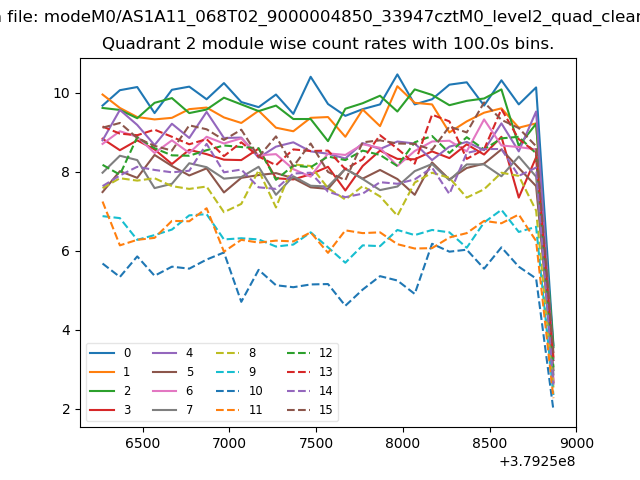
| Module-wise count rates for Quadrant B Data is divided into 100 sec bins |
 |
 |
| Module-wise count rates for Quadrant C Data is divided into 100 sec bins |
 |
 |
| Module-wise count rates for Quadrant D Data is divided into 100 sec bins |
 |
 |
| Parameter | Plot |
|---|---|
| CZT HV Monitor | 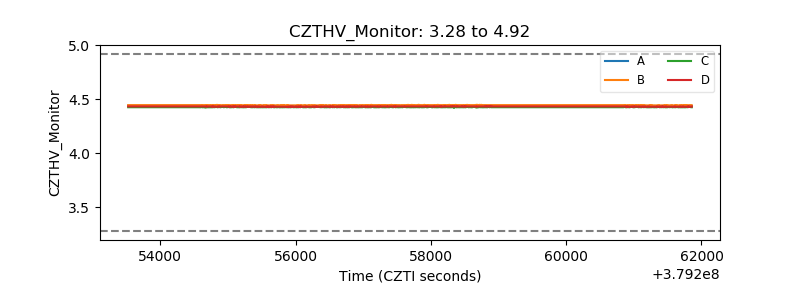 |
| D_VDD | 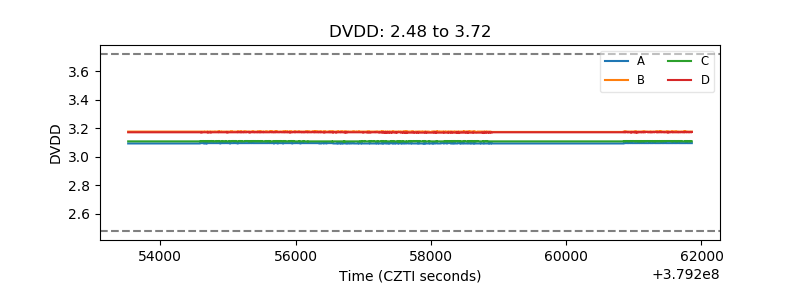 |
| Temperature 1 | 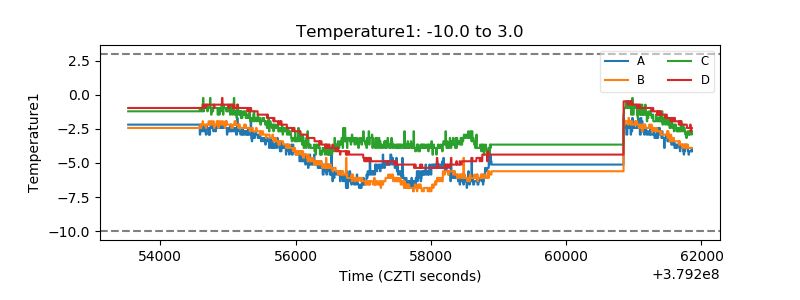 |
| Veto HV Monitor | 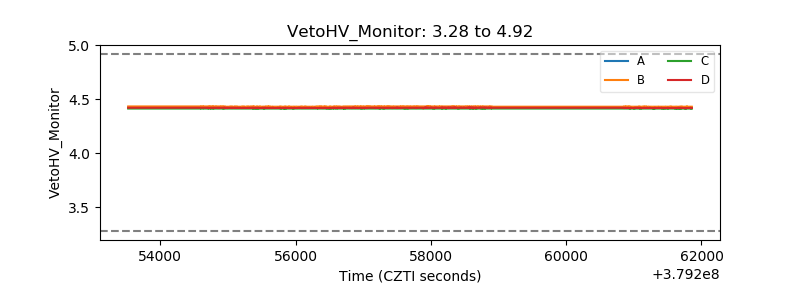 |
| Veto LLD | 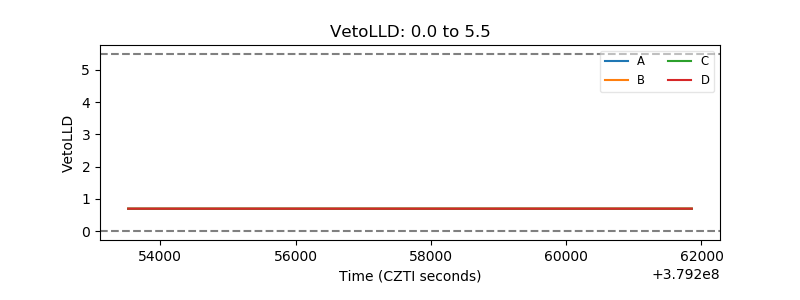 |
| Alpha Counter | 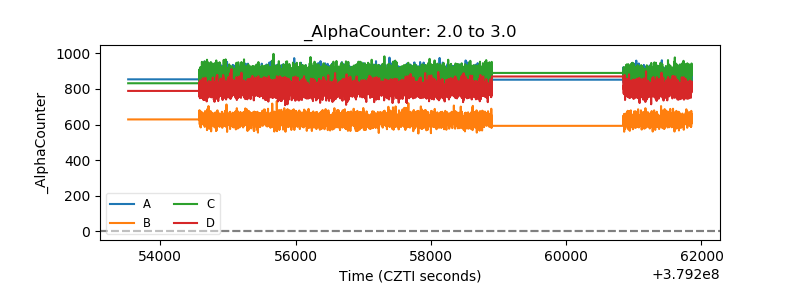 |
| _CPM_Rate | 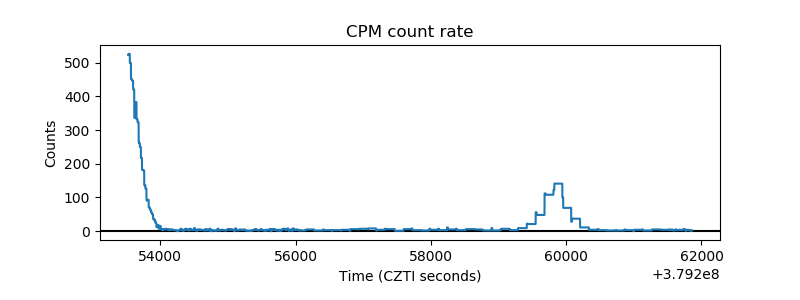 |
| CZT Counter |  |
| +2.5 Volts monitor |  |
| +5 Volts monitor |  |
| _ROLL_ROT | 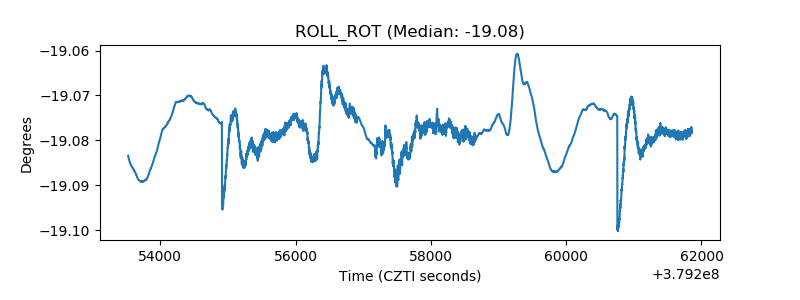 |
| _Roll_DEC |  |
| _Roll_RA | 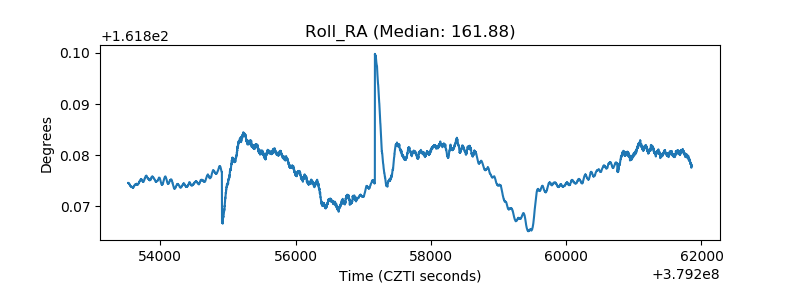 |
| Veto Counter |  |