| Param | Original file | Final file |
|---|---|---|
| Filename | modeM0/AS1A11_068T02_9000004850_33948cztM0_level2.evt | modeM0/AS1A11_068T02_9000004850_33948cztM0_level2_quad_clean.evt |
| Size (bytes) | 540,080,640 | 70,073,280 |
| Size | 515.1 MB | 66.8 MB |
| Events in quadrant A | 2,551,563 | 447,766 |
| Events in quadrant B | 4,007,011 | 446,201 |
| Events in quadrant C | 5,055,195 | 433,127 |
| Events in quadrant D | 4,374,460 | 414,249 |
| Mode M9 | |||
|---|---|---|---|
| Quadrant | BADHDUFLAG | Total packets | Discarded packets |
| A | 0 | 28 | 0 |
| B | 0 | 28 | 0 |
| C | 0 | 28 | 0 |
| D | 0 | 29 | 0 |
| Mode SS | |||
|---|---|---|---|
| Quadrant | BADHDUFLAG | Total packets | Discarded packets |
| A | 0 | 110 | 0 |
| B | 0 | 110 | 0 |
| C | 0 | 110 | 0 |
| D | 0 | 110 | 0 |
| Mode M0 | |||
|---|---|---|---|
| Quadrant | BADHDUFLAG | Total packets | Discarded packets |
| A | 0 | 11023 | 3 |
| B | 0 | 15416 | 2 |
| C | 0 | 19085 | 2 |
| D | 0 | 16676 | 2 |
| Quadrant | Total seconds | Saturated seconds | Saturation percentage |
|---|---|---|---|
| A | 5437 | 5 | 0.091962% |
| B | 5437 | 548 | 10.079088% |
| C | 5437 | 352 | 6.474159% |
| D | 5437 | 309 | 5.683281% |
Noise dominated data is calculated using 1-second bins in cleaned event files. If a bin has >2000 counts, and if more than 50% of those come from <1% of pixels, then it is considered to be noise-dominated and hence unusable.
| Quadrant | # 1 sec bins | Bins with >0 counts | Bins with >2000 counts | High rate bins dominated by noise | Noise dominated (total time) | Noise dominated (detector-on time) | Marked lightcurve |
|---|---|---|---|---|---|---|---|
| A | 7049 | 5438 | 0 | 0 | 0.00% | 0.00% | 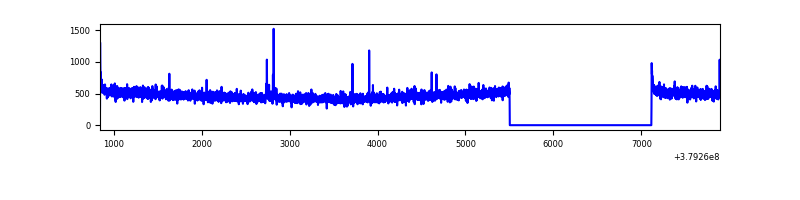 |
| B | 7049 | 5438 | 419 | 419 | 5.94% | 7.71% | 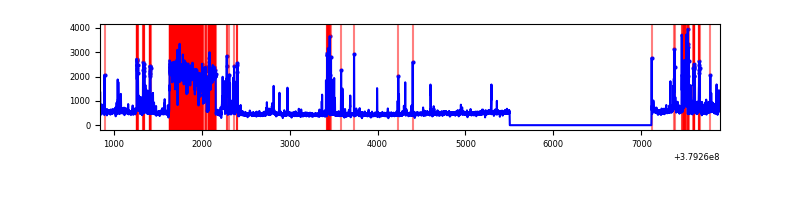 |
| C | 7049 | 5438 | 247 | 247 | 3.50% | 4.54% | 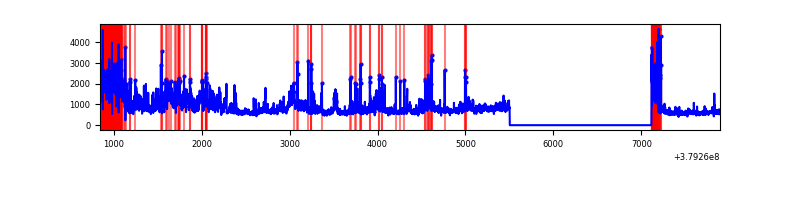 |
| D | 7049 | 5438 | 237 | 237 | 3.36% | 4.36% | 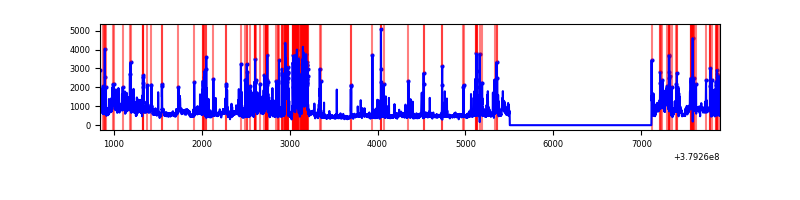 |
Top three noisy pixels from each quadrant. If the there are fewer than three noisy pixels in the level2.evt file, extra rows are filled as -1
| Pixel properties | Quadrant properties | ||||||
|---|---|---|---|---|---|---|---|
| Quadrant | DetID | PixID | Counts | Sigma | Mean | Median | Sigma |
| A | 10 | 83 | 15657 | 113.72 | 654 | 641 | 132.0 |
| A | 13 | 254 | 9989 | 70.79 | 654 | 641 | 132.0 |
| A | 13 | 6 | 6757 | 46.32 | 654 | 641 | 132.0 |
| B | 0 | 182 | 967506 | 7992.25 | 631 | 615 | 121.0 |
| B | 5 | 172 | 422597 | 3488.07 | 631 | 615 | 121.0 |
| B | 0 | 229 | 29107 | 235.51 | 631 | 615 | 121.0 |
| C | 3 | 233 | 1922954 | 13336.77 | 618 | 623 | 144.1 |
| C | 0 | 10 | 376586 | 2608.36 | 618 | 623 | 144.1 |
| C | 15 | 214 | 230812 | 1597.01 | 618 | 623 | 144.1 |
| D | 8 | 195 | 579491 | 3574.24 | 620 | 606 | 162.0 |
| D | 12 | 6 | 449863 | 2773.87 | 620 | 606 | 162.0 |
| D | 13 | 249 | 330898 | 2039.34 | 620 | 606 | 162.0 |
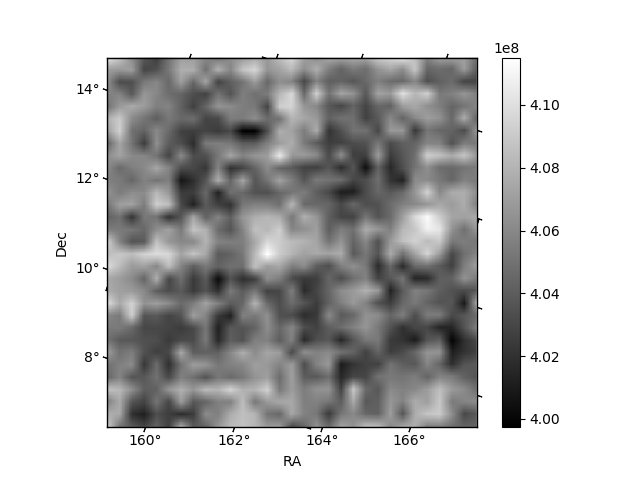
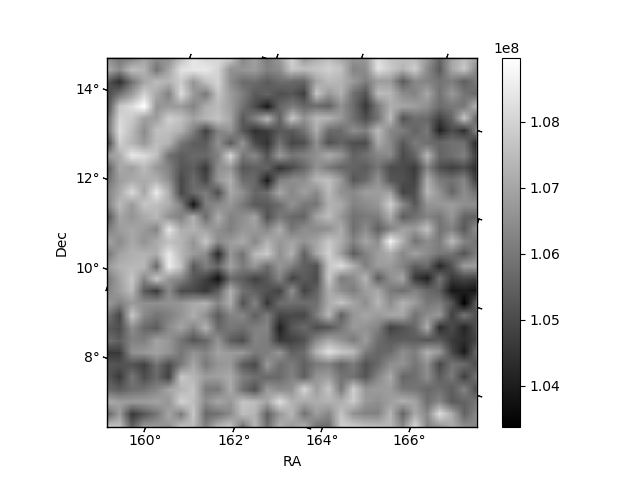
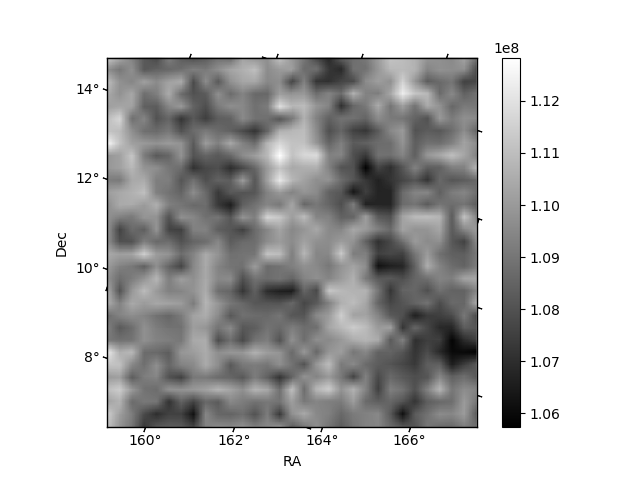
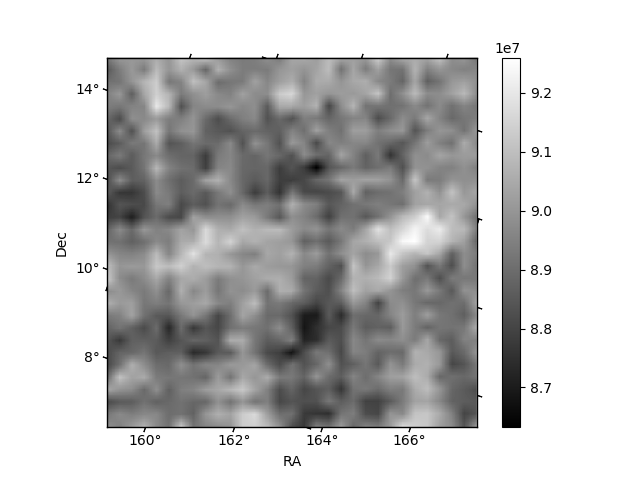
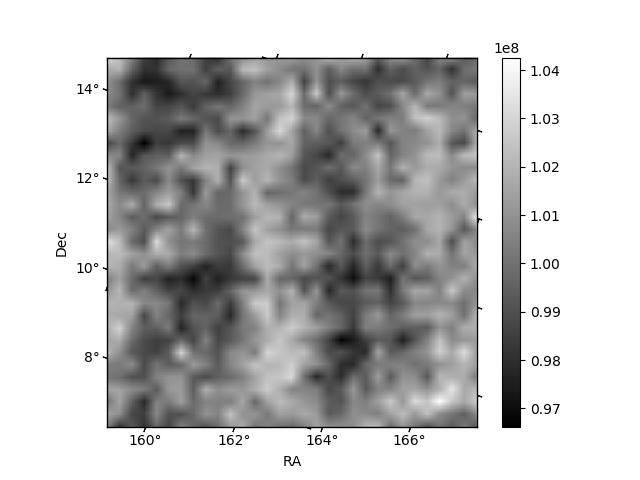
Histogram calculated using DETX and DETY for each event in the final _common_clean file
| Quadrant A | 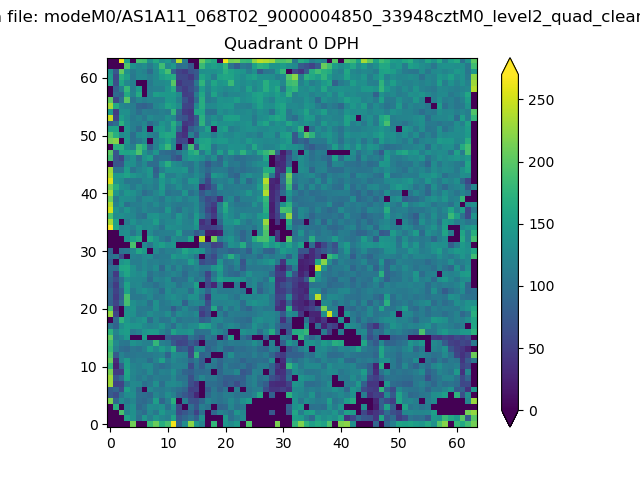 |
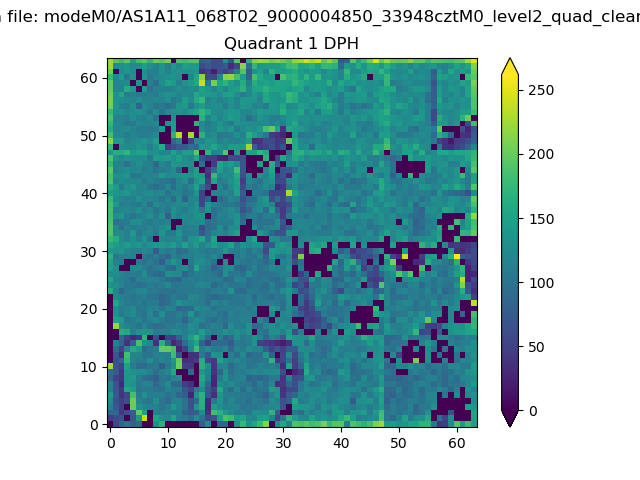 |
Quadrant B |
|---|---|---|---|
| Quadrant D | 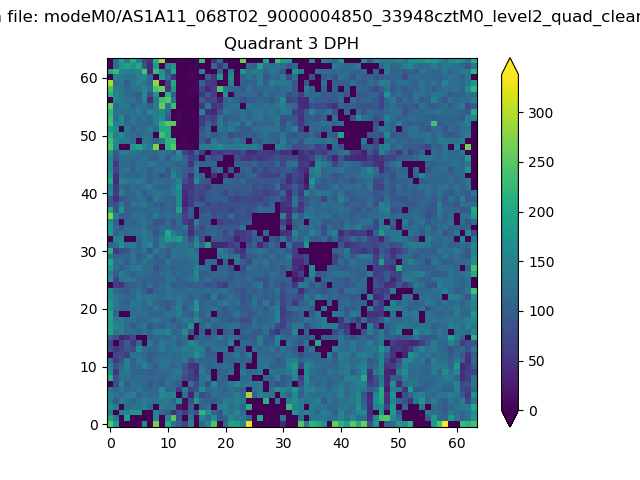 |
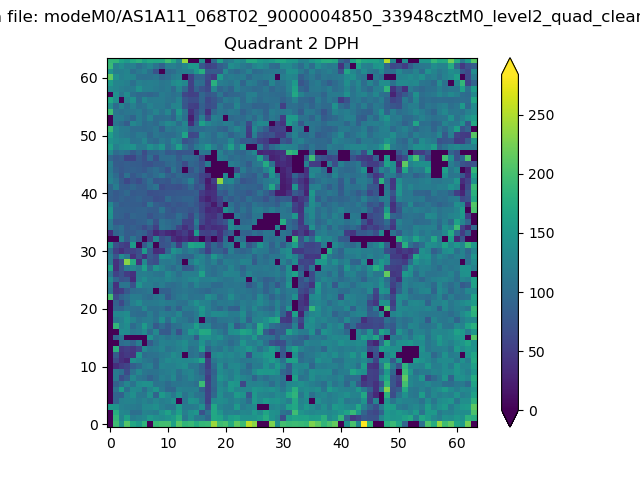 |
Quadrant C |
| Plot type | Count rate plots | Images |
|---|---|---|
| Comparison with Poisson distribution Blue bars denote a histogram of data divided into 1 sec bins. Red curve is a Poisson curve with rate = median count rate of data. |
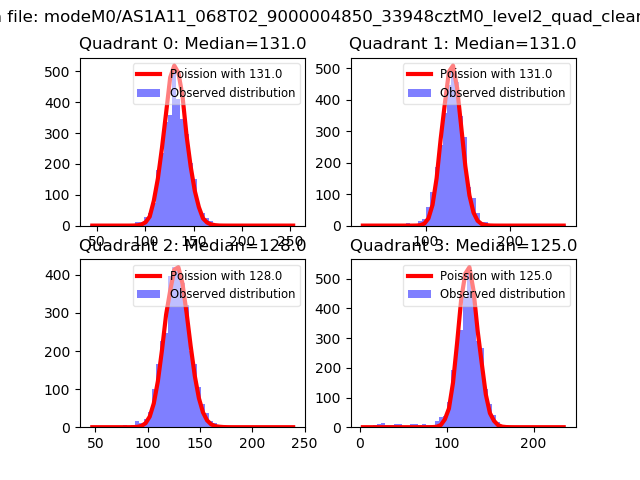 |
 |
| Quadrant-wise count rates Data is divided into 100 sec bins |
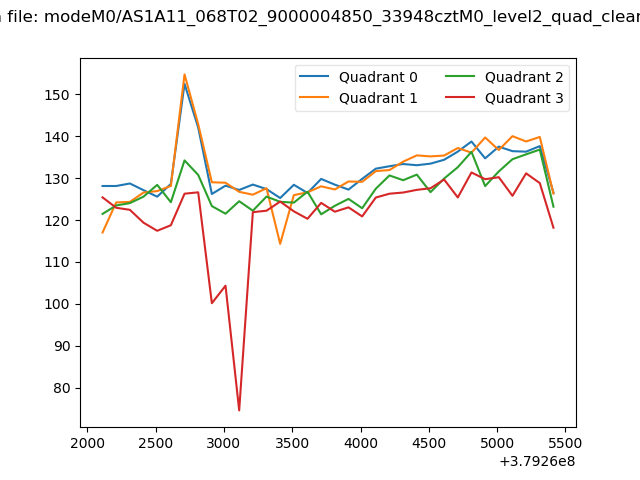 |
|
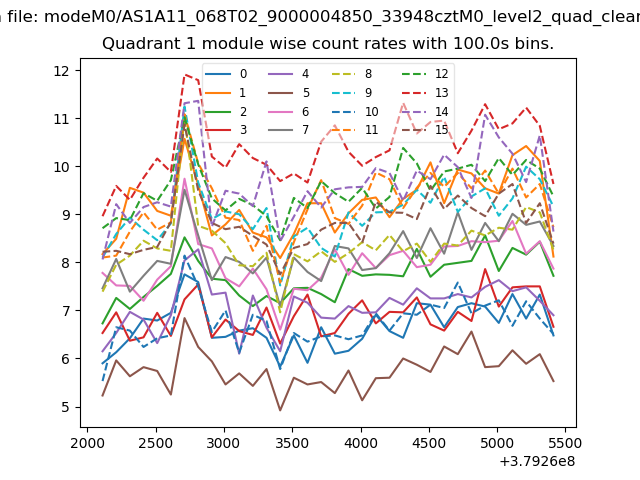
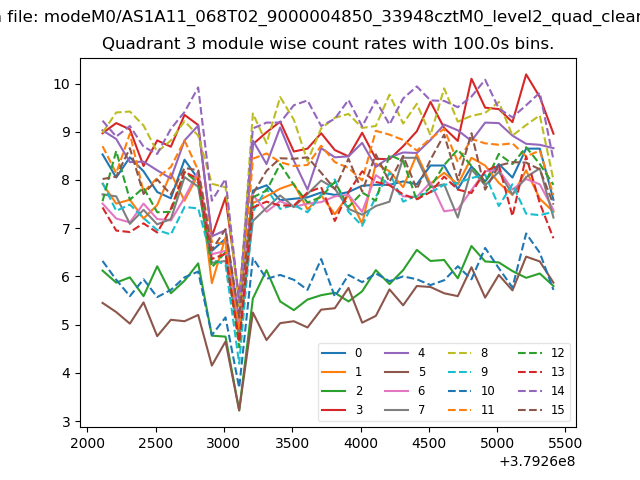
| Module-wise count rates for Quadrant A Data is divided into 100 sec bins |
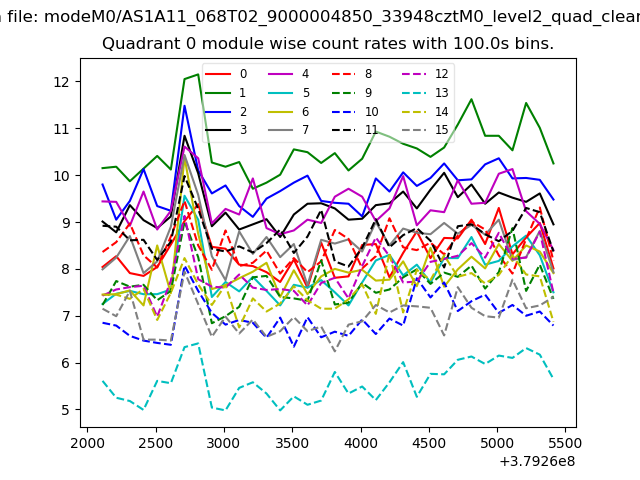 |
 |
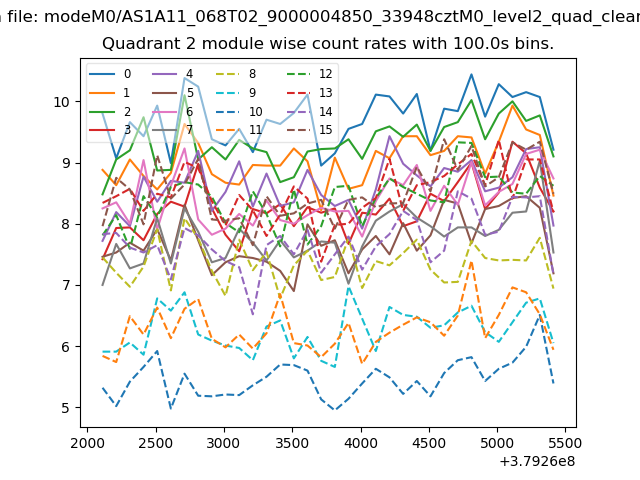
| Module-wise count rates for Quadrant B Data is divided into 100 sec bins |
 |
 |
| Module-wise count rates for Quadrant C Data is divided into 100 sec bins |
 |
 |
| Module-wise count rates for Quadrant D Data is divided into 100 sec bins |
 |
 |
| Parameter | Plot |
|---|---|
| CZT HV Monitor | 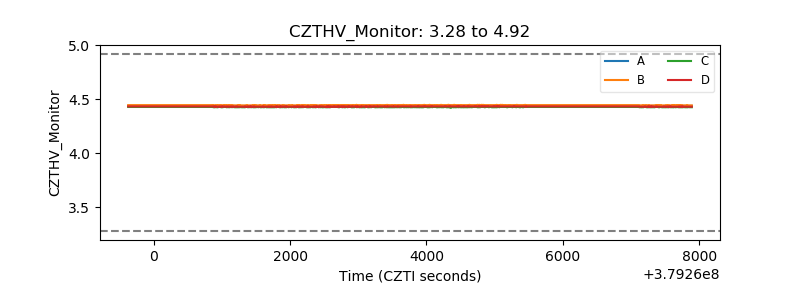 |
| D_VDD | 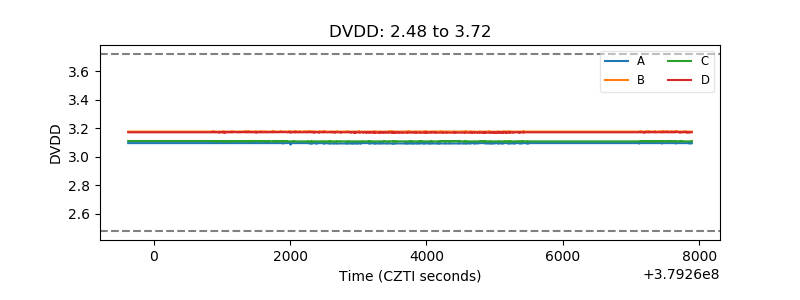 |
| Temperature 1 | 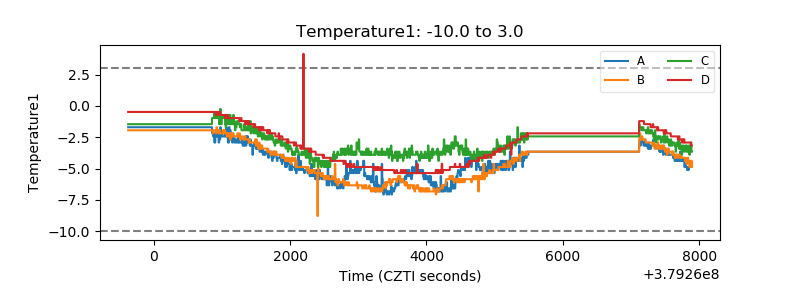 |
| Veto HV Monitor | 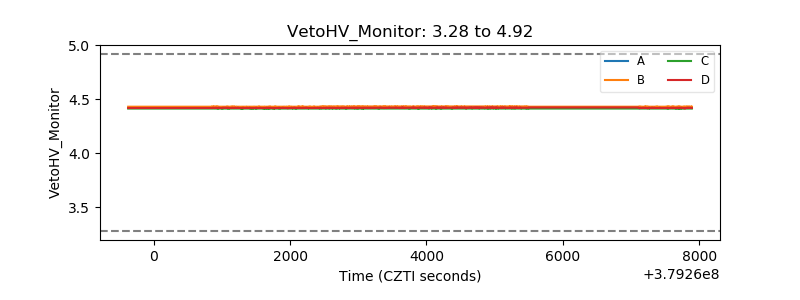 |
| Veto LLD | 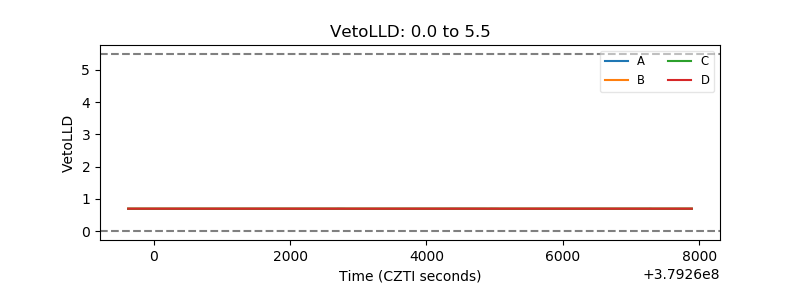 |
| Alpha Counter | 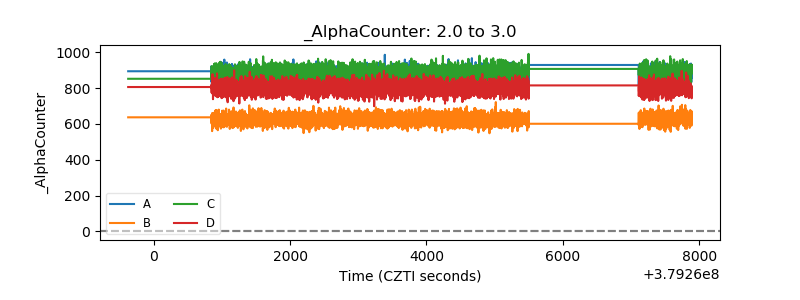 |
| _CPM_Rate | 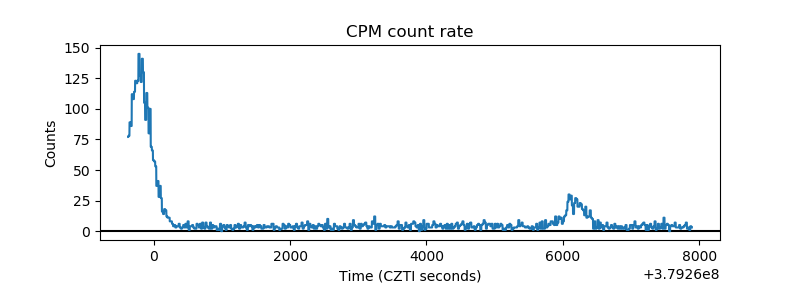 |
| CZT Counter | 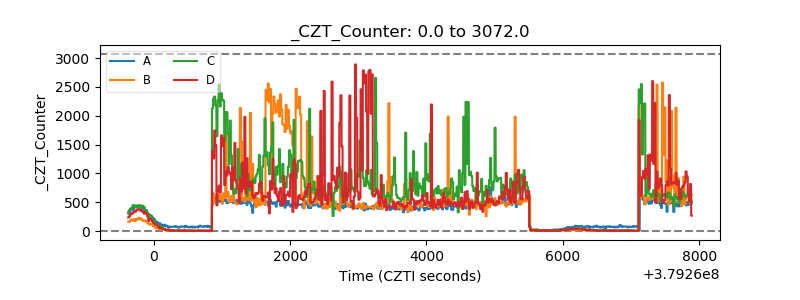 |
| +2.5 Volts monitor |  |
| +5 Volts monitor |  |
| _ROLL_ROT | 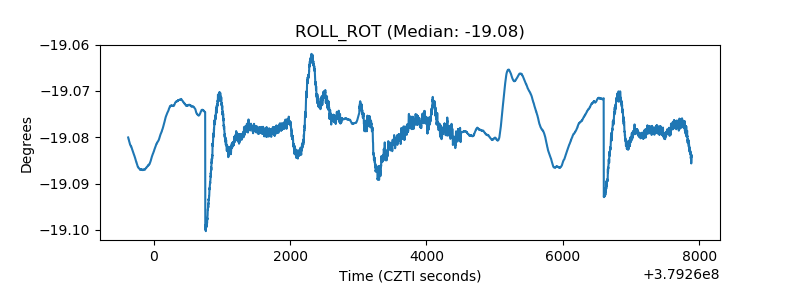 |
| _Roll_DEC |  |
| _Roll_RA | 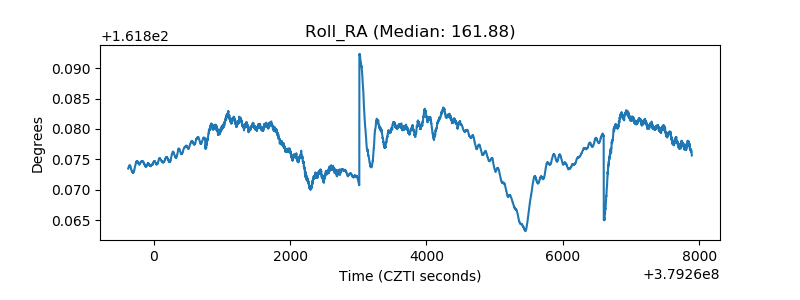 |
| Veto Counter | 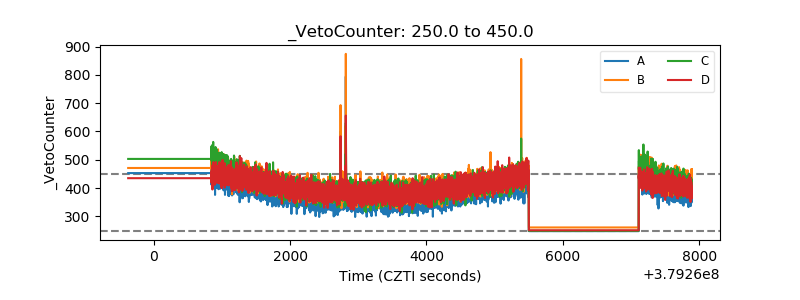 |