| Param | Original file | Final file |
|---|---|---|
| Filename | modeM0/AS1A11_068T02_9000004850_33950cztM0_level2.evt | modeM0/AS1A11_068T02_9000004850_33950cztM0_level2_quad_clean.evt |
| Size (bytes) | 501,523,200 | 88,113,600 |
| Size | 478.3 MB | 84.0 MB |
| Events in quadrant A | 2,755,269 | 574,782 |
| Events in quadrant B | 3,713,617 | 567,991 |
| Events in quadrant C | 3,632,512 | 567,216 |
| Events in quadrant D | 4,680,828 | 539,552 |
| Mode M9 | |||
|---|---|---|---|
| Quadrant | BADHDUFLAG | Total packets | Discarded packets |
| A | 0 | 23 | 0 |
| B | 0 | 23 | 0 |
| C | 0 | 23 | 0 |
| D | 0 | 24 | 0 |
| Mode SS | |||
|---|---|---|---|
| Quadrant | BADHDUFLAG | Total packets | Discarded packets |
| A | 0 | 122 | 0 |
| B | 0 | 122 | 0 |
| C | 0 | 122 | 0 |
| D | 0 | 122 | 0 |
| Mode M0 | |||
|---|---|---|---|
| Quadrant | BADHDUFLAG | Total packets | Discarded packets |
| A | 0 | 12136 | 3 |
| B | 0 | 15013 | 2 |
| C | 0 | 14393 | 2 |
| D | 0 | 18270 | 2 |
| Quadrant | Total seconds | Saturated seconds | Saturation percentage |
|---|---|---|---|
| A | 5992 | 10 | 0.166889% |
| B | 5992 | 281 | 4.689586% |
| C | 5992 | 110 | 1.835781% |
| D | 5992 | 326 | 5.440587% |
Noise dominated data is calculated using 1-second bins in cleaned event files. If a bin has >2000 counts, and if more than 50% of those come from <1% of pixels, then it is considered to be noise-dominated and hence unusable.
| Quadrant | # 1 sec bins | Bins with >0 counts | Bins with >2000 counts | High rate bins dominated by noise | Noise dominated (total time) | Noise dominated (detector-on time) | Marked lightcurve |
|---|---|---|---|---|---|---|---|
| A | 7276 | 5993 | 0 | 0 | 0.00% | 0.00% | 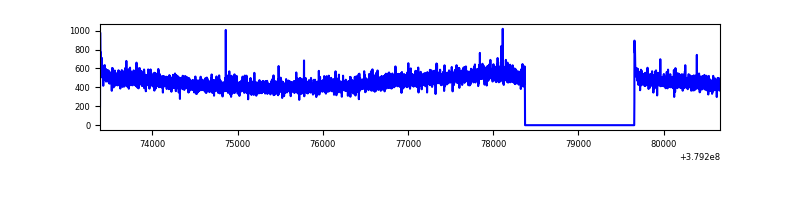 |
| B | 7276 | 5993 | 160 | 160 | 2.20% | 2.67% | 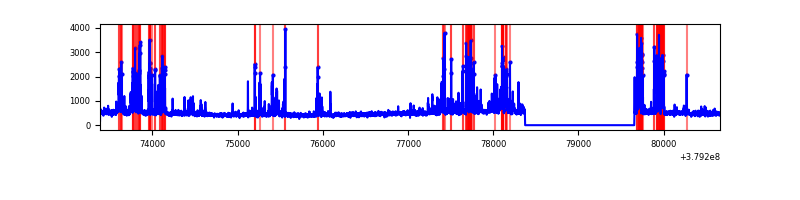 |
| C | 7276 | 5993 | 77 | 77 | 1.06% | 1.28% | 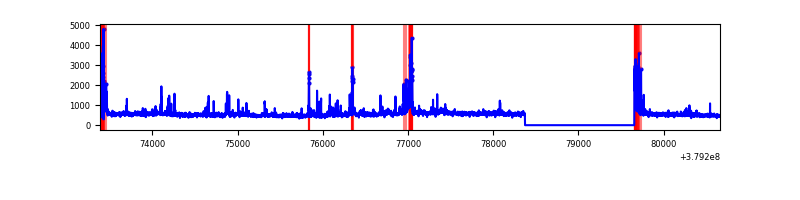 |
| D | 7276 | 5993 | 246 | 246 | 3.38% | 4.10% | 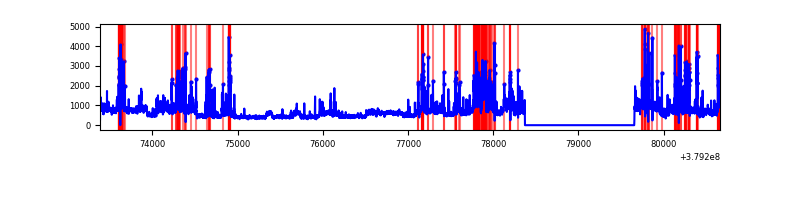 |
Top three noisy pixels from each quadrant. If the there are fewer than three noisy pixels in the level2.evt file, extra rows are filled as -1
| Pixel properties | Quadrant properties | ||||||
|---|---|---|---|---|---|---|---|
| Quadrant | DetID | PixID | Counts | Sigma | Mean | Median | Sigma |
| A | 10 | 83 | 15133 | 101.83 | 706 | 693 | 141.8 |
| A | 13 | 254 | 10318 | 67.88 | 706 | 693 | 141.8 |
| A | 13 | 6 | 9458 | 61.81 | 706 | 693 | 141.8 |
| B | 5 | 172 | 836080 | 6273.13 | 688 | 670 | 133.2 |
| B | 0 | 229 | 48636 | 360.18 | 688 | 670 | 133.2 |
| B | 0 | 219 | 30997 | 227.73 | 688 | 670 | 133.2 |
| C | 3 | 233 | 410611 | 2560.97 | 680 | 685 | 160.1 |
| C | 0 | 10 | 274470 | 1710.44 | 680 | 685 | 160.1 |
| C | 15 | 214 | 259150 | 1614.73 | 680 | 685 | 160.1 |
| D | 8 | 195 | 883961 | 5342.37 | 671 | 652 | 165.3 |
| D | 2 | 250 | 654464 | 3954.34 | 671 | 652 | 165.3 |
| D | 13 | 249 | 320667 | 1935.49 | 671 | 652 | 165.3 |
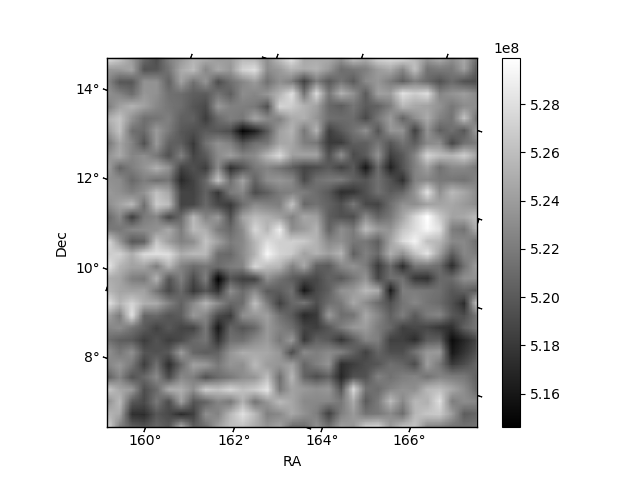
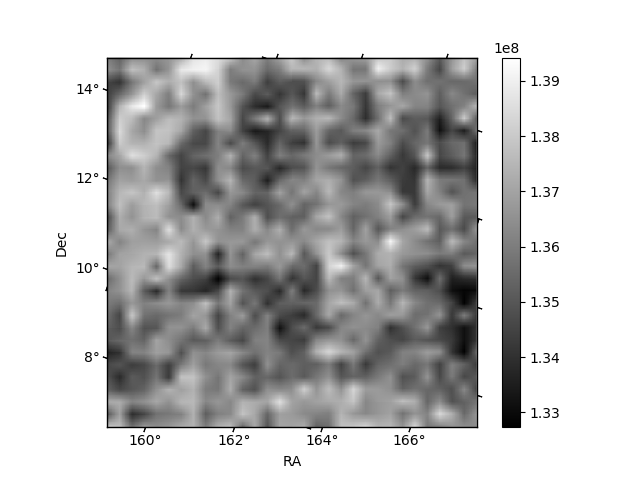
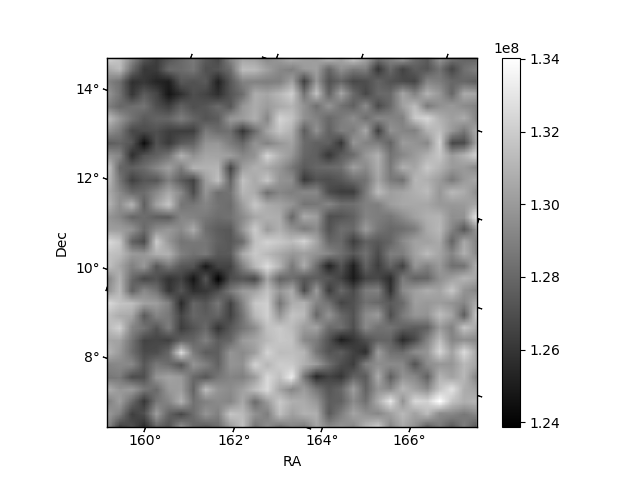
Histogram calculated using DETX and DETY for each event in the final _common_clean file
| Quadrant A | 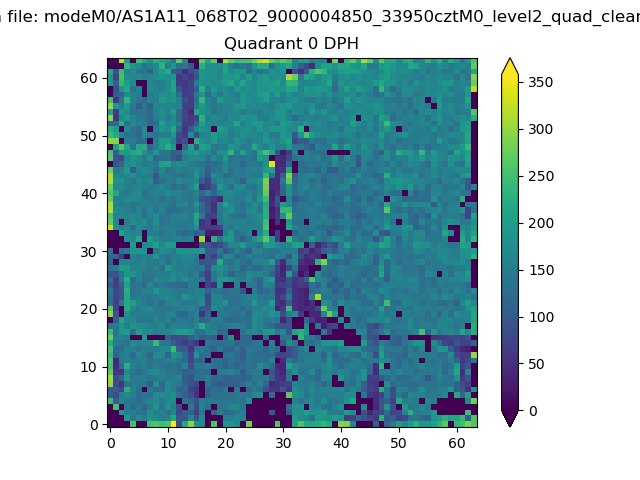 |
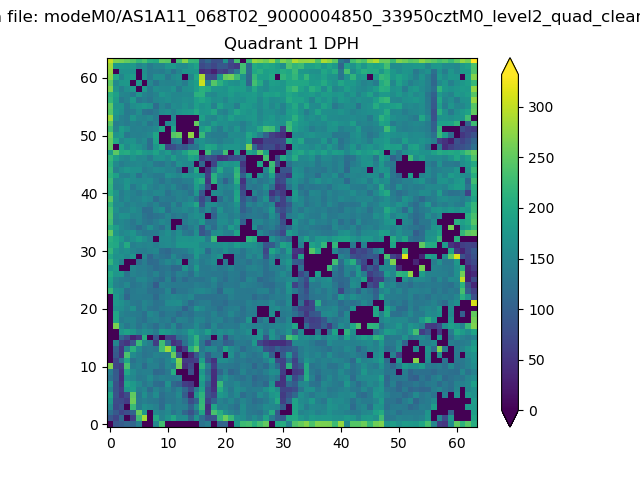 |
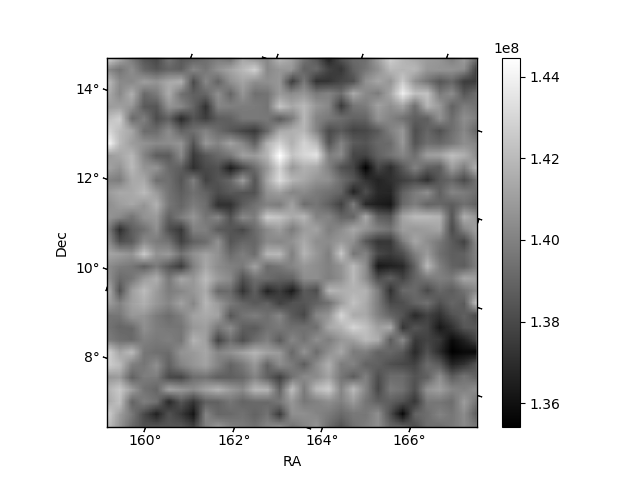
Quadrant B |
|---|---|---|---|
| Quadrant D | 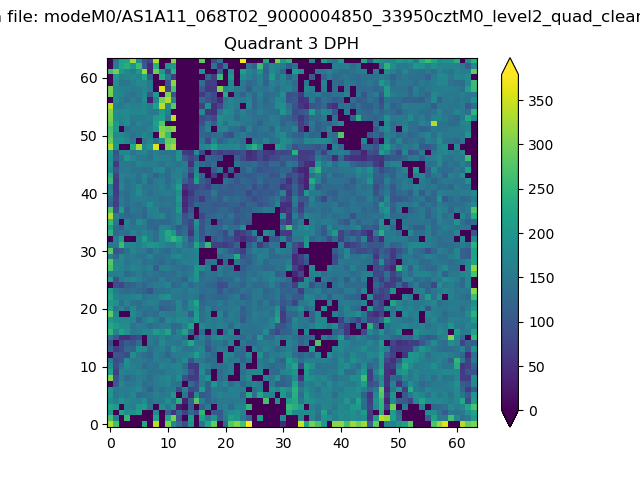 |
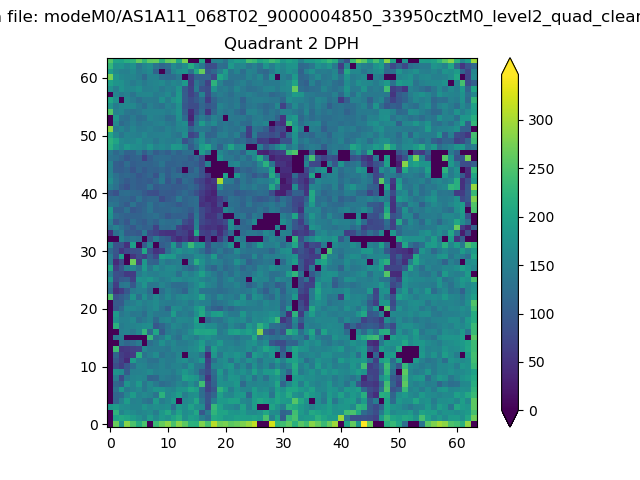 |
Quadrant C |
| Plot type | Count rate plots | Images |
|---|---|---|
| Comparison with Poisson distribution Blue bars denote a histogram of data divided into 1 sec bins. Red curve is a Poisson curve with rate = median count rate of data. |
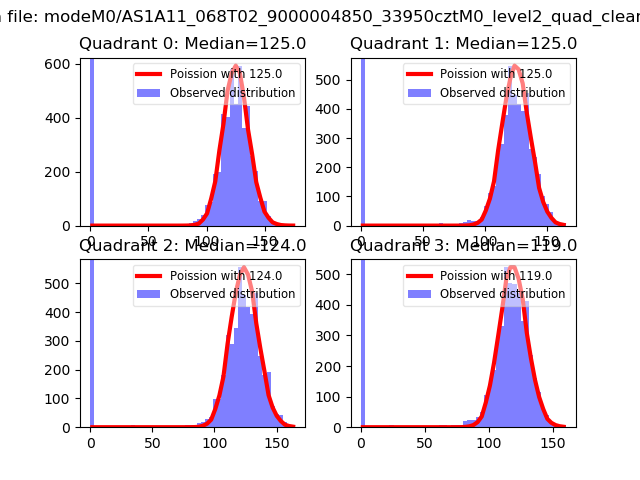 |
 |
| Quadrant-wise count rates Data is divided into 100 sec bins |
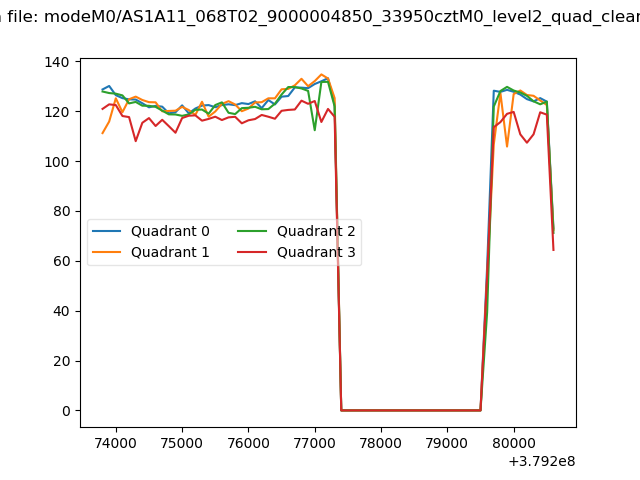 |
|
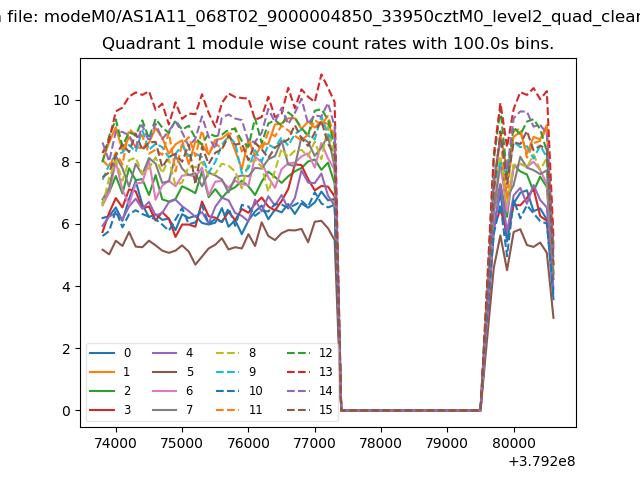
| Module-wise count rates for Quadrant A Data is divided into 100 sec bins |
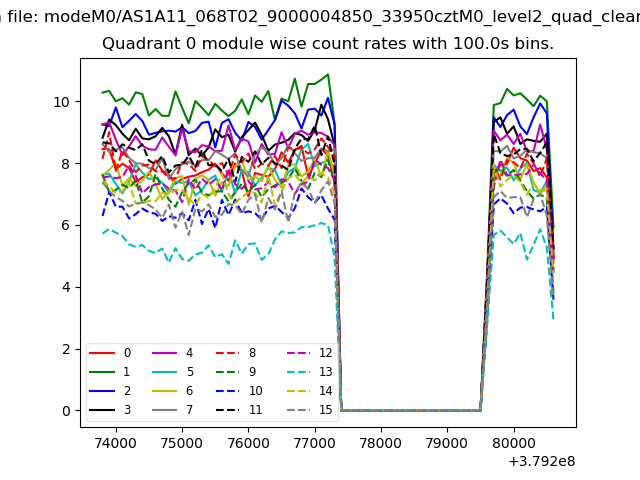 |
 |
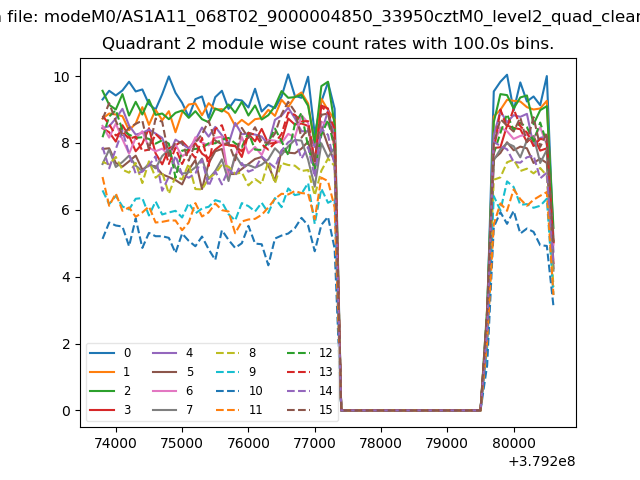
| Module-wise count rates for Quadrant B Data is divided into 100 sec bins |
 |
 |
| Module-wise count rates for Quadrant C Data is divided into 100 sec bins |
 |
 |
| Module-wise count rates for Quadrant D Data is divided into 100 sec bins |
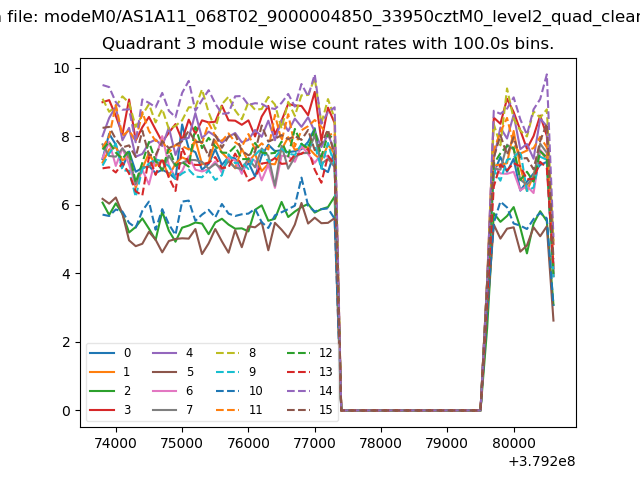 |
 |
| Parameter | Plot |
|---|---|
| CZT HV Monitor | 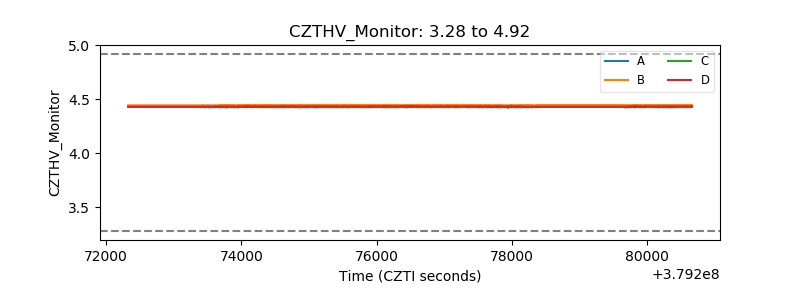 |
| D_VDD | 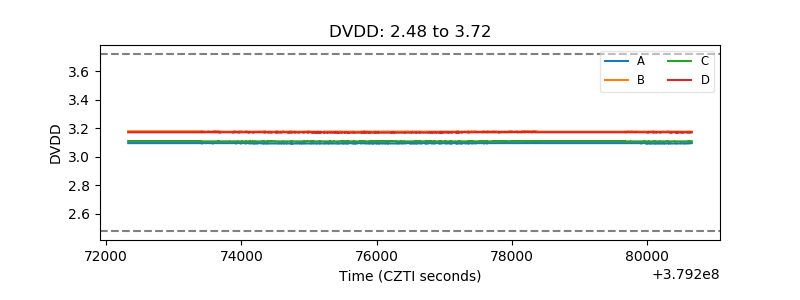 |
| Temperature 1 | 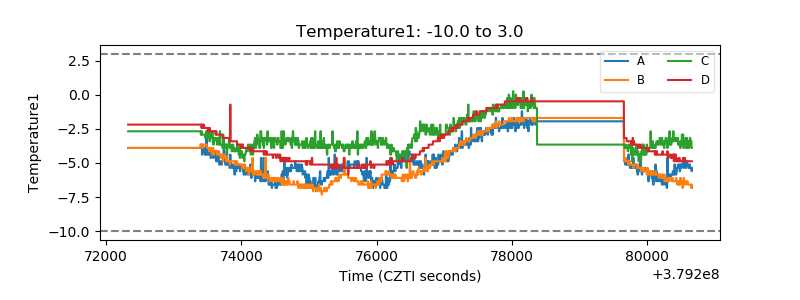 |
| Veto HV Monitor | 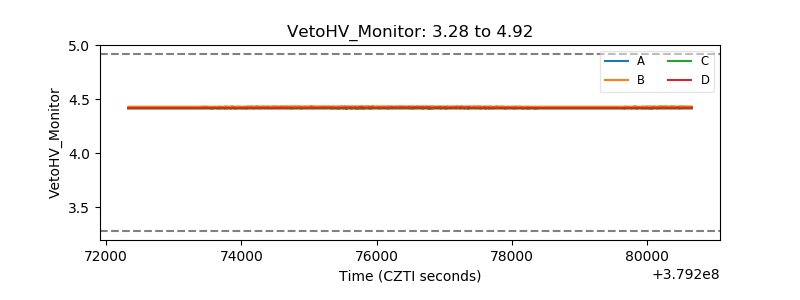 |
| Veto LLD | 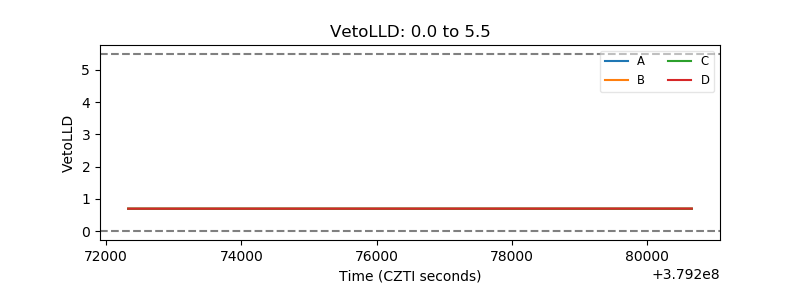 |
| Alpha Counter | 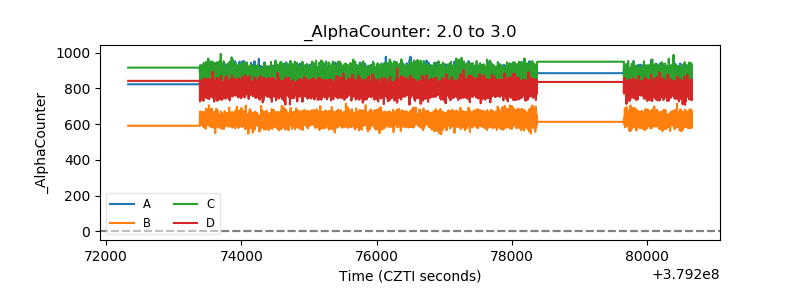 |
| _CPM_Rate | 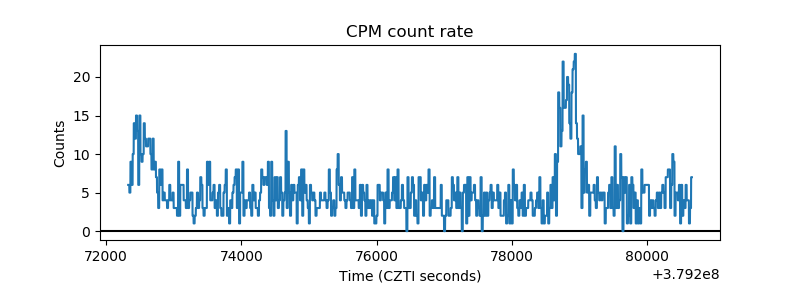 |
| CZT Counter | 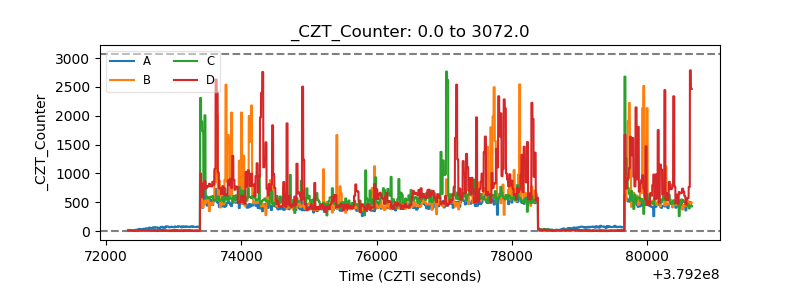 |
| +2.5 Volts monitor | 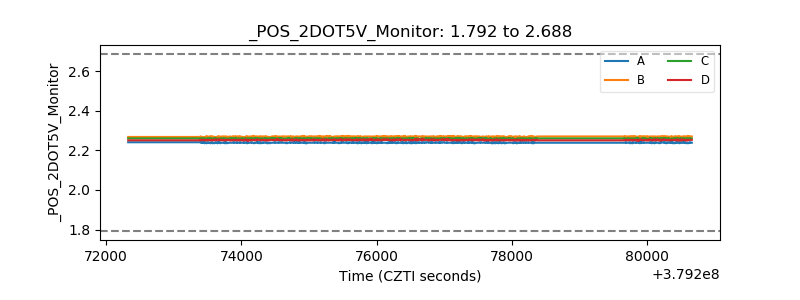 |
| +5 Volts monitor |  |
| _ROLL_ROT | 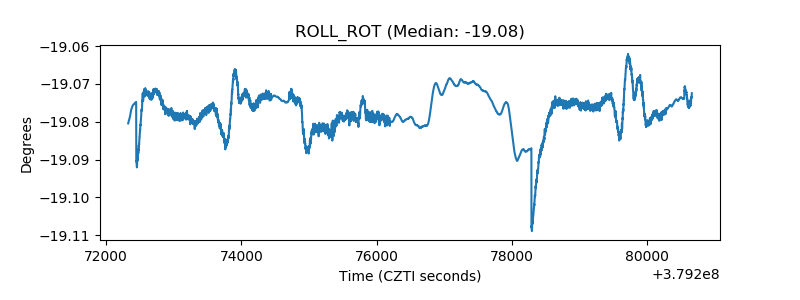 |
| _Roll_DEC | 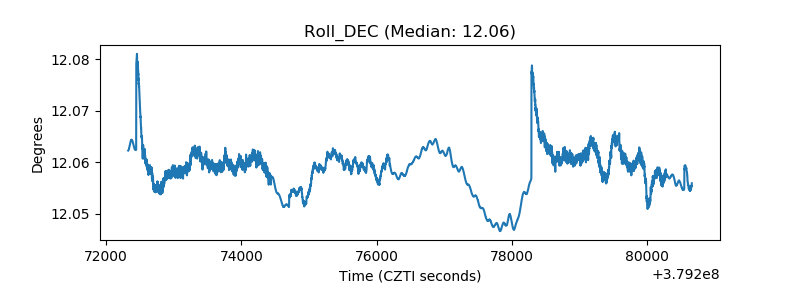 |
| _Roll_RA | 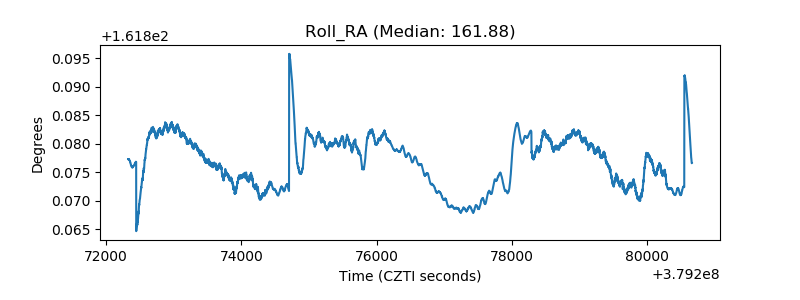 |
| Veto Counter | 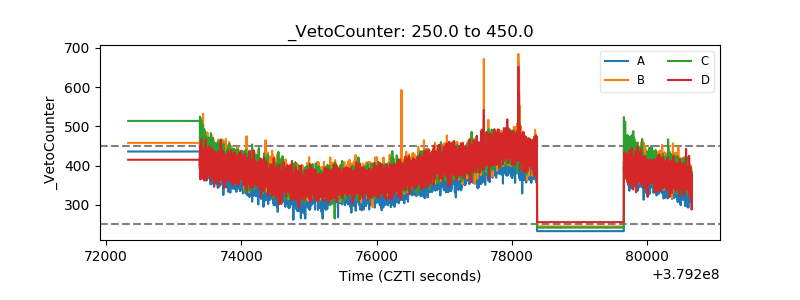 |