| Param | Original file | Final file |
|---|---|---|
| Filename | modeM0/AS1A11_068T02_9000004850_33952cztM0_level2.evt | modeM0/AS1A11_068T02_9000004850_33952cztM0_level2_quad_clean.evt |
| Size (bytes) | 138,358,080 | 30,902,400 |
| Size | 131.9 MB | 29.5 MB |
| Events in quadrant A | 739,642 | 209,155 |
| Events in quadrant B | 1,018,962 | 203,714 |
| Events in quadrant C | 919,465 | 205,715 |
| Events in quadrant D | 1,394,874 | 192,778 |
| Mode M9 | |||
|---|---|---|---|
| Quadrant | BADHDUFLAG | Total packets | Discarded packets |
| A | 0 | 6 | 0 |
| B | 0 | 6 | 0 |
| C | 0 | 6 | 0 |
| D | 0 | 7 | 0 |
| Mode SS | |||
|---|---|---|---|
| Quadrant | BADHDUFLAG | Total packets | Discarded packets |
| A | 0 | 34 | 0 |
| B | 0 | 34 | 0 |
| C | 0 | 34 | 0 |
| D | 0 | 34 | 0 |
| Mode M0 | |||
|---|---|---|---|
| Quadrant | BADHDUFLAG | Total packets | Discarded packets |
| A | 0 | 3394 | 1 |
| B | 0 | 4143 | 1 |
| C | 0 | 3748 | 1 |
| D | 0 | 5387 | 1 |
| Quadrant | Total seconds | Saturated seconds | Saturation percentage |
|---|---|---|---|
| A | 1687 | 1 | 0.059277% |
| B | 1687 | 87 | 5.157084% |
| C | 1687 | 37 | 2.193242% |
| D | 1687 | 95 | 5.631298% |
Noise dominated data is calculated using 1-second bins in cleaned event files. If a bin has >2000 counts, and if more than 50% of those come from <1% of pixels, then it is considered to be noise-dominated and hence unusable.
| Quadrant | # 1 sec bins | Bins with >0 counts | Bins with >2000 counts | High rate bins dominated by noise | Noise dominated (total time) | Noise dominated (detector-on time) | Marked lightcurve |
|---|---|---|---|---|---|---|---|
| A | 1687 | 1687 | 0 | 0 | 0.00% | 0.00% | 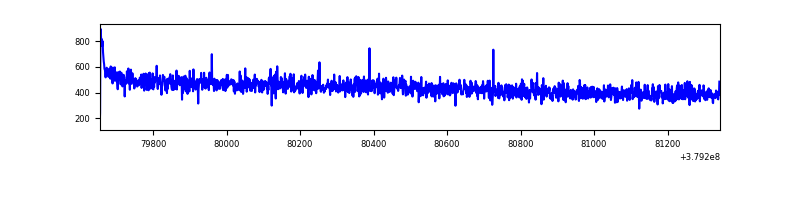 |
| B | 1687 | 1687 | 61 | 61 | 3.62% | 3.62% | 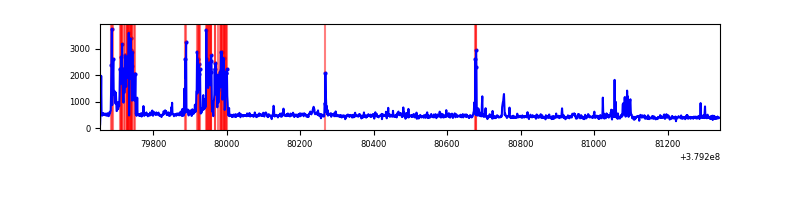 |
| C | 1687 | 1687 | 20 | 20 | 1.19% | 1.19% | 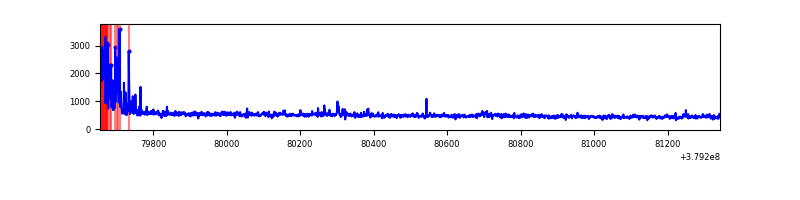 |
| D | 1687 | 1687 | 80 | 80 | 4.74% | 4.74% | 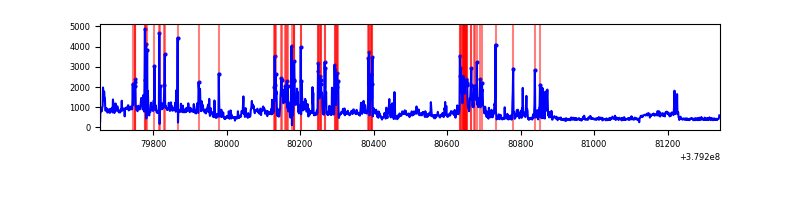 |
Top three noisy pixels from each quadrant. If the there are fewer than three noisy pixels in the level2.evt file, extra rows are filled as -1
| Pixel properties | Quadrant properties | ||||||
|---|---|---|---|---|---|---|---|
| Quadrant | DetID | PixID | Counts | Sigma | Mean | Median | Sigma |
| A | 10 | 83 | 6912 | 170.58 | 188 | 185 | 39.4 |
| A | 13 | 6 | 4111 | 99.55 | 188 | 185 | 39.4 |
| A | 13 | 254 | 2733 | 64.61 | 188 | 185 | 39.4 |
| B | 5 | 172 | 231947 | 6108.16 | 186 | 181 | 37.9 |
| B | 3 | 112 | 15755 | 410.45 | 186 | 181 | 37.9 |
| B | 0 | 219 | 8958 | 231.32 | 186 | 181 | 37.9 |
| C | 0 | 10 | 91189 | 2026.62 | 184 | 185 | 44.9 |
| C | 15 | 214 | 74950 | 1664.98 | 184 | 185 | 44.9 |
| C | 3 | 233 | 25458 | 562.82 | 184 | 185 | 44.9 |
| D | 8 | 195 | 264042 | 5747.05 | 179 | 173 | 45.9 |
| D | 2 | 250 | 233447 | 5080.69 | 179 | 173 | 45.9 |
| D | 12 | 6 | 100355 | 2181.96 | 179 | 173 | 45.9 |
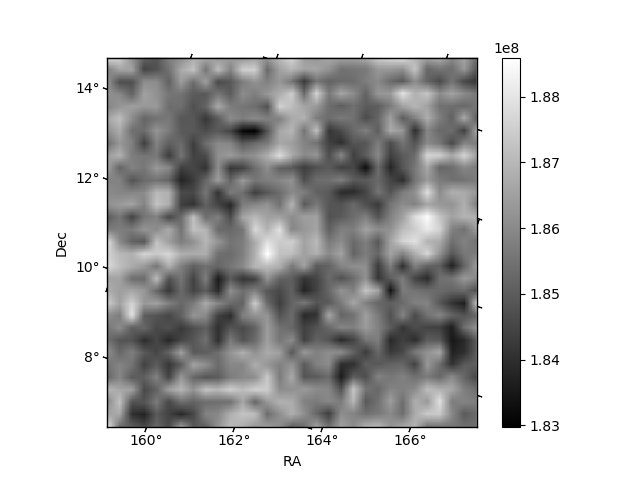
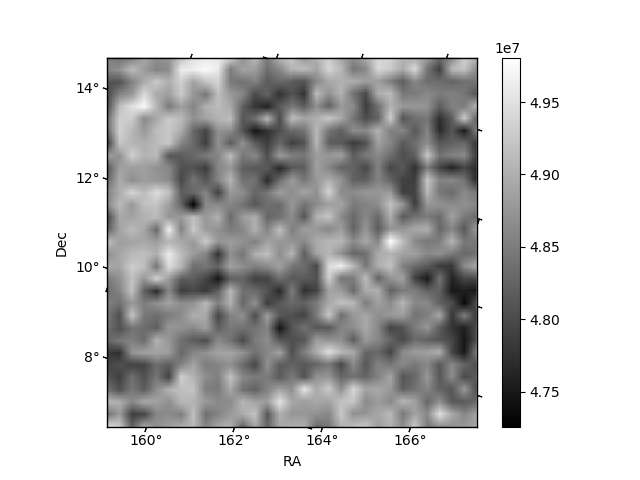
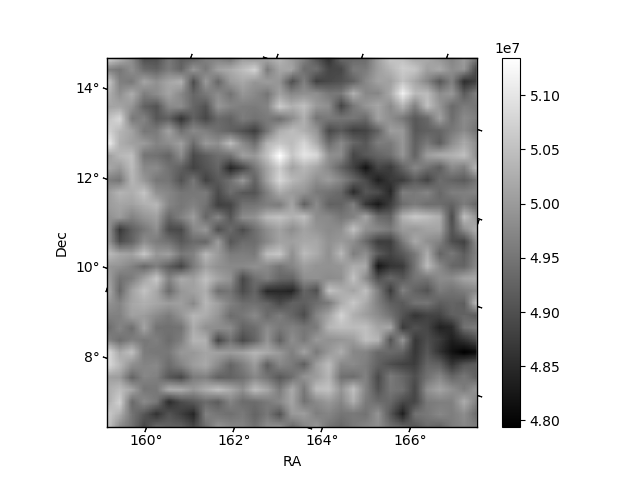
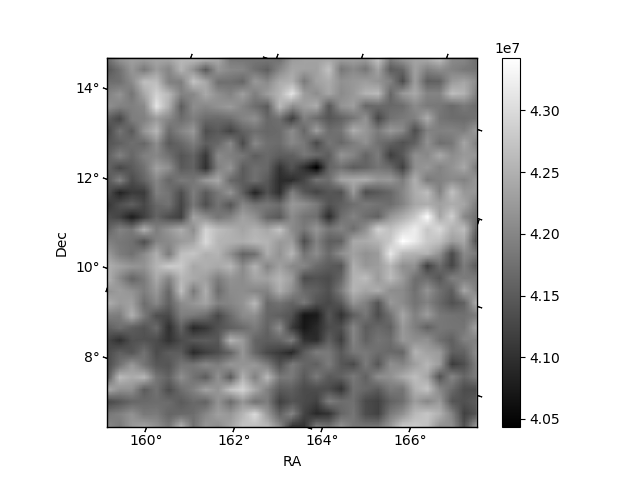
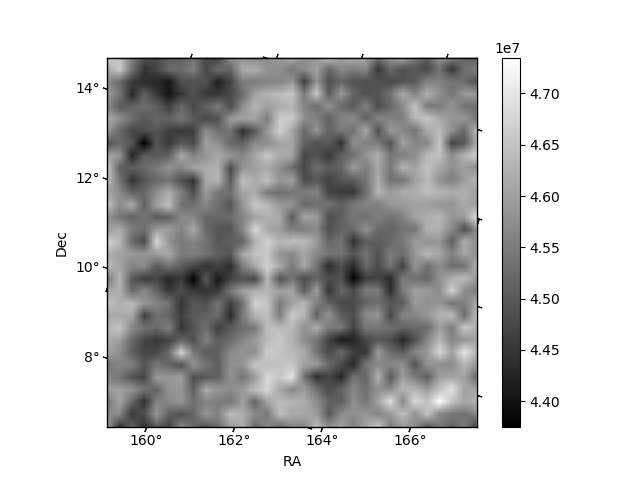
Histogram calculated using DETX and DETY for each event in the final _common_clean file
| Quadrant A | 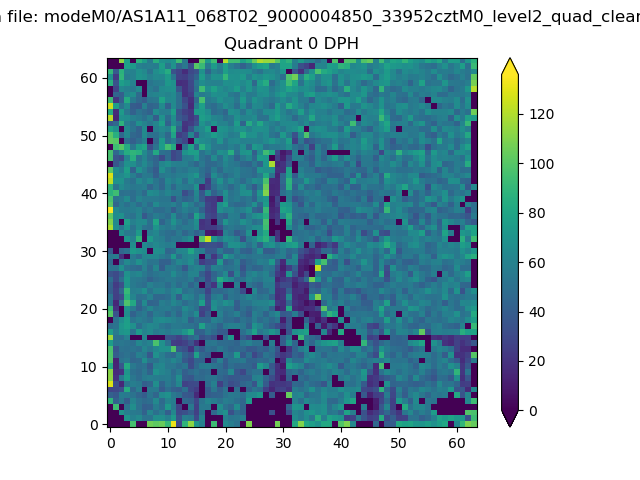 |
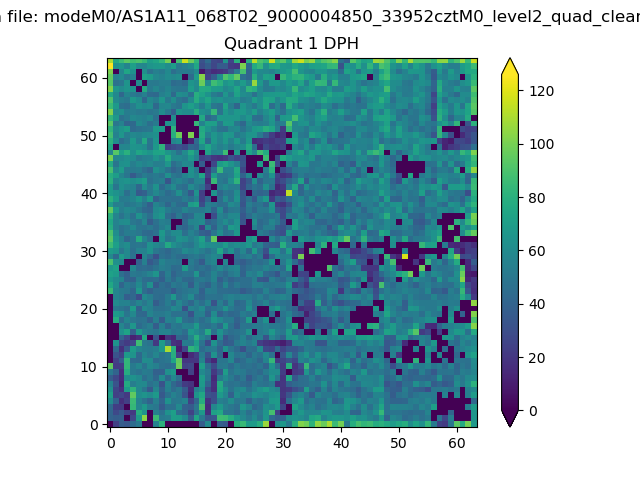 |
Quadrant B |
|---|---|---|---|
| Quadrant D | 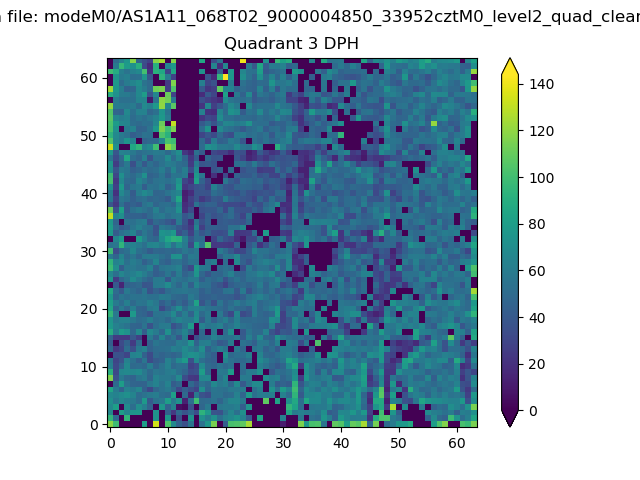 |
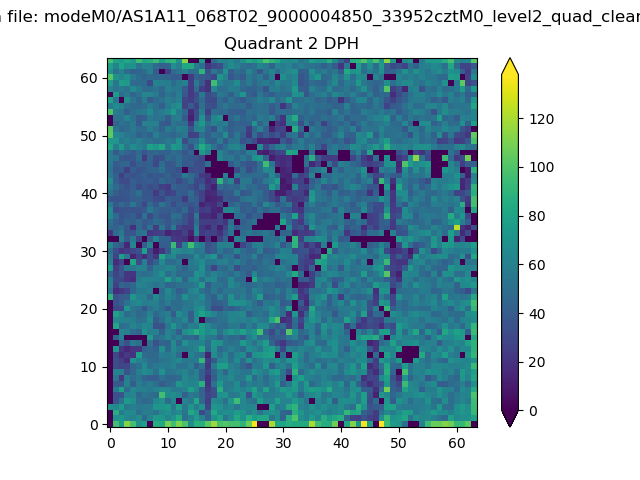 |
Quadrant C |
| Plot type | Count rate plots | Images |
|---|---|---|
| Comparison with Poisson distribution Blue bars denote a histogram of data divided into 1 sec bins. Red curve is a Poisson curve with rate = median count rate of data. |
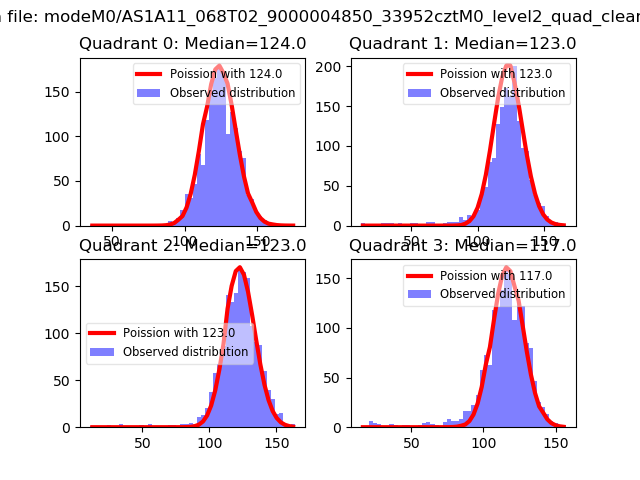 |
 |
| Quadrant-wise count rates Data is divided into 100 sec bins |
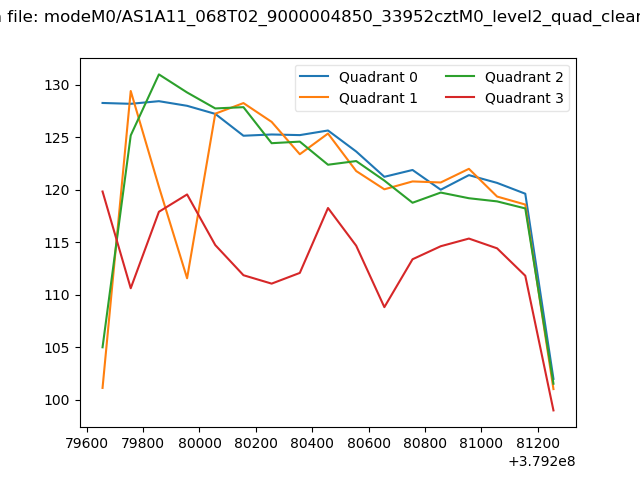 |
|
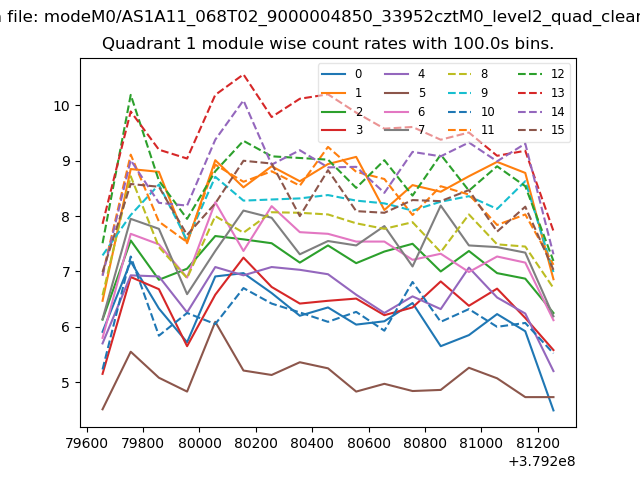
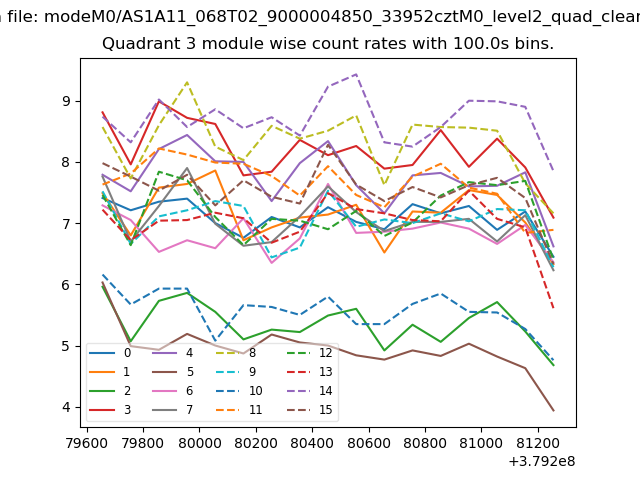
| Module-wise count rates for Quadrant A Data is divided into 100 sec bins |
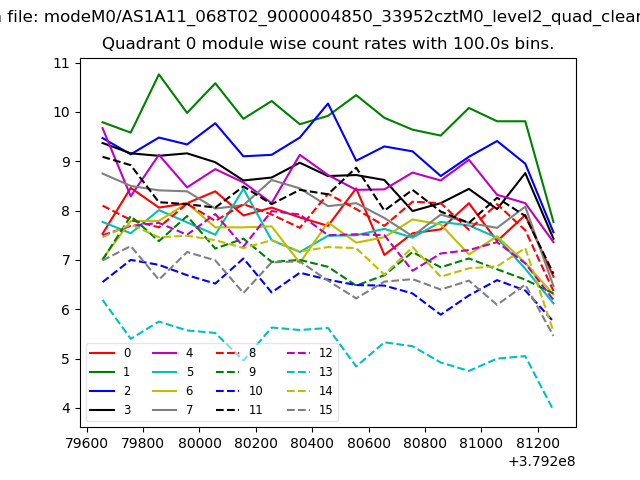 |
 |
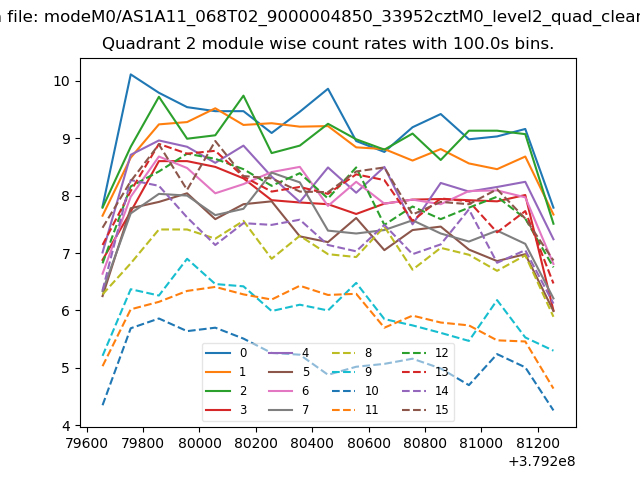
| Module-wise count rates for Quadrant B Data is divided into 100 sec bins |
 |
 |
| Module-wise count rates for Quadrant C Data is divided into 100 sec bins |
 |
 |
| Module-wise count rates for Quadrant D Data is divided into 100 sec bins |
 |
 |
| Parameter | Plot |
|---|---|
| CZT HV Monitor | 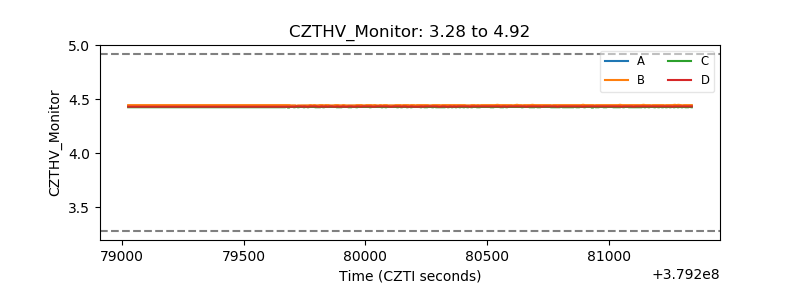 |
| D_VDD | 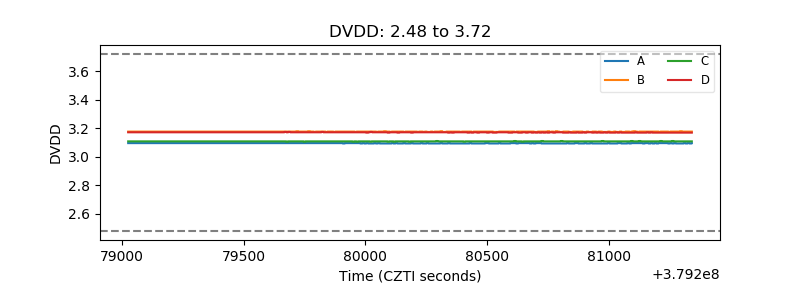 |
| Temperature 1 | 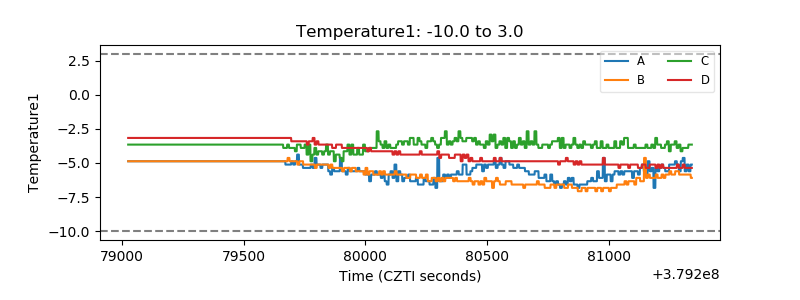 |
| Veto HV Monitor | 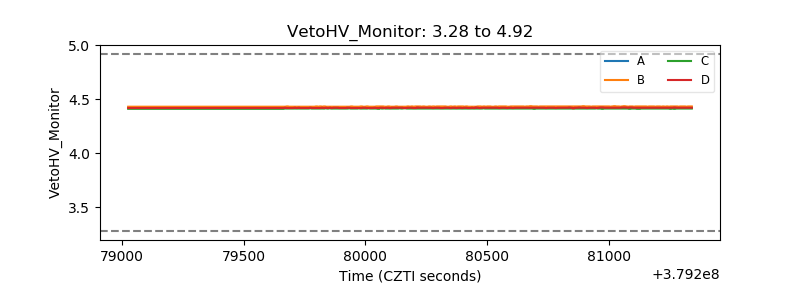 |
| Veto LLD | 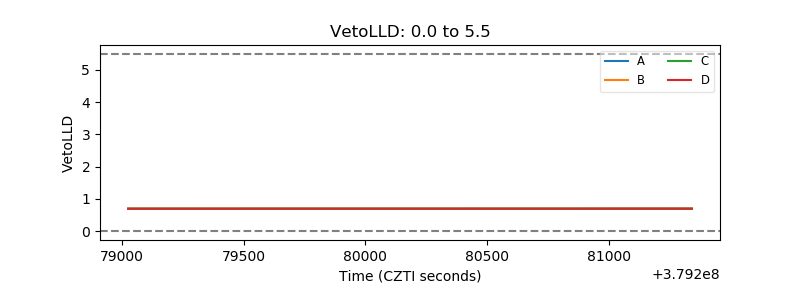 |
| Alpha Counter | 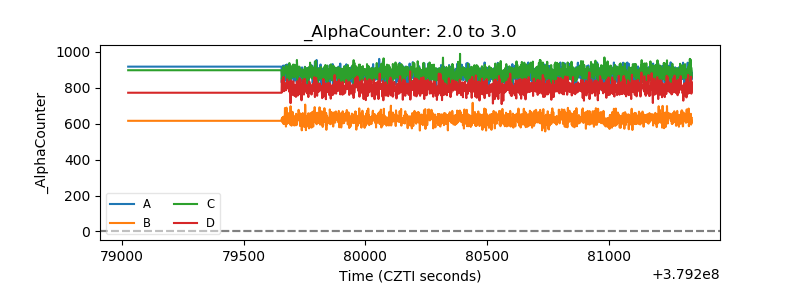 |
| _CPM_Rate | 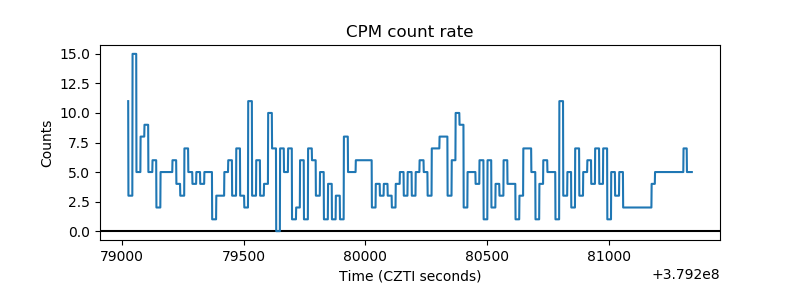 |
| CZT Counter | 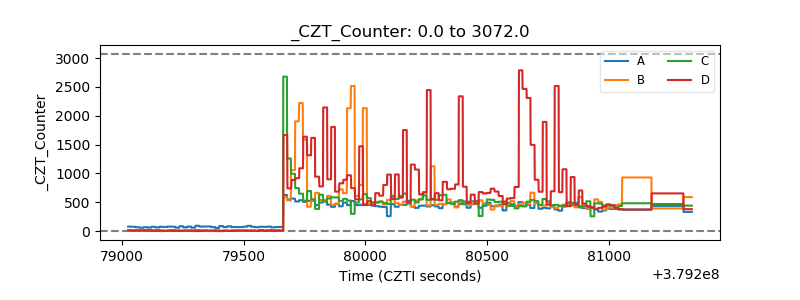 |
| +2.5 Volts monitor |  |
| +5 Volts monitor |  |
| _ROLL_ROT | 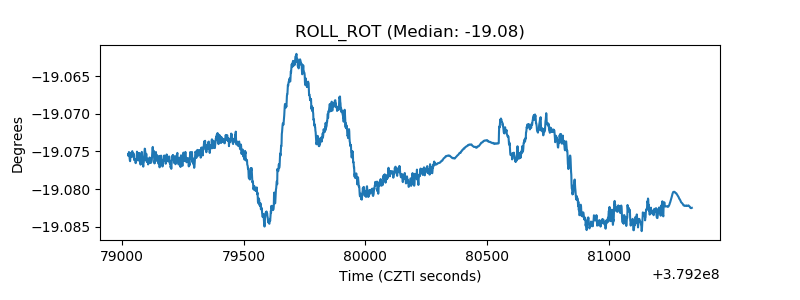 |
| _Roll_DEC | 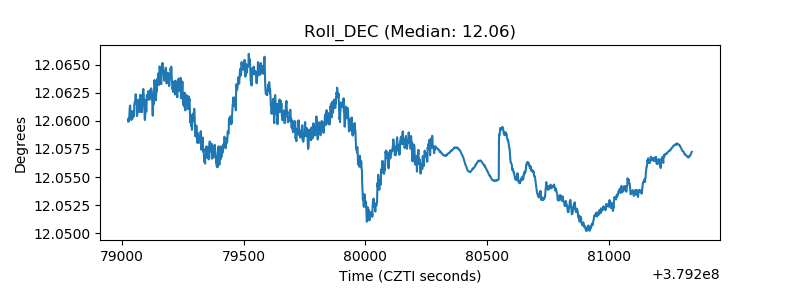 |
| _Roll_RA | 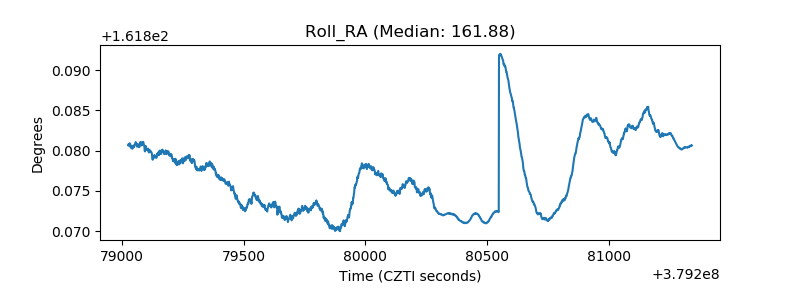 |
| Veto Counter |  |