| Param | Original file | Final file |
|---|---|---|
| Filename | modeM0/AS1A11_068T02_9000004850_34124cztM0_level2.evt | modeM0/AS1A11_068T02_9000004850_34124cztM0_level2_quad_clean.evt |
| Size (bytes) | 82,892,160 | 18,466,560 |
| Size | 79.1 MB | 17.6 MB |
| Events in quadrant A | 489,284 | 124,105 |
| Events in quadrant B | 632,670 | 124,900 |
| Events in quadrant C | 626,917 | 117,848 |
| Events in quadrant D | 691,017 | 115,268 |
| Mode SS | |||
|---|---|---|---|
| Quadrant | BADHDUFLAG | Total packets | Discarded packets |
| A | 0 | 20 | 0 |
| B | 0 | 20 | 0 |
| C | 0 | 20 | 0 |
| D | 0 | 20 | 0 |
| Mode M0 | |||
|---|---|---|---|
| Quadrant | BADHDUFLAG | Total packets | Discarded packets |
| A | 0 | 2021 | 2 |
| B | 0 | 2518 | 1 |
| C | 0 | 2418 | 1 |
| D | 0 | 2724 | 1 |
| Quadrant | Total seconds | Saturated seconds | Saturation percentage |
|---|---|---|---|
| A | 992 | 3 | 0.302419% |
| B | 992 | 14 | 1.411290% |
| C | 992 | 33 | 3.326613% |
| D | 992 | 14 | 1.411290% |
Noise dominated data is calculated using 1-second bins in cleaned event files. If a bin has >2000 counts, and if more than 50% of those come from <1% of pixels, then it is considered to be noise-dominated and hence unusable.
| Quadrant | # 1 sec bins | Bins with >0 counts | Bins with >2000 counts | High rate bins dominated by noise | Noise dominated (total time) | Noise dominated (detector-on time) | Marked lightcurve |
|---|---|---|---|---|---|---|---|
| A | 992 | 992 | 0 | 0 | 0.00% | 0.00% | 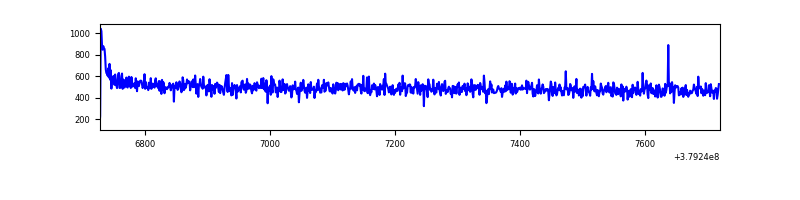 |
| B | 992 | 992 | 5 | 5 | 0.50% | 0.50% | 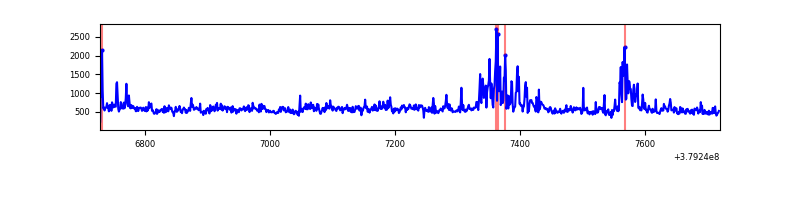 |
| C | 992 | 992 | 18 | 18 | 1.81% | 1.81% | 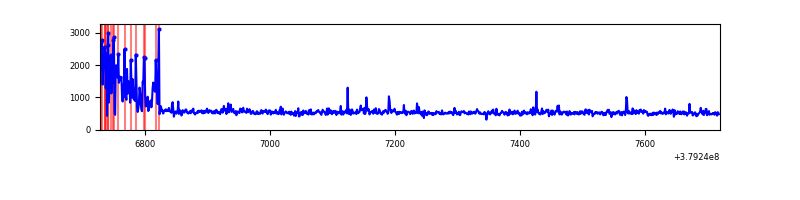 |
| D | 992 | 992 | 9 | 9 | 0.91% | 0.91% | 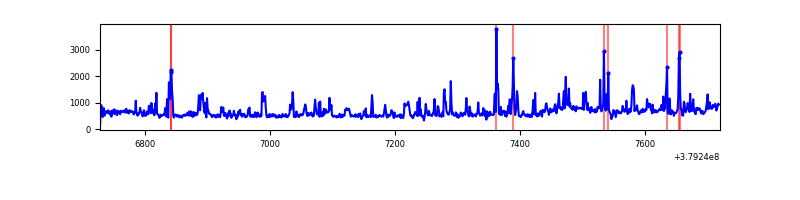 |
Top three noisy pixels from each quadrant. If the there are fewer than three noisy pixels in the level2.evt file, extra rows are filled as -1
| Pixel properties | Quadrant properties | ||||||
|---|---|---|---|---|---|---|---|
| Quadrant | DetID | PixID | Counts | Sigma | Mean | Median | Sigma |
| A | 10 | 83 | 9380 | 336.72 | 123 | 120 | 27.5 |
| A | 13 | 6 | 2900 | 101.09 | 123 | 120 | 27.5 |
| A | 13 | 254 | 1877 | 63.89 | 123 | 120 | 27.5 |
| B | 5 | 172 | 77907 | 3073.2 | 121 | 118 | 25.3 |
| B | 0 | 219 | 58777 | 2317.43 | 121 | 118 | 25.3 |
| B | 5 | 173 | 8814 | 343.55 | 121 | 118 | 25.3 |
| C | 0 | 10 | 119410 | 4101.91 | 117 | 117 | 29.1 |
| C | 15 | 214 | 46238 | 1585.88 | 117 | 117 | 29.1 |
| C | 12 | 250 | 1697 | 54.33 | 117 | 117 | 29.1 |
| D | 8 | 195 | 83160 | 2573.54 | 120 | 116 | 32.3 |
| D | 12 | 233 | 41658 | 1287.39 | 120 | 116 | 32.3 |
| D | 13 | 249 | 27931 | 861.99 | 120 | 116 | 32.3 |
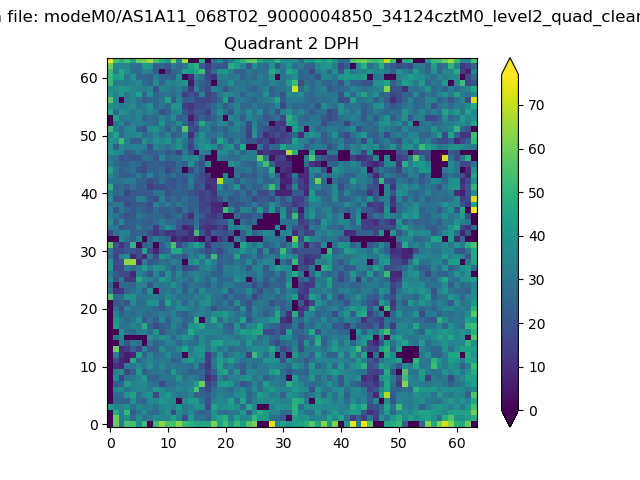
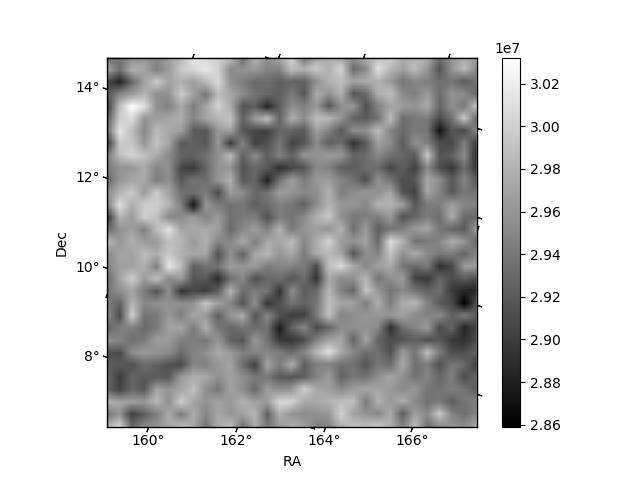
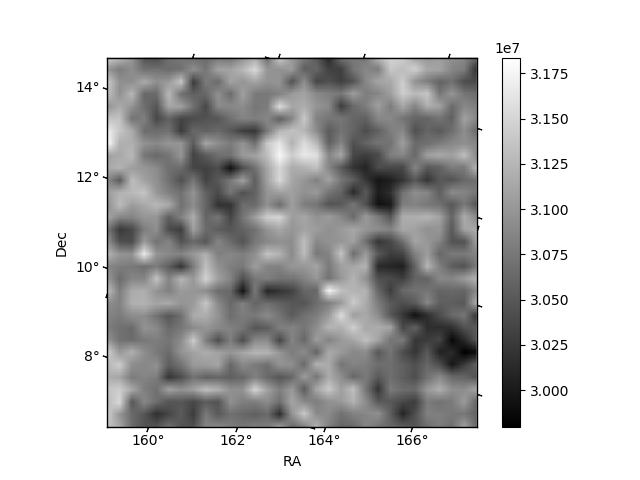
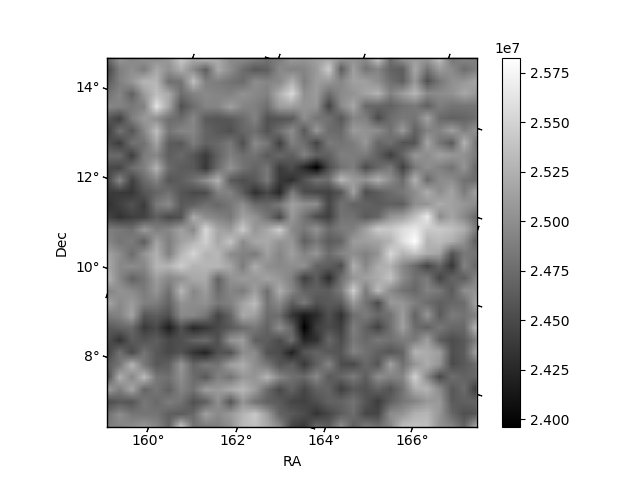
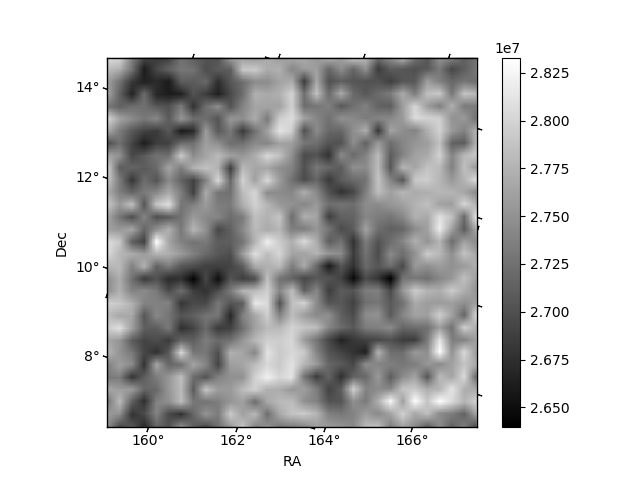
Histogram calculated using DETX and DETY for each event in the final _common_clean file
| Quadrant A | 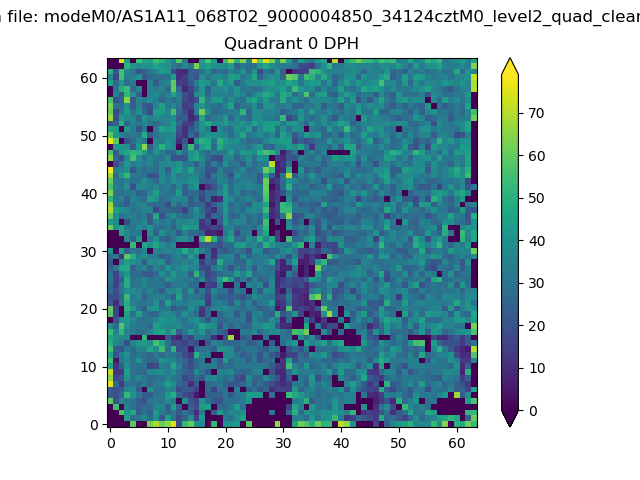 |
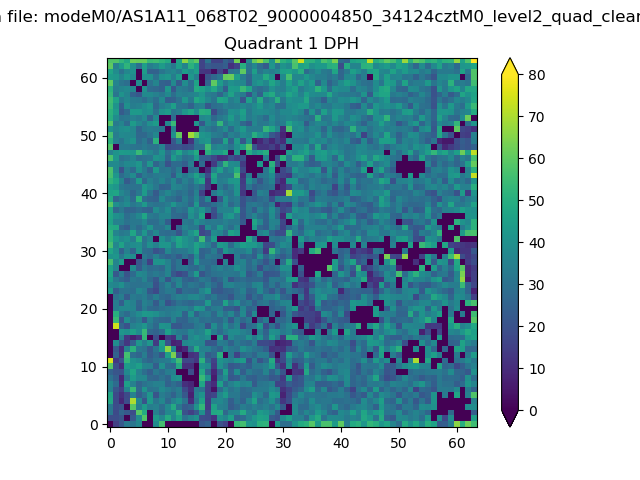 |
Quadrant B |
|---|---|---|---|
| Quadrant D | 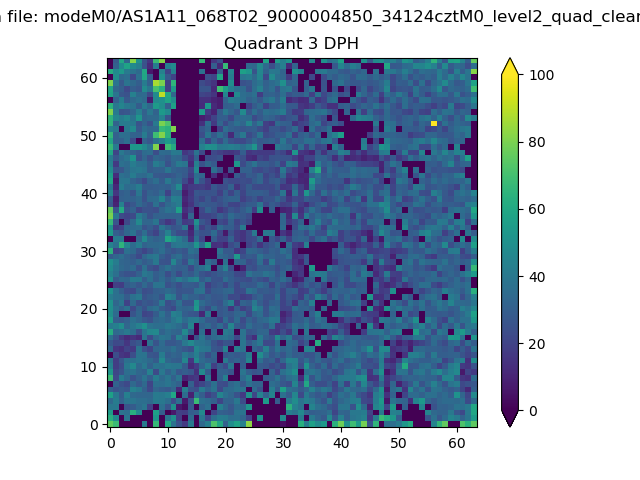 |
 |
Quadrant C |
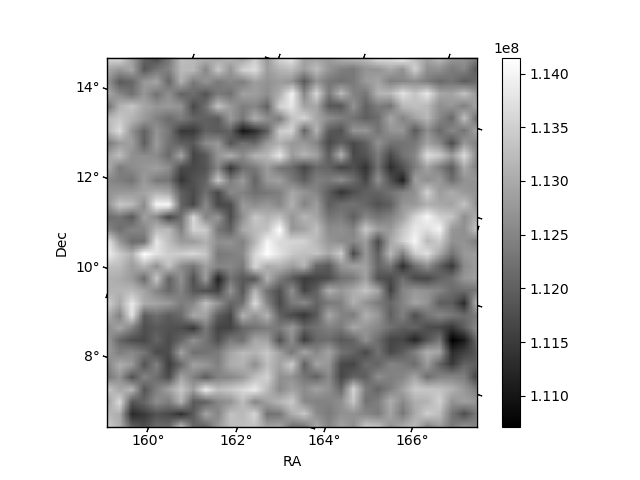
| Plot type | Count rate plots | Images |
|---|---|---|
| Comparison with Poisson distribution Blue bars denote a histogram of data divided into 1 sec bins. Red curve is a Poisson curve with rate = median count rate of data. |
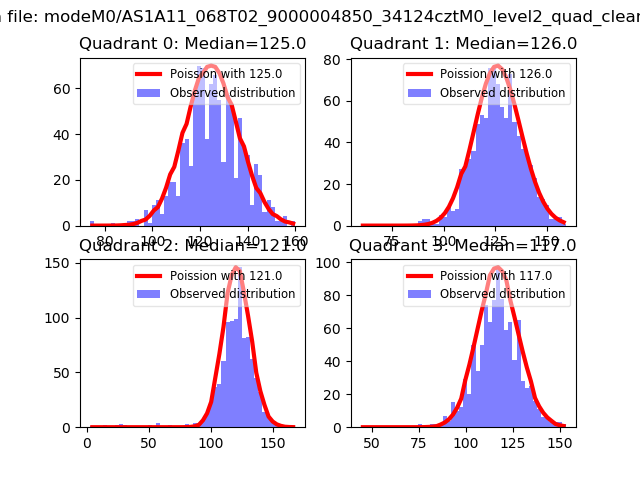 |
 |
| Quadrant-wise count rates Data is divided into 100 sec bins |
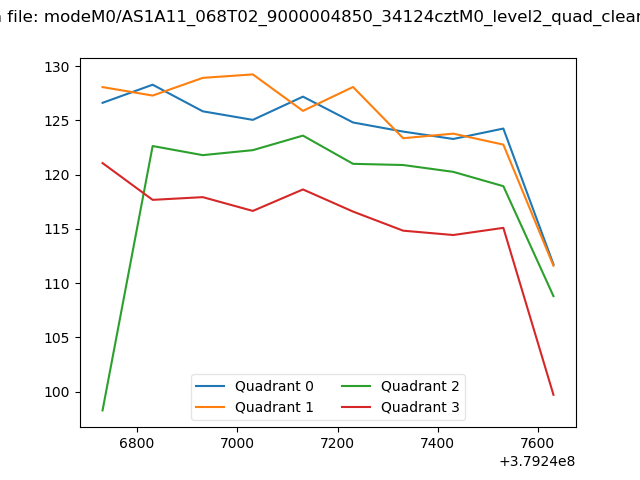 |
|
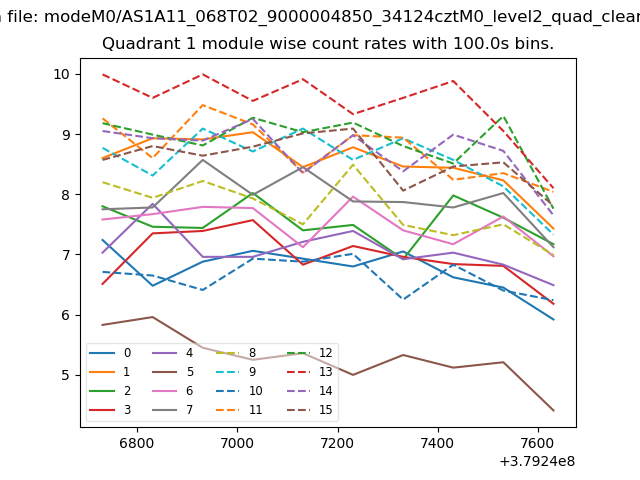
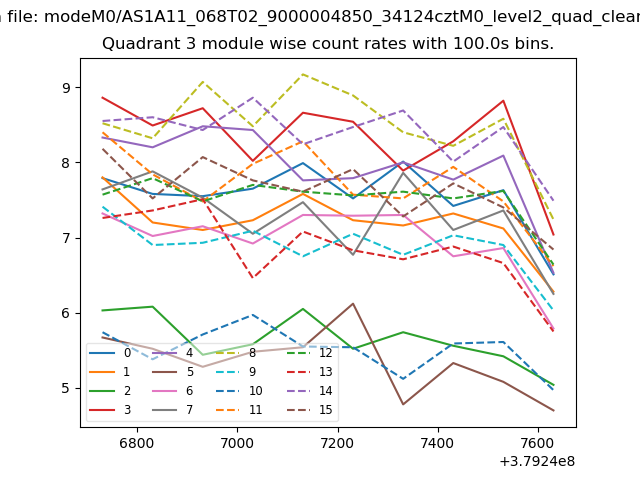
| Module-wise count rates for Quadrant A Data is divided into 100 sec bins |
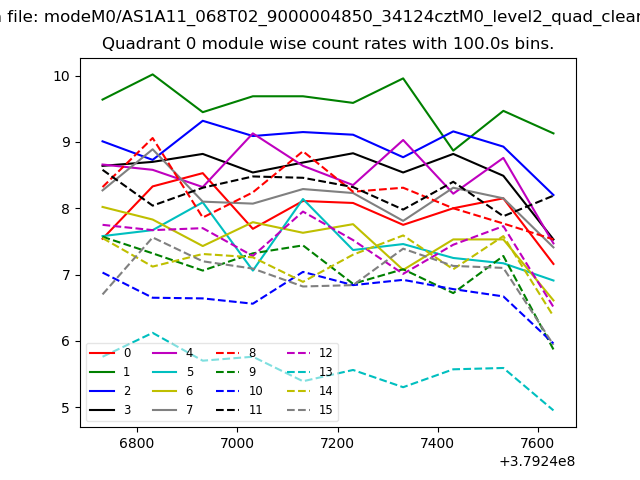 |
 |
| Module-wise count rates for Quadrant B Data is divided into 100 sec bins |
 |
 |
| Module-wise count rates for Quadrant C Data is divided into 100 sec bins |
 |
 |
| Module-wise count rates for Quadrant D Data is divided into 100 sec bins |
 |
 |
| Parameter | Plot |
|---|---|
| CZT HV Monitor | 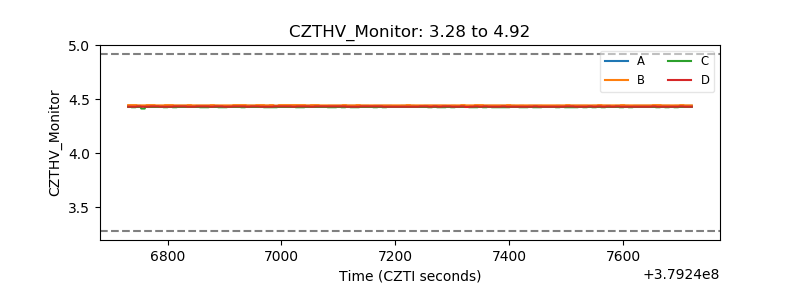 |
| D_VDD | 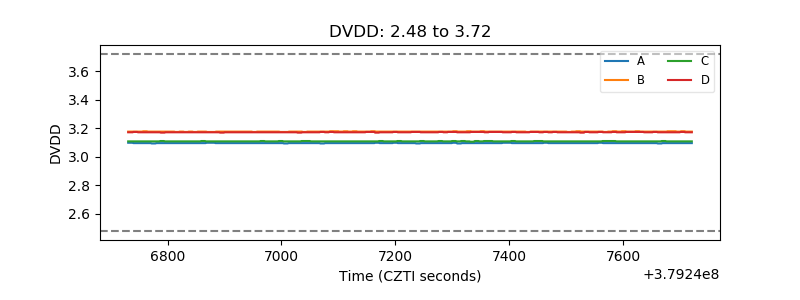 |
| Temperature 1 | 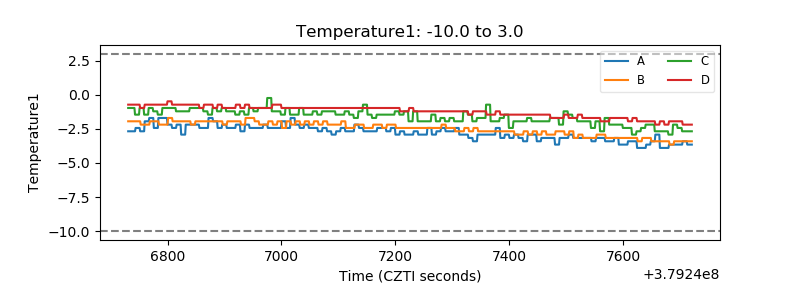 |
| Veto HV Monitor | 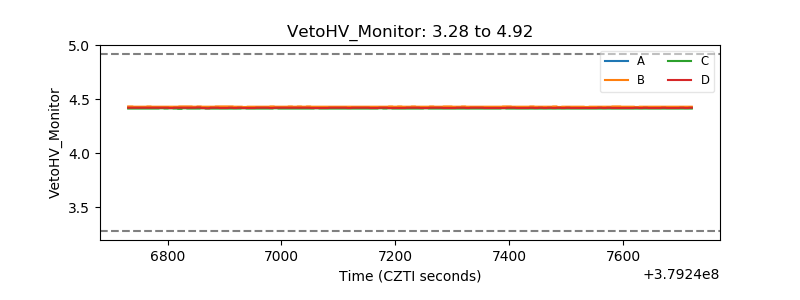 |
| Veto LLD | 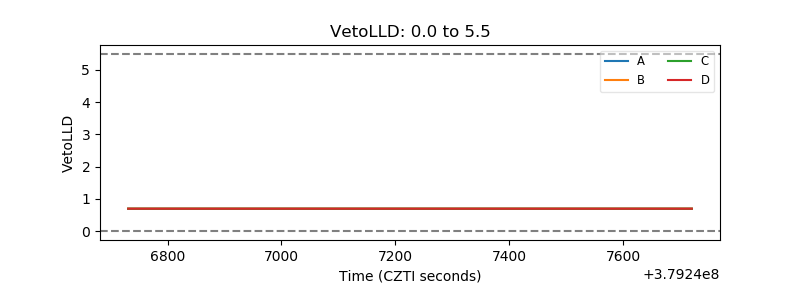 |
| Alpha Counter | 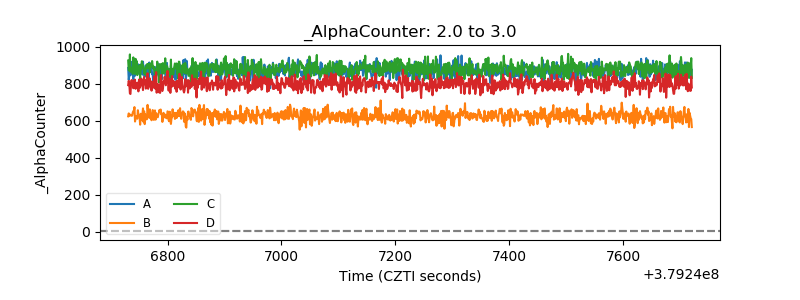 |
| _CPM_Rate | 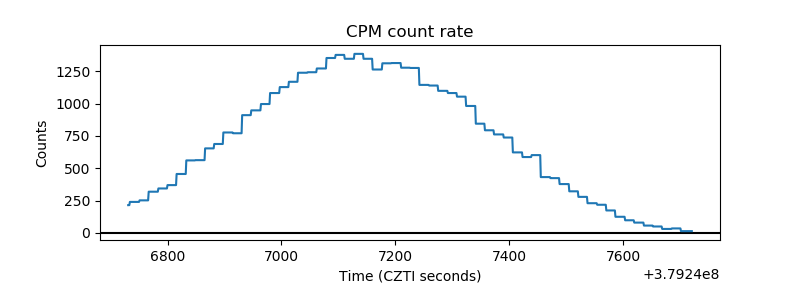 |
| CZT Counter | 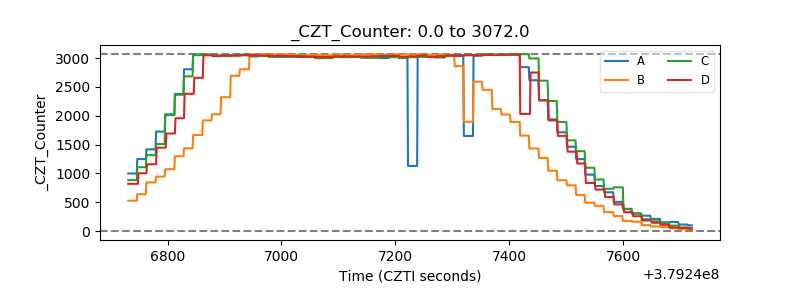 |
| +2.5 Volts monitor |  |
| +5 Volts monitor |  |
| _ROLL_ROT | 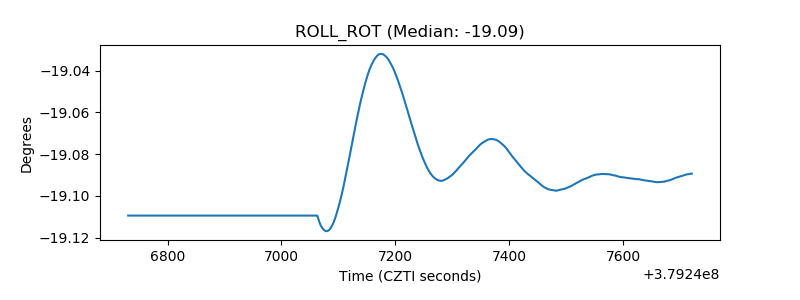 |
| _Roll_DEC | 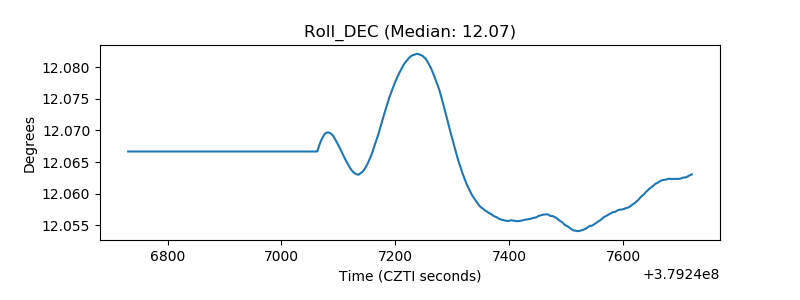 |
| _Roll_RA | 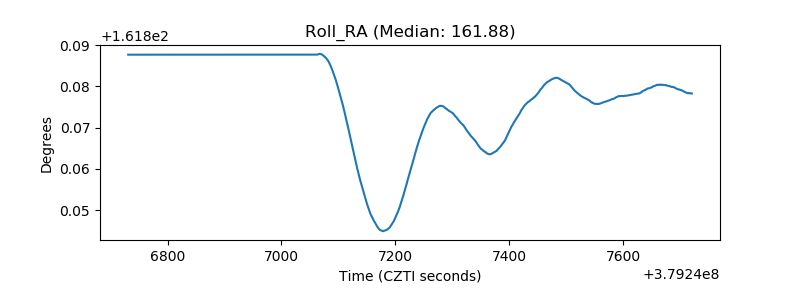 |
| Veto Counter | 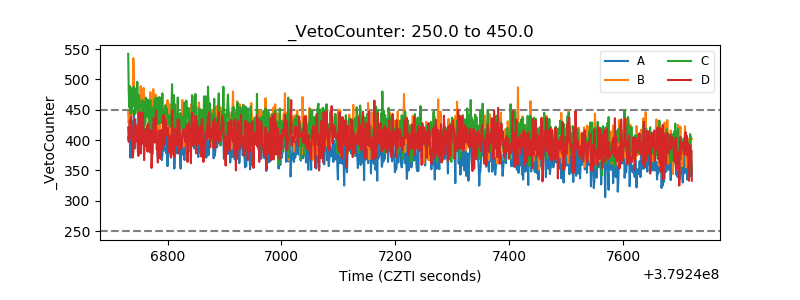 |