| Param | Original file | Final file |
|---|---|---|
| Filename | modeM0/AS1T04_074T01_9000004852cztM0_level2.fits | modeM0/AS1T04_074T01_9000004852cztM0_level2_quad_clean.evt |
| Size (bytes) | 229,979,520 | 170,484,480 |
| Size | 219.3 MB | 162.6 MB |
| Events in quadrant A | 1,422,466 | 947,067 |
| Events in quadrant B | 1,347,876 | 909,230 |
| Events in quadrant C | 1,383,428 | 900,399 |
| Events in quadrant D | 1,136,482 | 731,133 |
| Mode SS | |||
|---|---|---|---|
| Quadrant | BADHDUFLAG | Total packets | Discarded packets |
| A | 0 | 496 | 0 |
| B | 0 | 496 | 0 |
| C | 0 | 496 | 0 |
| D | 0 | 496 | 0 |
| Mode M9 | |||
|---|---|---|---|
| Quadrant | BADHDUFLAG | Total packets | Discarded packets |
| A | 0 | 78 | 0 |
| B | 0 | 78 | 0 |
| C | 0 | 78 | 0 |
| D | 0 | 78 | 0 |
| Mode M0 | |||
|---|---|---|---|
| Quadrant | BADHDUFLAG | Total packets | Discarded packets |
| A | 0 | 53748 | 0 |
| B | 0 | 59863 | 0 |
| C | 0 | 54290 | 0 |
| D | 0 | 88521 | 0 |
| Quadrant | Total seconds | Saturated seconds | Saturation percentage |
|---|---|---|---|
| A | 24325 | 467 | 1.919836% |
| B | 24325 | 795 | 3.268243% |
| C | 24325 | 196 | 0.805755% |
| D | 24325 | 2557 | 10.511819% |
Noise dominated data is calculated using 1-second bins in cleaned event files. If a bin has >2000 counts, and if more than 50% of those come from <1% of pixels, then it is considered to be noise-dominated and hence unusable.
| Quadrant | # 1 sec bins | Bins with >0 counts | Bins with >2000 counts | High rate bins dominated by noise | Noise dominated (total time) | Noise dominated (detector-on time) | Marked lightcurve |
|---|---|---|---|---|---|---|---|
| A | 32059 | 24323 | 0 | 0 | 0.00% | 0.00% |  |
| B | 32059 | 24315 | 0 | 0 | 0.00% | 0.00% |  |
| C | 32059 | 24324 | 0 | 0 | 0.00% | 0.00% | 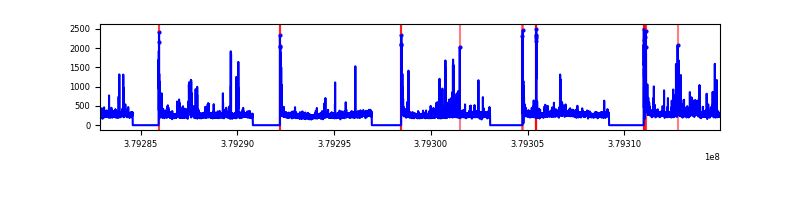 |
| D | 32059 | 24292 | 0 | 0 | 0.00% | 0.00% |  |
Top three noisy pixels from each quadrant. If the there are fewer than three noisy pixels in the level2.evt file, extra rows are filled as -1
| Pixel properties | Quadrant properties | ||||||
|---|---|---|---|---|---|---|---|
| Quadrant | DetID | PixID | Counts | Sigma | Mean | Median | Sigma |
| A | 9 | 19 | 1149 | 8.55 | 371 | 348 | 93.7 |
| A | 7 | 110 | 1148 | 8.54 | 371 | 348 | 93.7 |
| A | 0 | 29 | 1101 | 8.04 | 371 | 348 | 93.7 |
| B | 2 | 9 | 1202 | 11.96 | 357 | 340 | 72.1 |
| B | 3 | 80 | 1046 | 9.8 | 357 | 340 | 72.1 |
| B | 2 | 8 | 1002 | 9.19 | 357 | 340 | 72.1 |
| C | 1 | 81 | 1149 | 8.48 | 366 | 344 | 94.9 |
| C | 1 | 80 | 1129 | 8.27 | 366 | 344 | 94.9 |
| C | 3 | 158 | 953 | 6.42 | 366 | 344 | 94.9 |
| D | 6 | 62 | 836 | 6.16 | 325 | 296 | 87.7 |
| D | 10 | 113 | 825 | 6.03 | 325 | 296 | 87.7 |
| D | 7 | 3 | 820 | 5.97 | 325 | 296 | 87.7 |
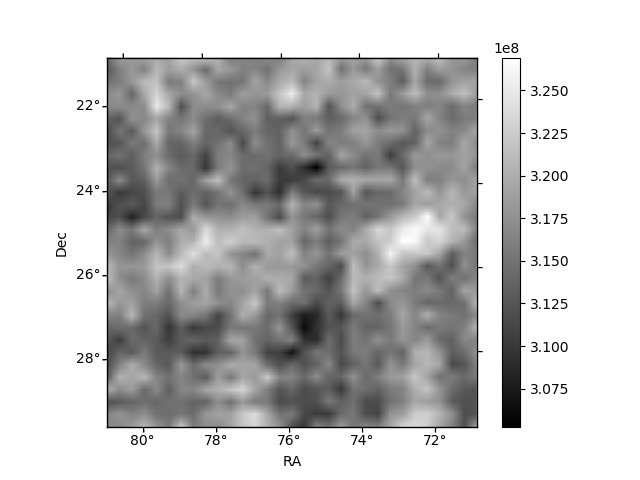
Histogram calculated using DETX and DETY for each event in the final _common_clean file
| Quadrant A | 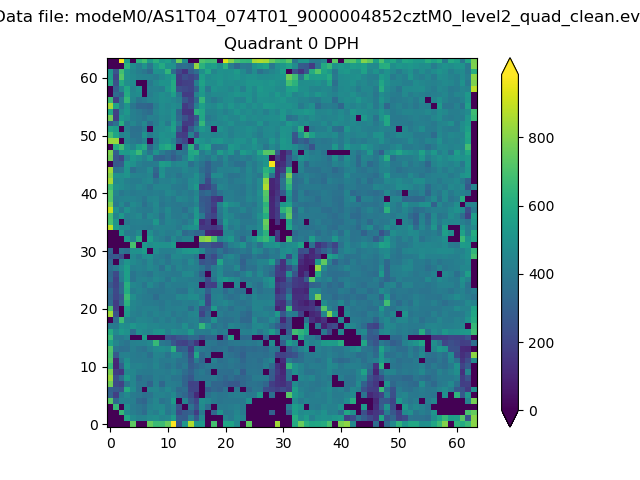 |
 |
Quadrant B |
|---|---|---|---|
| Quadrant D |  |
 |
Quadrant C |
| Plot type | Count rate plots | Images |
|---|---|---|
| Comparison with Poisson distribution Blue bars denote a histogram of data divided into 1 sec bins. Red curve is a Poisson curve with rate = median count rate of data. |
 |
 |
| Quadrant-wise count rates Data is divided into 100 sec bins |
 |
|
| Module-wise count rates for Quadrant A Data is divided into 100 sec bins |
 |
 |
| Module-wise count rates for Quadrant B Data is divided into 100 sec bins |
 |
 |
| Module-wise count rates for Quadrant C Data is divided into 100 sec bins |
 |
 |
| Module-wise count rates for Quadrant D Data is divided into 100 sec bins |
 |
 |
| Parameter | Plot |
|---|---|
| CZT HV Monitor | 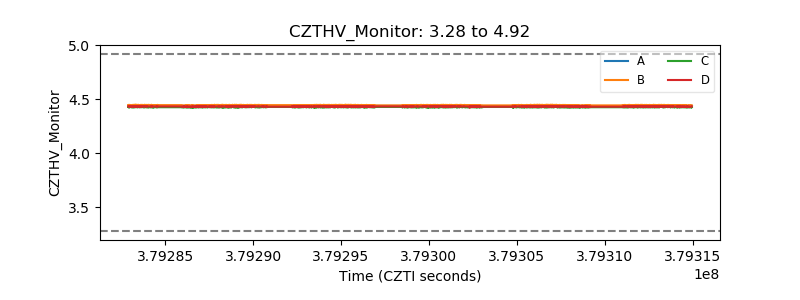 |
| D_VDD |  |
| Temperature 1 |  |
| Veto HV Monitor | 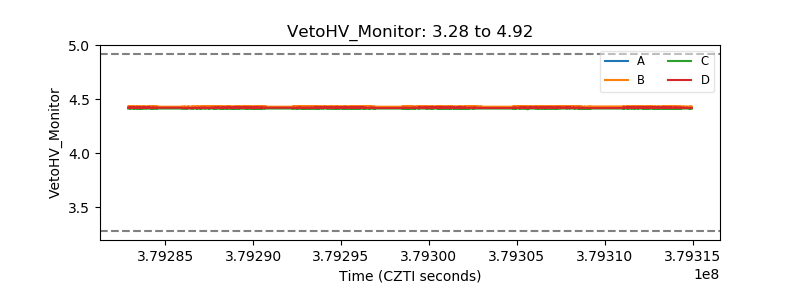 |
| Veto LLD |  |
| Alpha Counter |  |
| _CPM_Rate |  |
| CZT Counter | 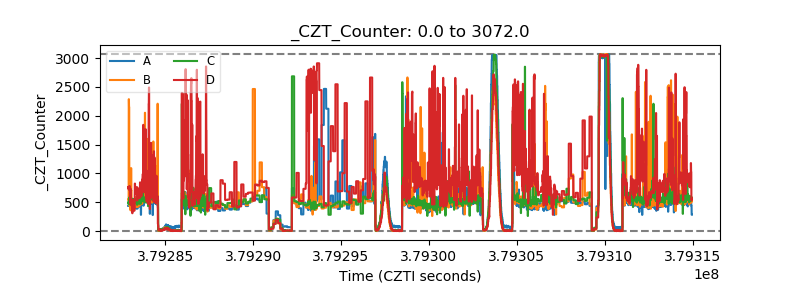 |
| +2.5 Volts monitor |  |
| +5 Volts monitor | 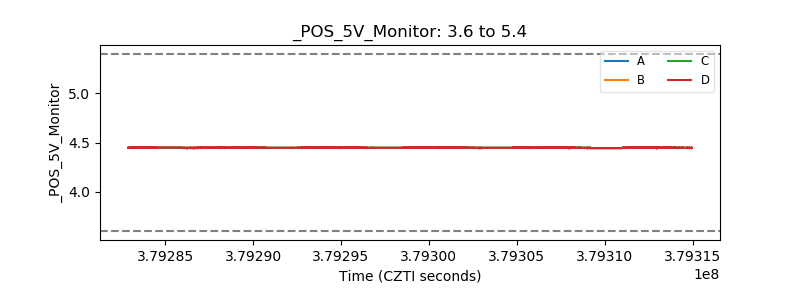 |
| _ROLL_ROT |  |
| _Roll_DEC |  |
| _Roll_RA | 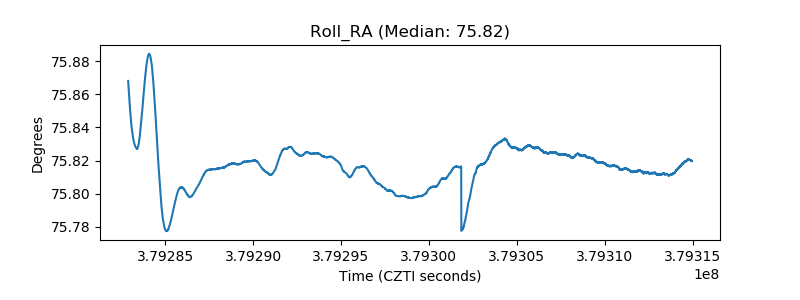 |
| Veto Counter |  |