| Param | Original file | Final file |
|---|---|---|
| Filename | modeM0/AS1T04_074T01_9000004852_33952cztM0_level2.evt | modeM0/AS1T04_074T01_9000004852_33952cztM0_level2_quad_clean.evt |
| Size (bytes) | 272,983,680 | 40,913,280 |
| Size | 260.3 MB | 39.0 MB |
| Events in quadrant A | 1,497,187 | 260,790 |
| Events in quadrant B | 1,901,626 | 259,613 |
| Events in quadrant C | 1,774,187 | 257,384 |
| Events in quadrant D | 2,875,899 | 233,525 |
| Mode SS | |||
|---|---|---|---|
| Quadrant | BADHDUFLAG | Total packets | Discarded packets |
| A | 0 | 66 | 0 |
| B | 0 | 66 | 0 |
| C | 0 | 66 | 0 |
| D | 0 | 66 | 0 |
| Mode M9 | |||
|---|---|---|---|
| Quadrant | BADHDUFLAG | Total packets | Discarded packets |
| A | 0 | 14 | 0 |
| B | 0 | 14 | 0 |
| C | 0 | 14 | 0 |
| D | 0 | 14 | 0 |
| Mode M0 | |||
|---|---|---|---|
| Quadrant | BADHDUFLAG | Total packets | Discarded packets |
| A | 0 | 6483 | 1 |
| B | 0 | 7676 | 0 |
| C | 0 | 7174 | 0 |
| D | 0 | 10829 | 0 |
| Quadrant | Total seconds | Saturated seconds | Saturation percentage |
|---|---|---|---|
| A | 3194 | 9 | 0.281778% |
| B | 3194 | 85 | 2.661240% |
| C | 3194 | 26 | 0.814026% |
| D | 3194 | 267 | 8.359424% |
Noise dominated data is calculated using 1-second bins in cleaned event files. If a bin has >2000 counts, and if more than 50% of those come from <1% of pixels, then it is considered to be noise-dominated and hence unusable.
| Quadrant | # 1 sec bins | Bins with >0 counts | Bins with >2000 counts | High rate bins dominated by noise | Noise dominated (total time) | Noise dominated (detector-on time) | Marked lightcurve |
|---|---|---|---|---|---|---|---|
| A | 4537 | 3195 | 0 | 0 | 0.00% | 0.00% | 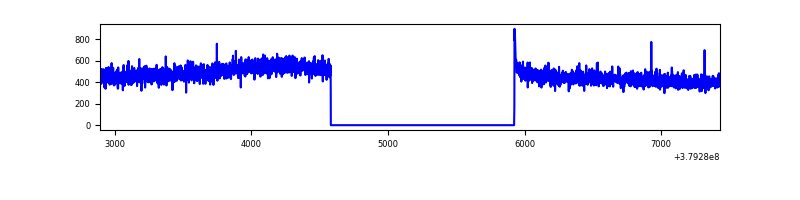 |
| B | 4537 | 3195 | 41 | 41 | 0.90% | 1.28% | 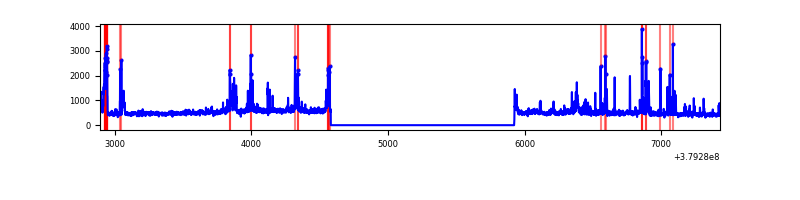 |
| C | 4537 | 3195 | 15 | 15 | 0.33% | 0.47% | 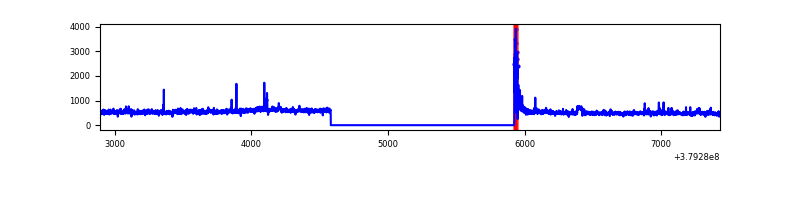 |
| D | 4537 | 3195 | 226 | 226 | 4.98% | 7.07% | 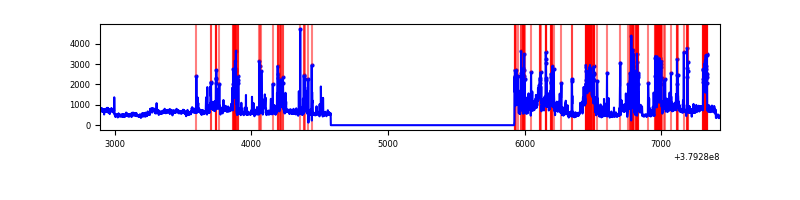 |
Top three noisy pixels from each quadrant. If the there are fewer than three noisy pixels in the level2.evt file, extra rows are filled as -1
| Pixel properties | Quadrant properties | ||||||
|---|---|---|---|---|---|---|---|
| Quadrant | DetID | PixID | Counts | Sigma | Mean | Median | Sigma |
| A | 10 | 83 | 8026 | 96.46 | 384 | 376 | 79.3 |
| A | 13 | 254 | 5409 | 63.46 | 384 | 376 | 79.3 |
| A | 3 | 137 | 3896 | 44.38 | 384 | 376 | 79.3 |
| B | 5 | 172 | 311822 | 4174.39 | 379 | 368 | 74.6 |
| B | 3 | 112 | 20989 | 276.38 | 379 | 368 | 74.6 |
| B | 0 | 197 | 20363 | 267.99 | 379 | 368 | 74.6 |
| C | 15 | 214 | 137326 | 1554.18 | 374 | 377 | 88.1 |
| C | 0 | 10 | 74113 | 836.8 | 374 | 377 | 88.1 |
| C | 3 | 233 | 62999 | 710.67 | 374 | 377 | 88.1 |
| D | 8 | 195 | 468521 | 5164.63 | 365 | 353 | 90.6 |
| D | 2 | 250 | 292430 | 3222.07 | 365 | 353 | 90.6 |
| D | 13 | 249 | 240828 | 2652.82 | 365 | 353 | 90.6 |
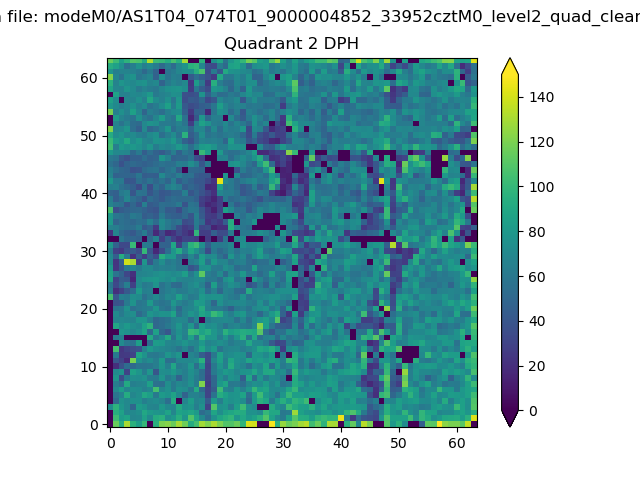
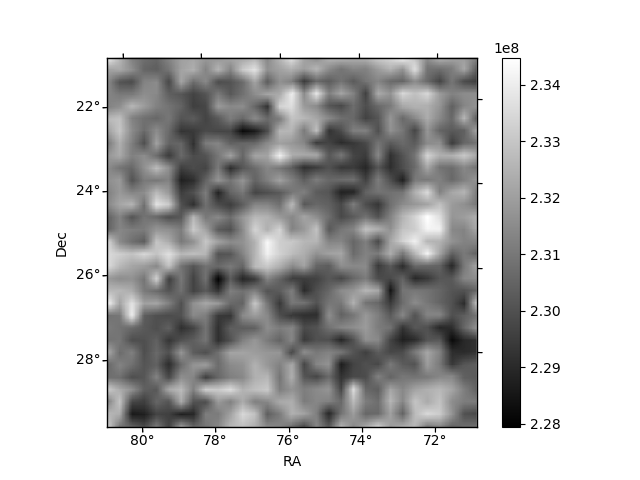
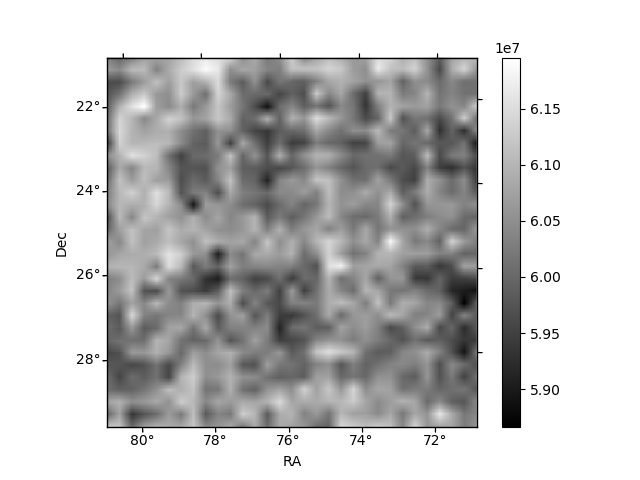
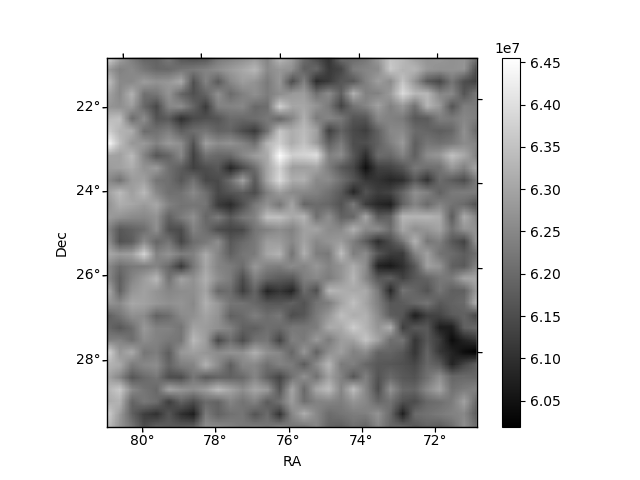
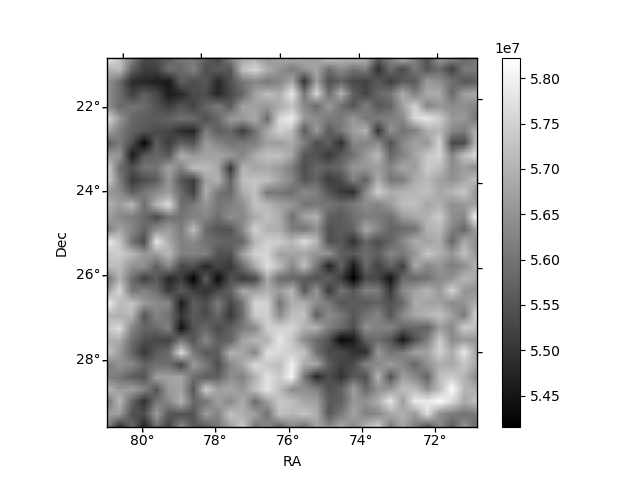
Histogram calculated using DETX and DETY for each event in the final _common_clean file
| Quadrant A | 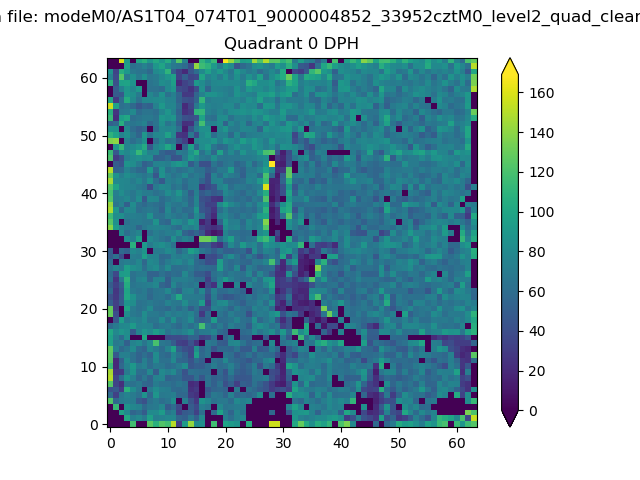 |
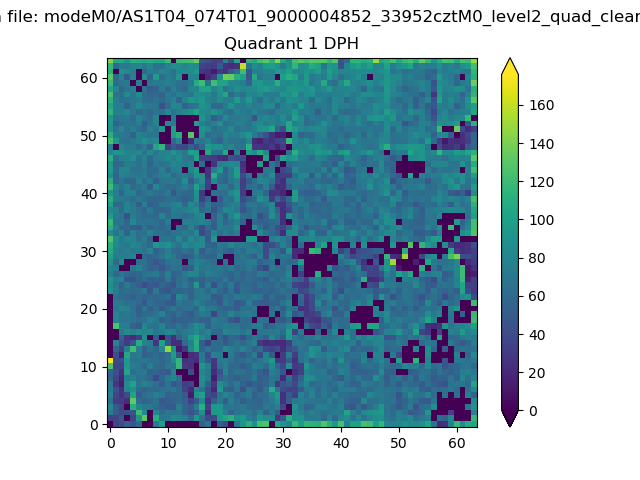 |
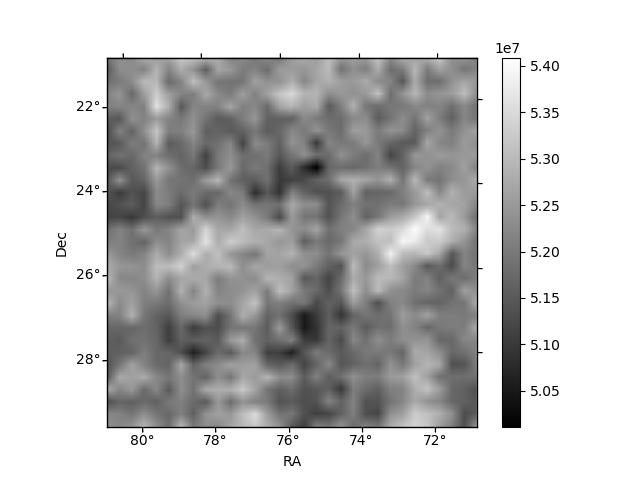
Quadrant B |
|---|---|---|---|
| Quadrant D | 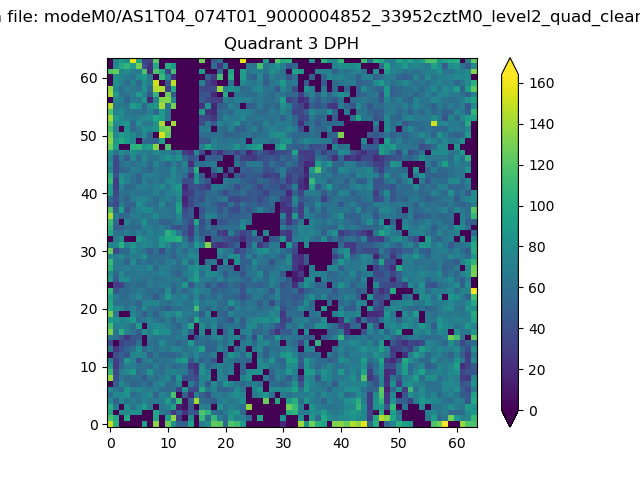 |
 |
Quadrant C |
| Plot type | Count rate plots | Images |
|---|---|---|
| Comparison with Poisson distribution Blue bars denote a histogram of data divided into 1 sec bins. Red curve is a Poisson curve with rate = median count rate of data. |
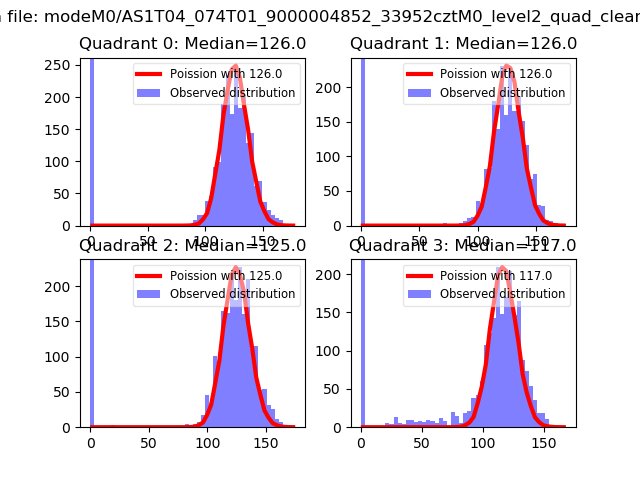 |
 |
| Quadrant-wise count rates Data is divided into 100 sec bins |
 |
|
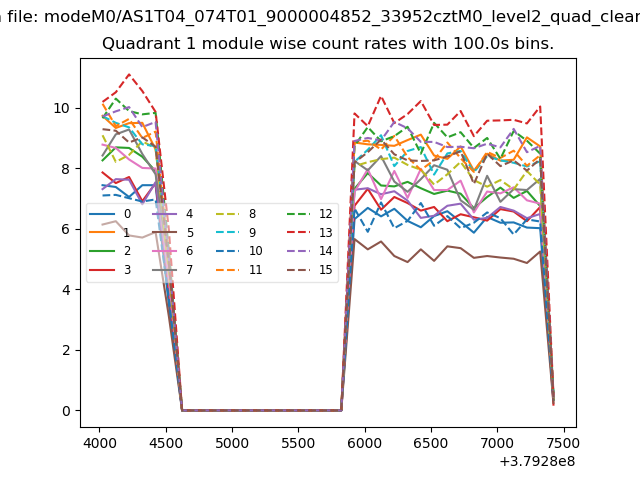
| Module-wise count rates for Quadrant A Data is divided into 100 sec bins |
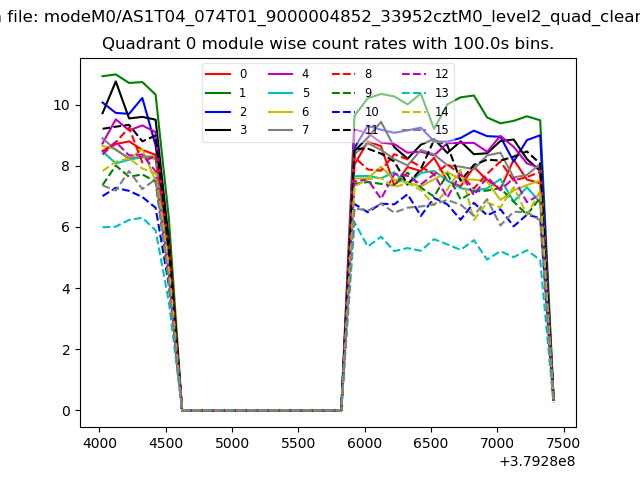 |
 |
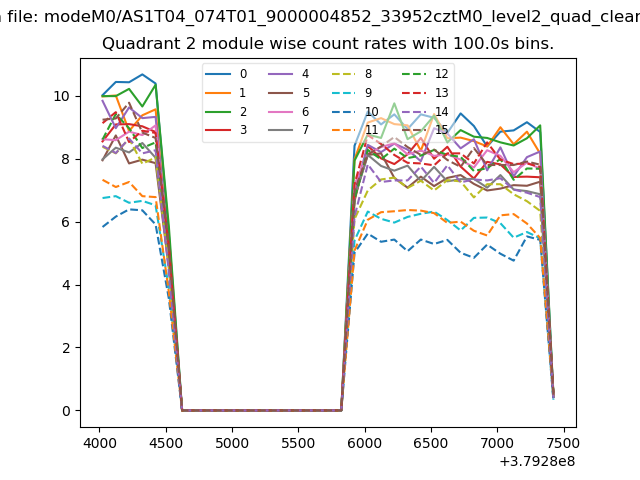
| Module-wise count rates for Quadrant B Data is divided into 100 sec bins |
 |
 |
| Module-wise count rates for Quadrant C Data is divided into 100 sec bins |
 |
 |
| Module-wise count rates for Quadrant D Data is divided into 100 sec bins |
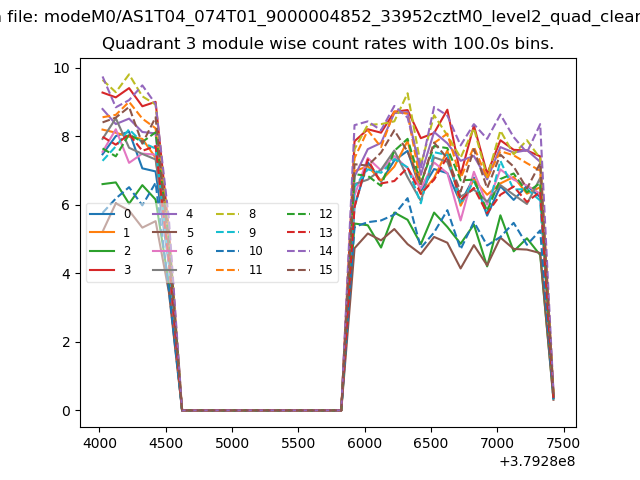 |
 |
| Parameter | Plot |
|---|---|
| CZT HV Monitor | 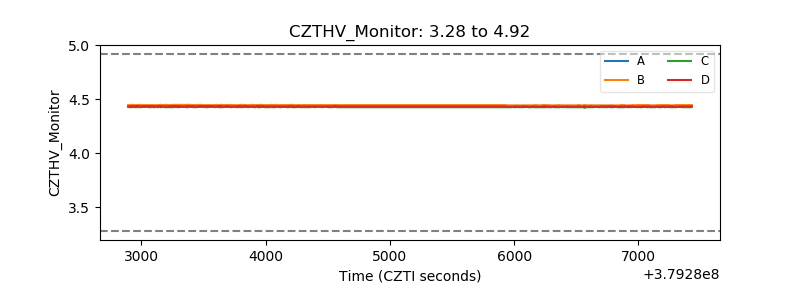 |
| D_VDD | 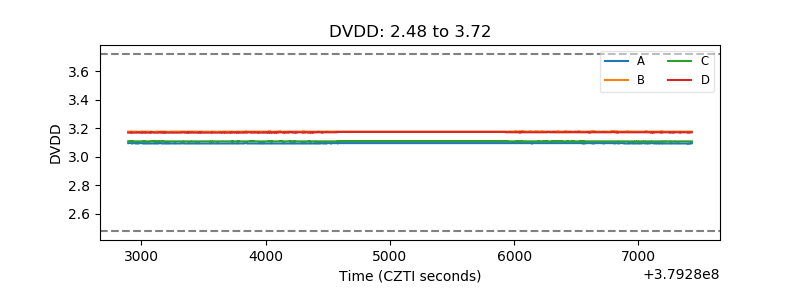 |
| Temperature 1 | 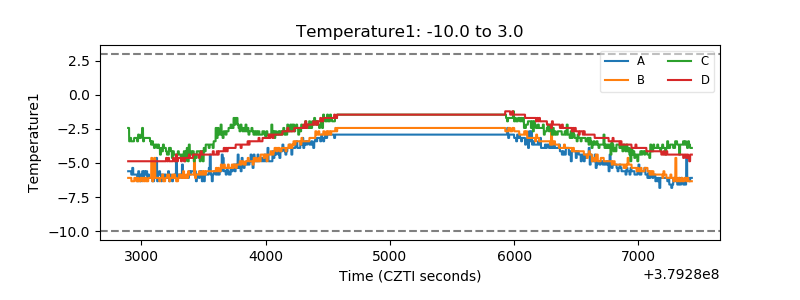 |
| Veto HV Monitor |  |
| Veto LLD | 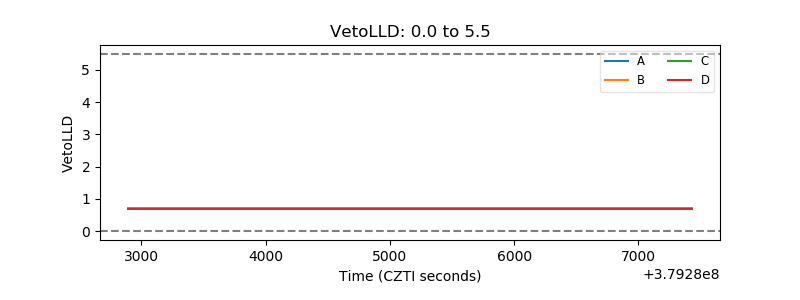 |
| Alpha Counter | 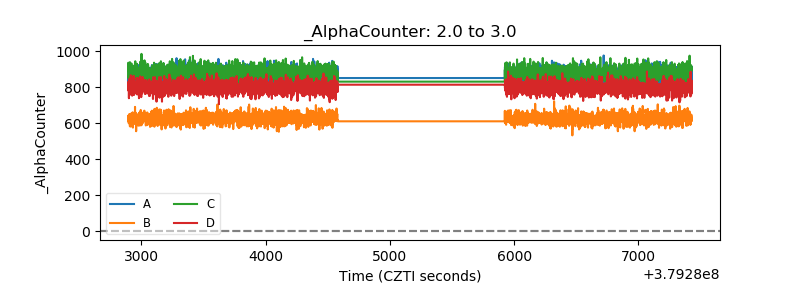 |
| _CPM_Rate |  |
| CZT Counter |  |
| +2.5 Volts monitor | 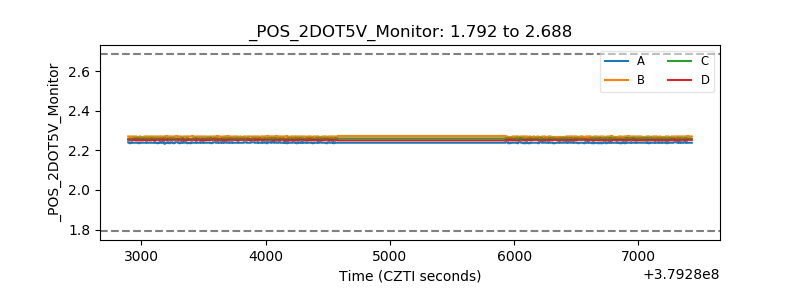 |
| +5 Volts monitor |  |
| _ROLL_ROT | 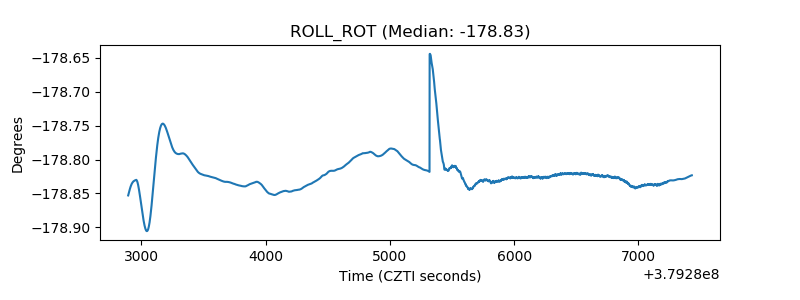 |
| _Roll_DEC | 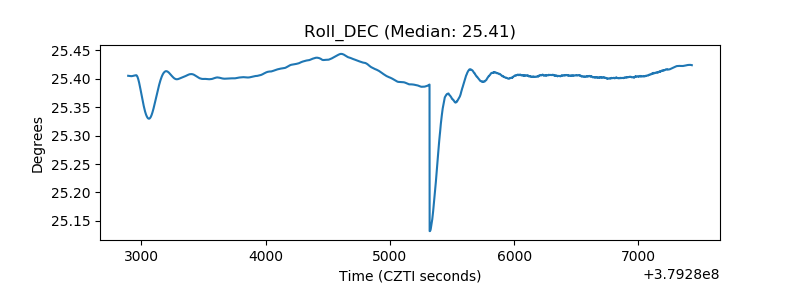 |
| _Roll_RA | 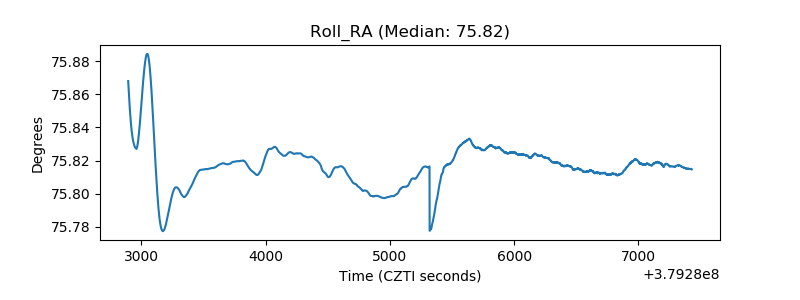 |
| Veto Counter | 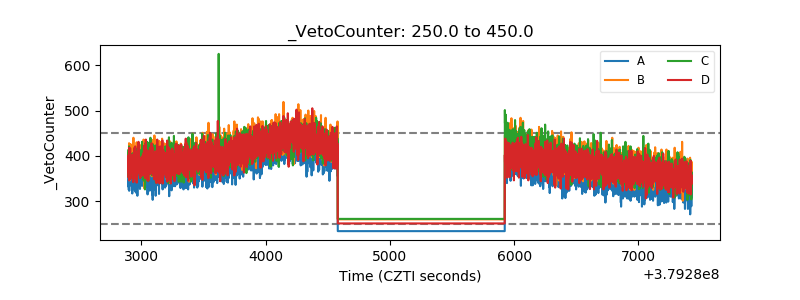 |