| Param | Original file | Final file |
|---|---|---|
| Filename | modeM0/AS1T04_074T01_9000004852_33954cztM0_level2.evt | modeM0/AS1T04_074T01_9000004852_33954cztM0_level2_quad_clean.evt |
| Size (bytes) | 503,818,560 | 61,130,880 |
| Size | 480.5 MB | 58.3 MB |
| Events in quadrant A | 2,910,604 | 377,429 |
| Events in quadrant B | 3,115,096 | 383,966 |
| Events in quadrant C | 3,046,186 | 372,925 |
| Events in quadrant D | 5,818,151 | 335,968 |
| Mode SS | |||
|---|---|---|---|
| Quadrant | BADHDUFLAG | Total packets | Discarded packets |
| A | 0 | 110 | 0 |
| B | 0 | 110 | 0 |
| C | 0 | 110 | 0 |
| D | 0 | 110 | 0 |
| Mode M9 | |||
|---|---|---|---|
| Quadrant | BADHDUFLAG | Total packets | Discarded packets |
| A | 0 | 27 | 0 |
| B | 0 | 27 | 0 |
| C | 0 | 27 | 0 |
| D | 0 | 28 | 0 |
| Mode M0 | |||
|---|---|---|---|
| Quadrant | BADHDUFLAG | Total packets | Discarded packets |
| A | 0 | 12157 | 3 |
| B | 0 | 12736 | 2 |
| C | 0 | 12093 | 2 |
| D | 0 | 21098 | 2 |
| Quadrant | Total seconds | Saturated seconds | Saturation percentage |
|---|---|---|---|
| A | 5436 | 44 | 0.809419% |
| B | 5436 | 84 | 1.545254% |
| C | 5436 | 73 | 1.342899% |
| D | 5436 | 557 | 10.246505% |
Noise dominated data is calculated using 1-second bins in cleaned event files. If a bin has >2000 counts, and if more than 50% of those come from <1% of pixels, then it is considered to be noise-dominated and hence unusable.
| Quadrant | # 1 sec bins | Bins with >0 counts | Bins with >2000 counts | High rate bins dominated by noise | Noise dominated (total time) | Noise dominated (detector-on time) | Marked lightcurve |
|---|---|---|---|---|---|---|---|
| A | 7109 | 5437 | 37 | 37 | 0.52% | 0.68% | 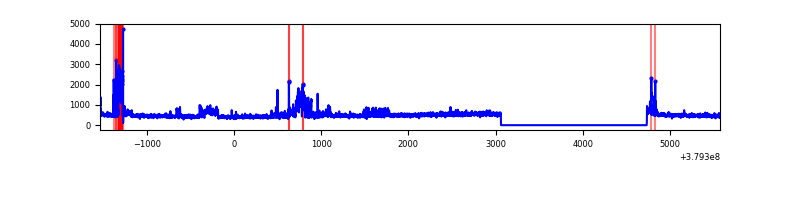 |
| B | 7109 | 5437 | 40 | 40 | 0.56% | 0.74% | 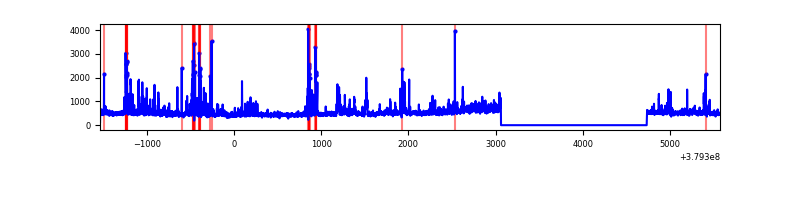 |
| C | 7109 | 5437 | 56 | 56 | 0.79% | 1.03% | 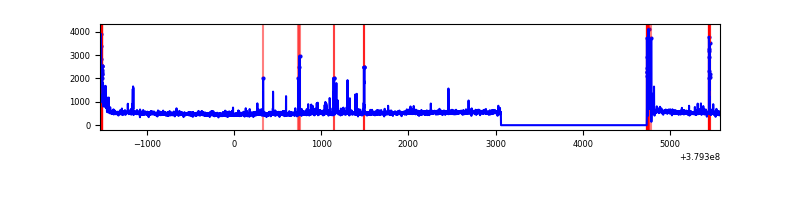 |
| D | 7109 | 5437 | 511 | 511 | 7.19% | 9.40% | 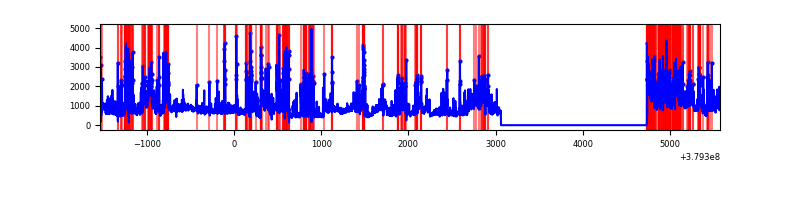 |
Top three noisy pixels from each quadrant. If the there are fewer than three noisy pixels in the level2.evt file, extra rows are filled as -1
| Pixel properties | Quadrant properties | ||||||
|---|---|---|---|---|---|---|---|
| Quadrant | DetID | PixID | Counts | Sigma | Mean | Median | Sigma |
| A | 15 | 169 | 412858 | 3170.79 | 640 | 626 | 130.0 |
| A | 10 | 83 | 14746 | 108.61 | 640 | 626 | 130.0 |
| A | 13 | 254 | 10090 | 72.79 | 640 | 626 | 130.0 |
| B | 5 | 172 | 316213 | 2512.39 | 641 | 623 | 125.6 |
| B | 0 | 219 | 83503 | 659.8 | 641 | 623 | 125.6 |
| B | 4 | 232 | 77366 | 610.95 | 641 | 623 | 125.6 |
| C | 0 | 10 | 269582 | 1845.86 | 623 | 627 | 145.7 |
| C | 15 | 214 | 236839 | 1621.14 | 623 | 627 | 145.7 |
| C | 3 | 233 | 72972 | 496.51 | 623 | 627 | 145.7 |
| D | 8 | 195 | 1294939 | 8739.89 | 599 | 581 | 148.1 |
| D | 7 | 238 | 979693 | 6611.26 | 599 | 581 | 148.1 |
| D | 12 | 6 | 549598 | 3707.13 | 599 | 581 | 148.1 |
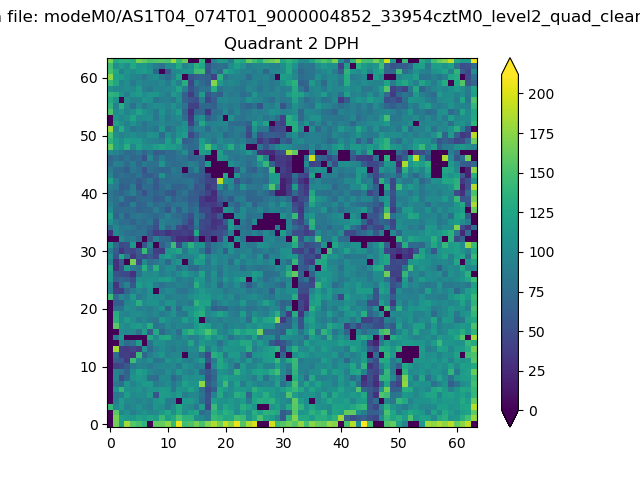
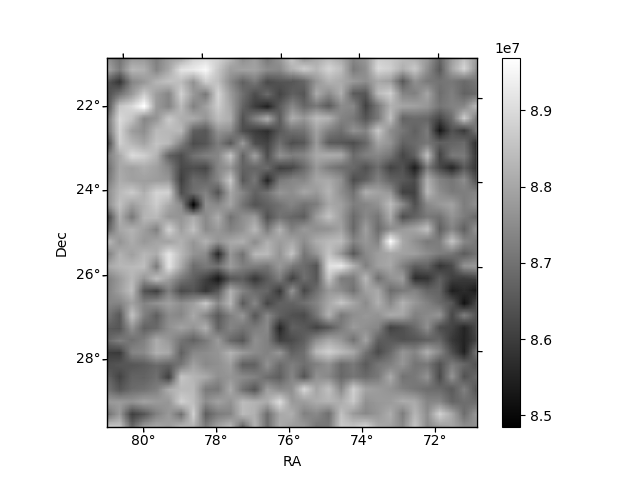
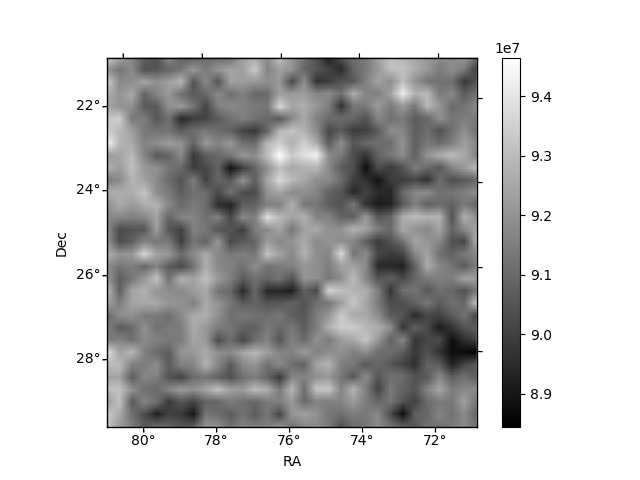
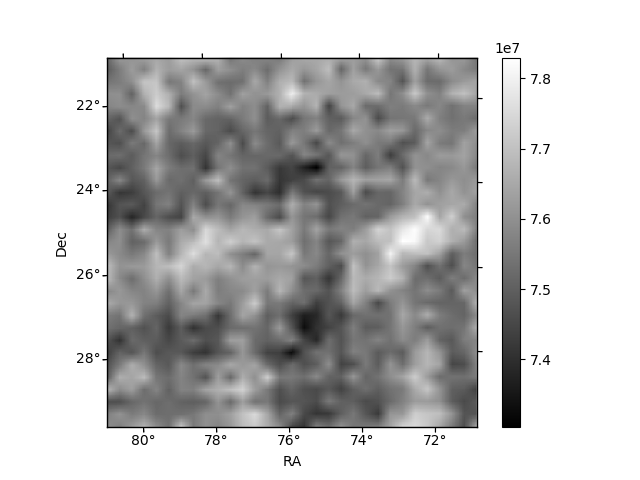
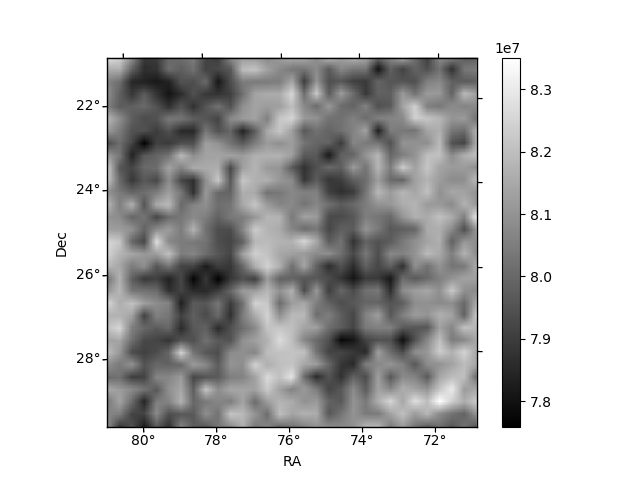
Histogram calculated using DETX and DETY for each event in the final _common_clean file
| Quadrant A | 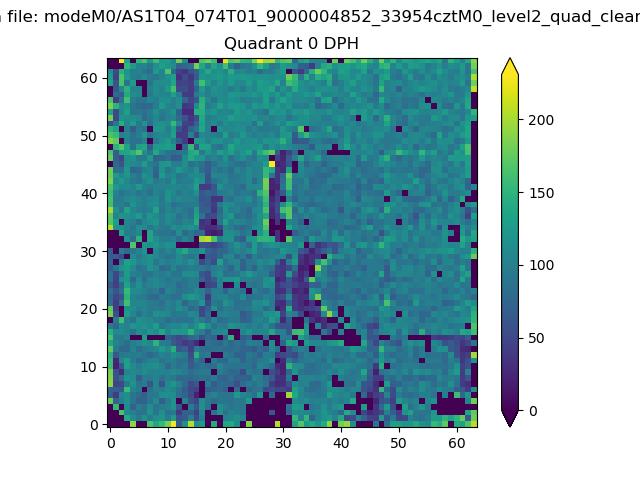 |
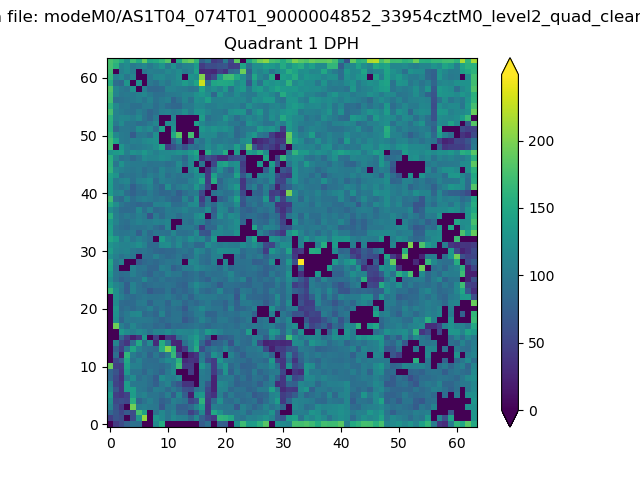 |
Quadrant B |
|---|---|---|---|
| Quadrant D | 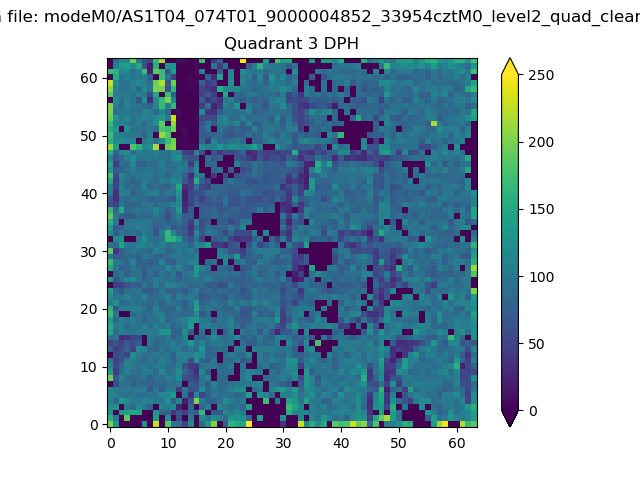 |
 |
Quadrant C |
| Plot type | Count rate plots | Images |
|---|---|---|
| Comparison with Poisson distribution Blue bars denote a histogram of data divided into 1 sec bins. Red curve is a Poisson curve with rate = median count rate of data. |
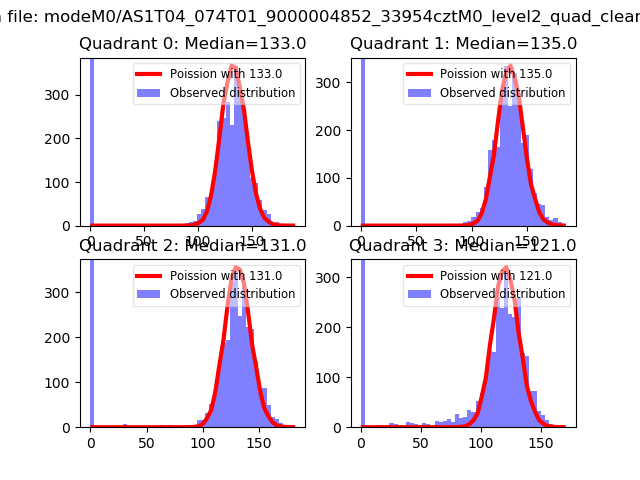 |
 |
| Quadrant-wise count rates Data is divided into 100 sec bins |
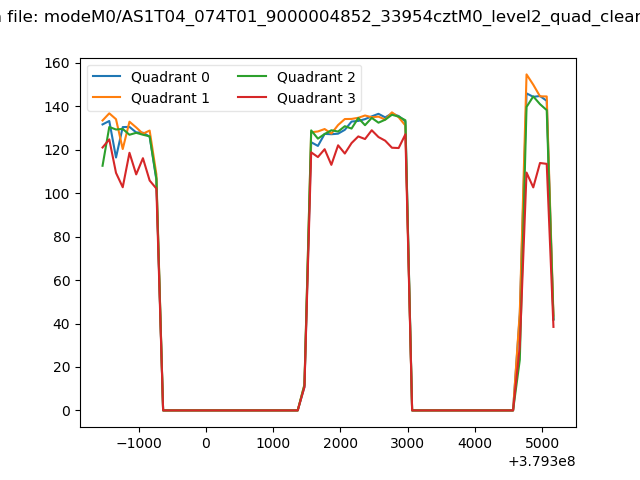 |
|
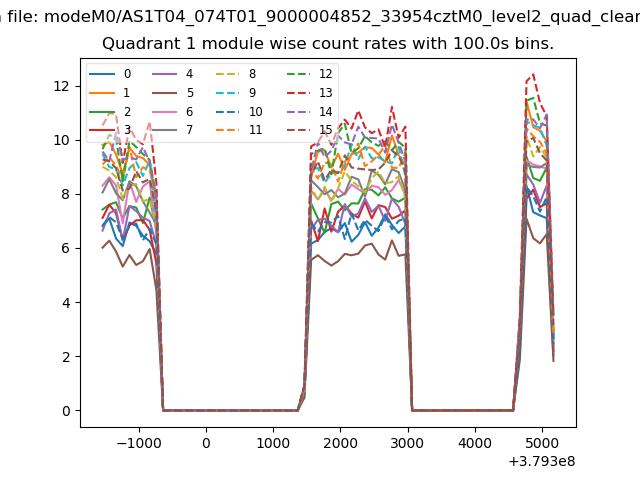
| Module-wise count rates for Quadrant A Data is divided into 100 sec bins |
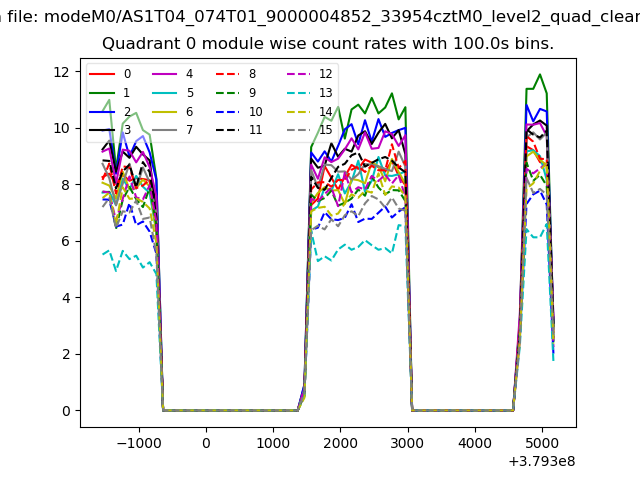 |
 |
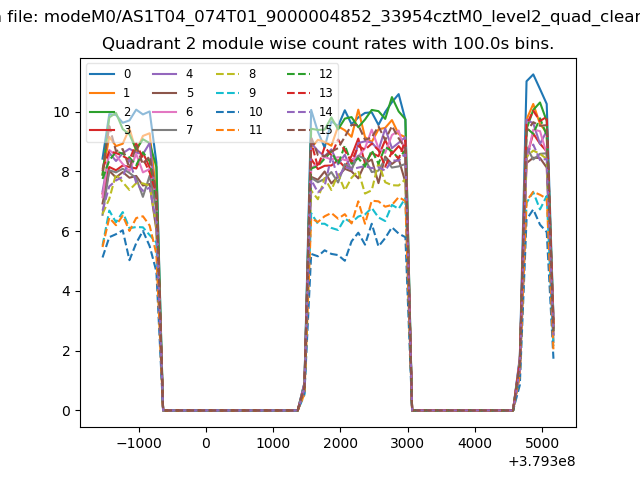
| Module-wise count rates for Quadrant B Data is divided into 100 sec bins |
 |
 |
| Module-wise count rates for Quadrant C Data is divided into 100 sec bins |
 |
 |
| Module-wise count rates for Quadrant D Data is divided into 100 sec bins |
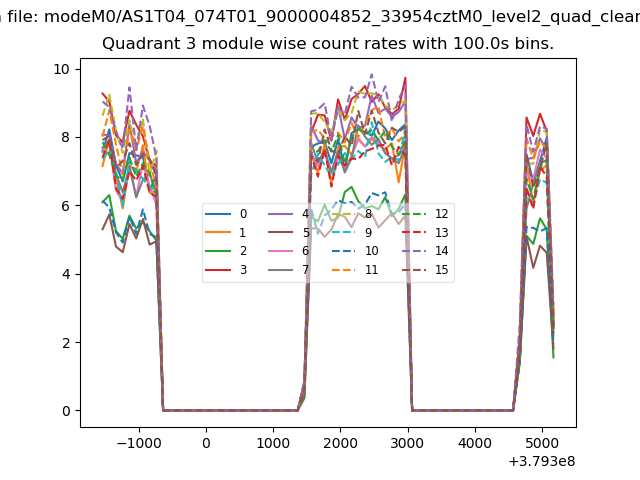 |
 |
| Parameter | Plot |
|---|---|
| CZT HV Monitor | 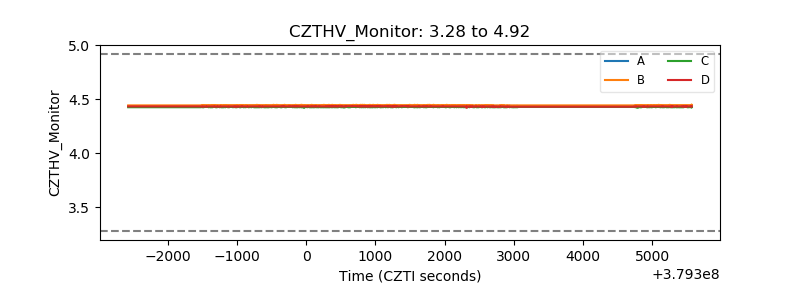 |
| D_VDD | 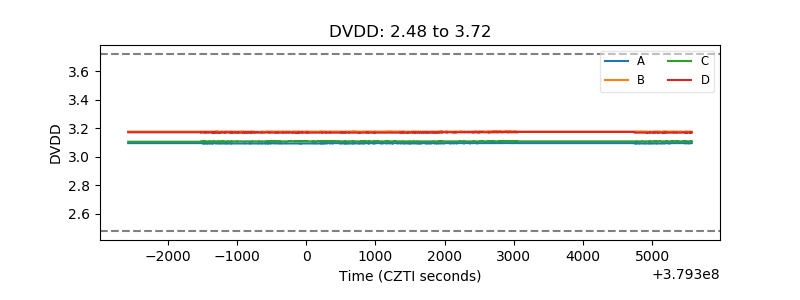 |
| Temperature 1 | 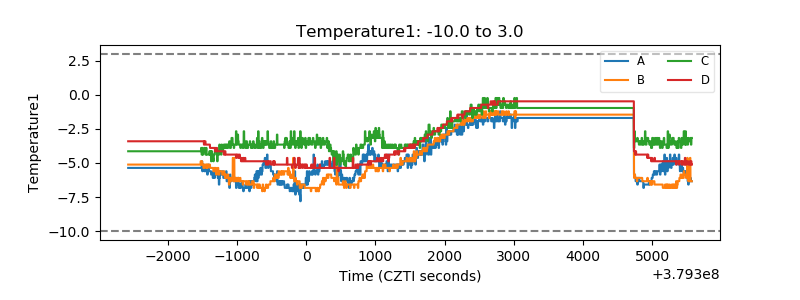 |
| Veto HV Monitor | 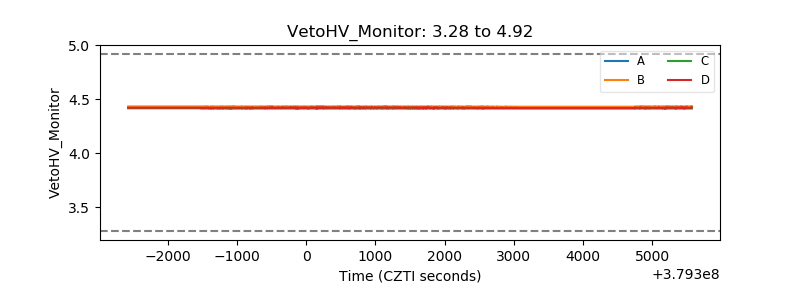 |
| Veto LLD | 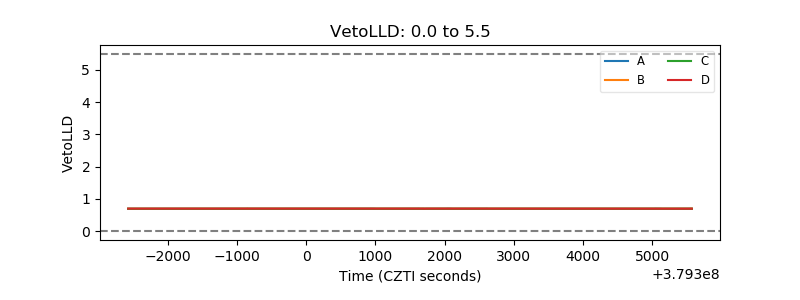 |
| Alpha Counter |  |
| _CPM_Rate |  |
| CZT Counter | 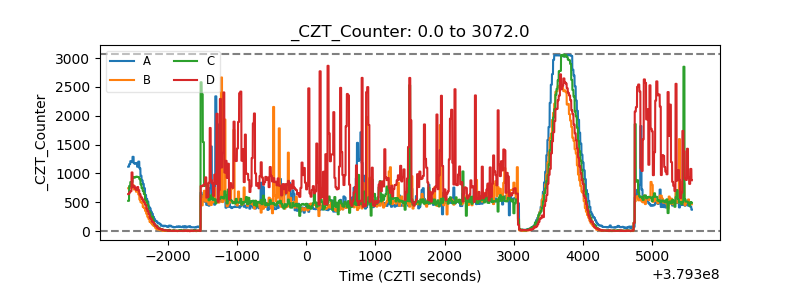 |
| +2.5 Volts monitor |  |
| +5 Volts monitor |  |
| _ROLL_ROT | 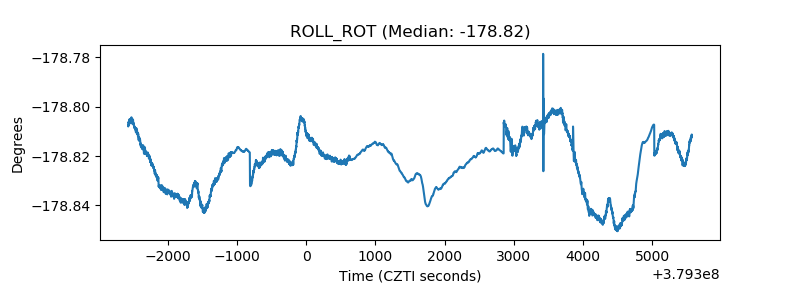 |
| _Roll_DEC | 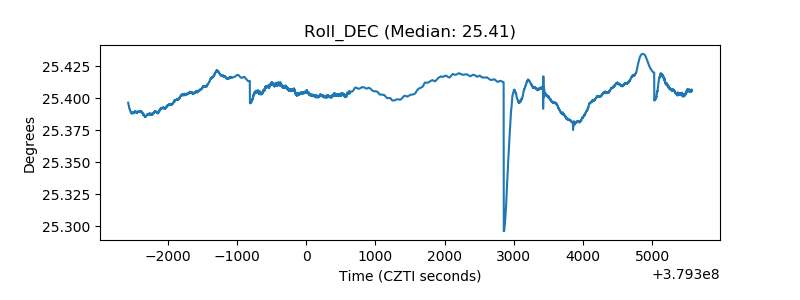 |
| _Roll_RA | 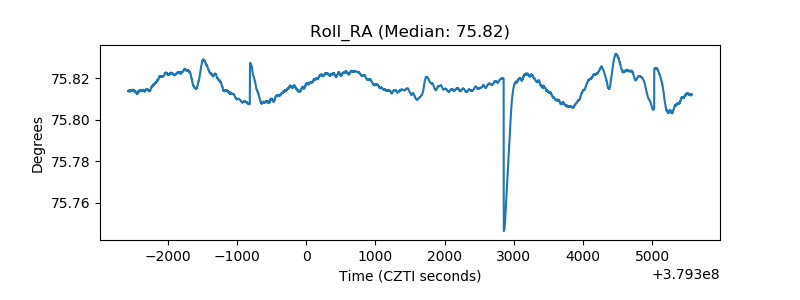 |
| Veto Counter | 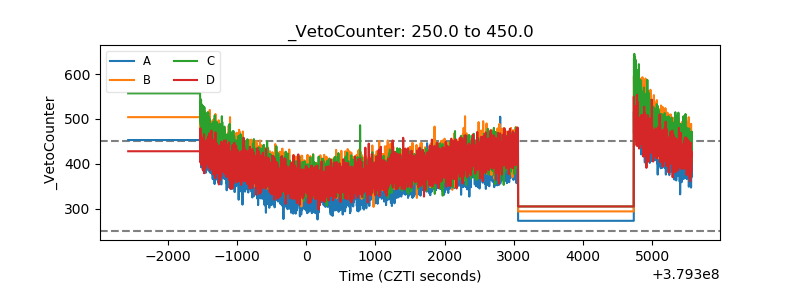 |