| Param | Original file | Final file |
|---|---|---|
| Filename | modeM0/AS1T04_074T01_9000004852_33956cztM0_level2.evt | modeM0/AS1T04_074T01_9000004852_33956cztM0_level2_quad_clean.evt |
| Size (bytes) | 502,427,520 | 52,594,560 |
| Size | 479.2 MB | 50.2 MB |
| Events in quadrant A | 2,639,372 | 314,628 |
| Events in quadrant B | 3,390,038 | 313,283 |
| Events in quadrant C | 3,204,017 | 307,783 |
| Events in quadrant D | 5,612,721 | 274,219 |
| Mode SS | |||
|---|---|---|---|
| Quadrant | BADHDUFLAG | Total packets | Discarded packets |
| A | 0 | 110 | 0 |
| B | 0 | 110 | 0 |
| C | 0 | 110 | 0 |
| D | 0 | 110 | 0 |
| Mode M9 | |||
|---|---|---|---|
| Quadrant | BADHDUFLAG | Total packets | Discarded packets |
| A | 0 | 26 | 0 |
| B | 0 | 26 | 0 |
| C | 0 | 26 | 0 |
| D | 0 | 27 | 0 |
| Mode M0 | |||
|---|---|---|---|
| Quadrant | BADHDUFLAG | Total packets | Discarded packets |
| A | 0 | 11174 | 3 |
| B | 0 | 13510 | 2 |
| C | 0 | 12510 | 2 |
| D | 0 | 20378 | 2 |
| Quadrant | Total seconds | Saturated seconds | Saturation percentage |
|---|---|---|---|
| A | 5461 | 3 | 0.054935% |
| B | 5461 | 157 | 2.874931% |
| C | 5461 | 75 | 1.373375% |
| D | 5461 | 600 | 10.986999% |
Noise dominated data is calculated using 1-second bins in cleaned event files. If a bin has >2000 counts, and if more than 50% of those come from <1% of pixels, then it is considered to be noise-dominated and hence unusable.
| Quadrant | # 1 sec bins | Bins with >0 counts | Bins with >2000 counts | High rate bins dominated by noise | Noise dominated (total time) | Noise dominated (detector-on time) | Marked lightcurve |
|---|---|---|---|---|---|---|---|
| A | 7255 | 5462 | 2 | 2 | 0.03% | 0.04% | 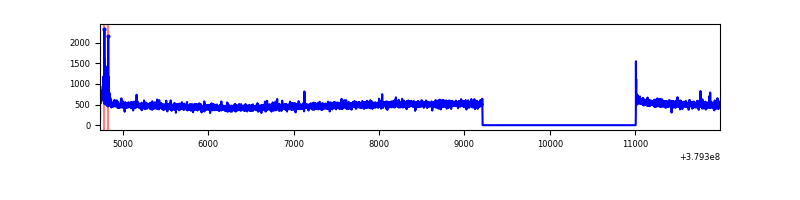 |
| B | 7255 | 5462 | 93 | 93 | 1.28% | 1.70% | 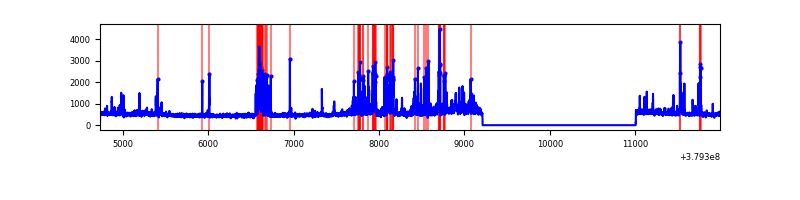 |
| C | 7255 | 5462 | 55 | 55 | 0.76% | 1.01% | 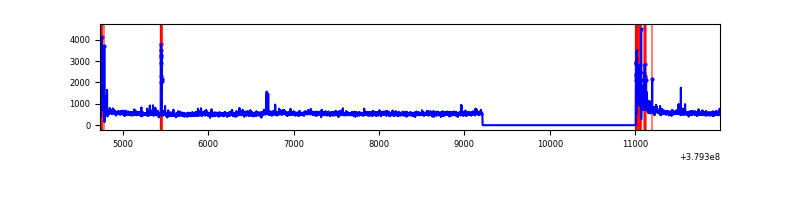 |
| D | 7255 | 5462 | 526 | 526 | 7.25% | 9.63% | 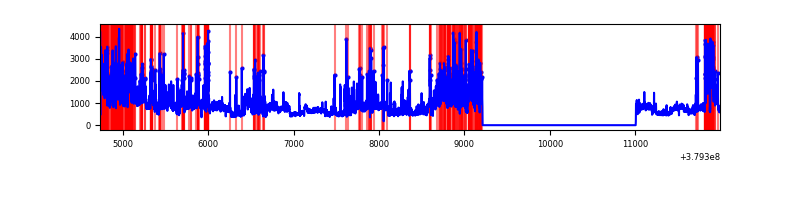 |
Top three noisy pixels from each quadrant. If the there are fewer than three noisy pixels in the level2.evt file, extra rows are filled as -1
| Pixel properties | Quadrant properties | ||||||
|---|---|---|---|---|---|---|---|
| Quadrant | DetID | PixID | Counts | Sigma | Mean | Median | Sigma |
| A | 15 | 169 | 26124 | 189.72 | 670 | 659 | 134.2 |
| A | 10 | 83 | 14550 | 103.49 | 670 | 659 | 134.2 |
| A | 13 | 6 | 12395 | 87.43 | 670 | 659 | 134.2 |
| B | 5 | 172 | 545860 | 4307.11 | 663 | 648 | 126.6 |
| B | 0 | 219 | 86895 | 681.34 | 663 | 648 | 126.6 |
| B | 0 | 229 | 47876 | 373.1 | 663 | 648 | 126.6 |
| C | 15 | 214 | 237220 | 1587.02 | 645 | 650 | 149.1 |
| C | 0 | 10 | 232090 | 1552.6 | 645 | 650 | 149.1 |
| C | 3 | 233 | 196924 | 1316.7 | 645 | 650 | 149.1 |
| D | 8 | 195 | 1203800 | 7865.02 | 618 | 602 | 153.0 |
| D | 12 | 6 | 565799 | 3694.56 | 618 | 602 | 153.0 |
| D | 12 | 233 | 328720 | 2144.83 | 618 | 602 | 153.0 |
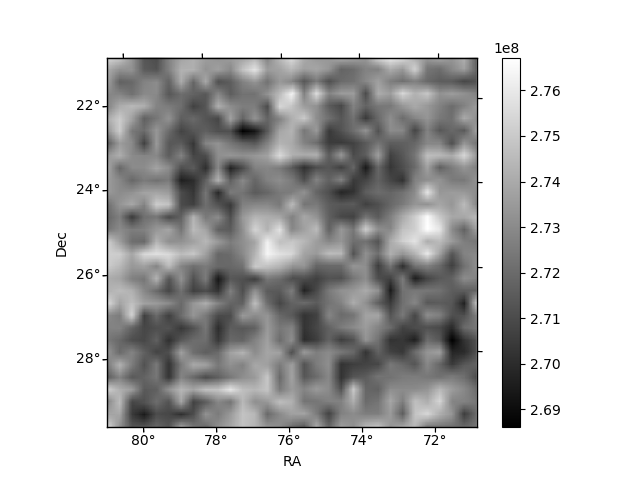
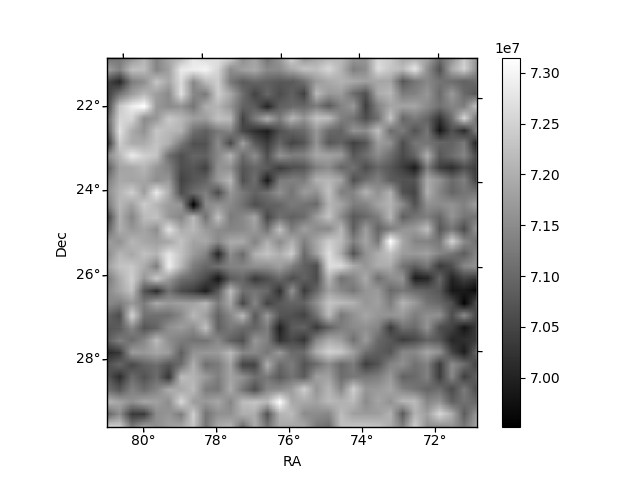
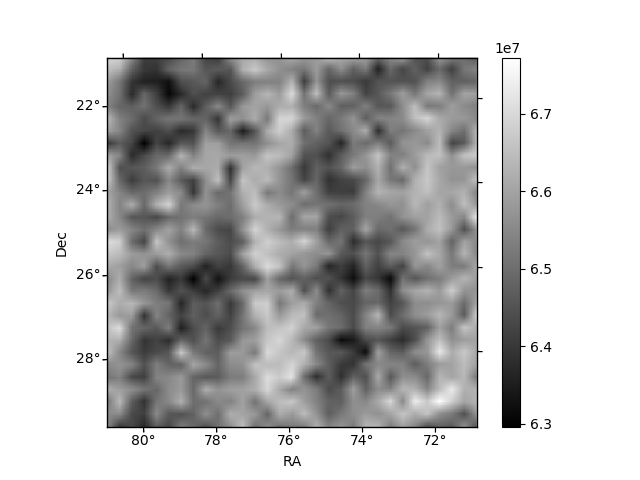
Histogram calculated using DETX and DETY for each event in the final _common_clean file
| Quadrant A | 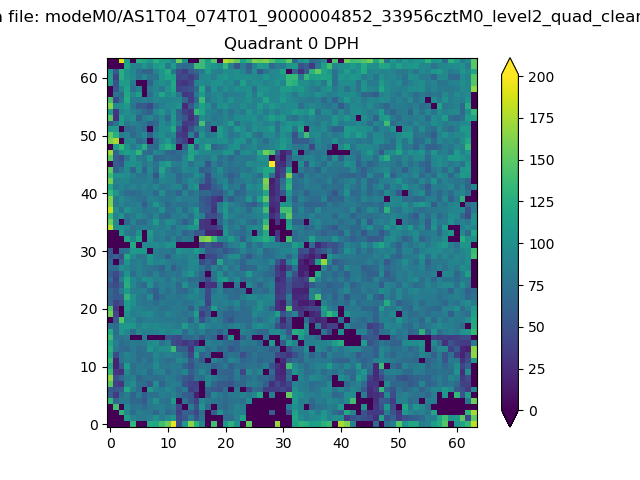 |
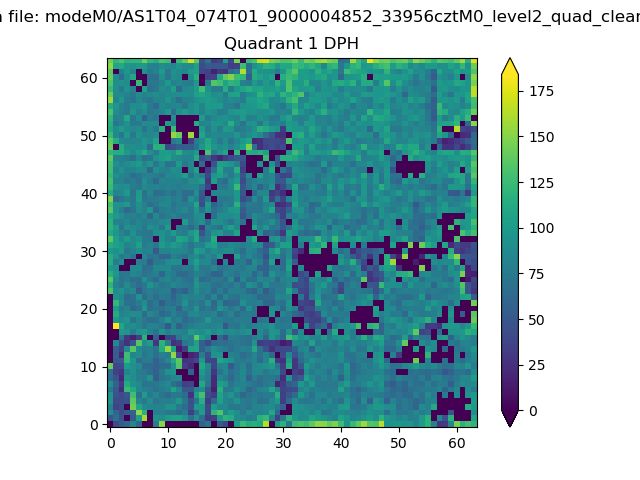 |
Quadrant B |
|---|---|---|---|
| Quadrant D | 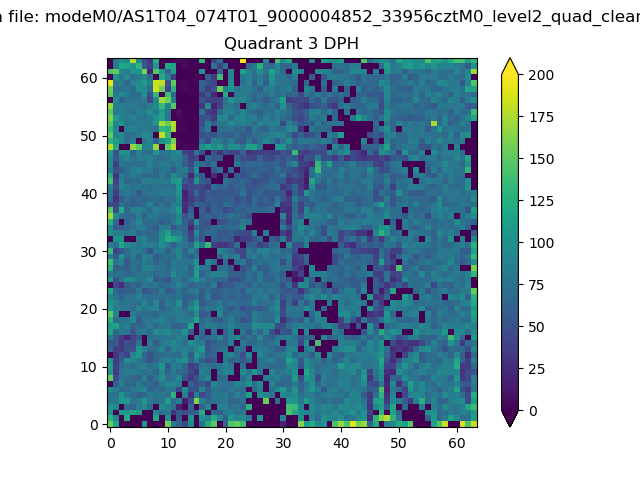 |
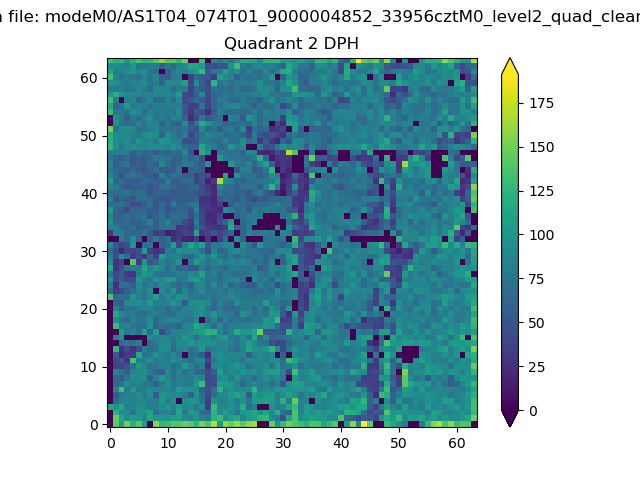 |
Quadrant C |
| Plot type | Count rate plots | Images |
|---|---|---|
| Comparison with Poisson distribution Blue bars denote a histogram of data divided into 1 sec bins. Red curve is a Poisson curve with rate = median count rate of data. |
 |
 |
| Quadrant-wise count rates Data is divided into 100 sec bins |
 |
|
| Module-wise count rates for Quadrant A Data is divided into 100 sec bins |
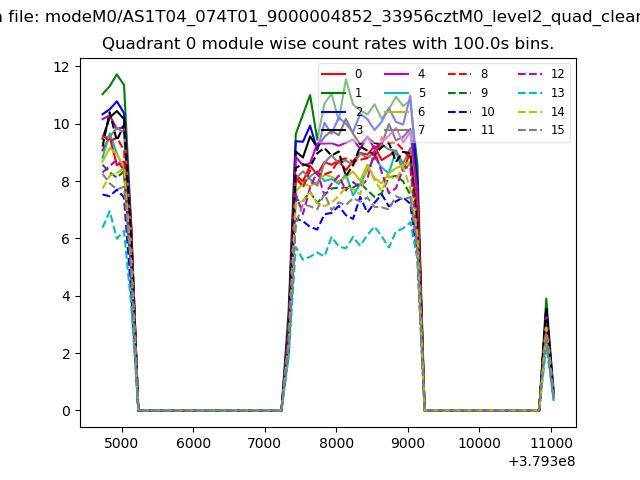 |
 |
| Module-wise count rates for Quadrant B Data is divided into 100 sec bins |
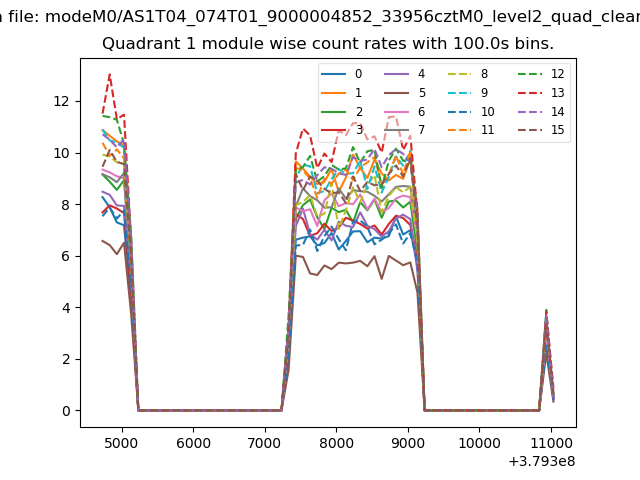 |
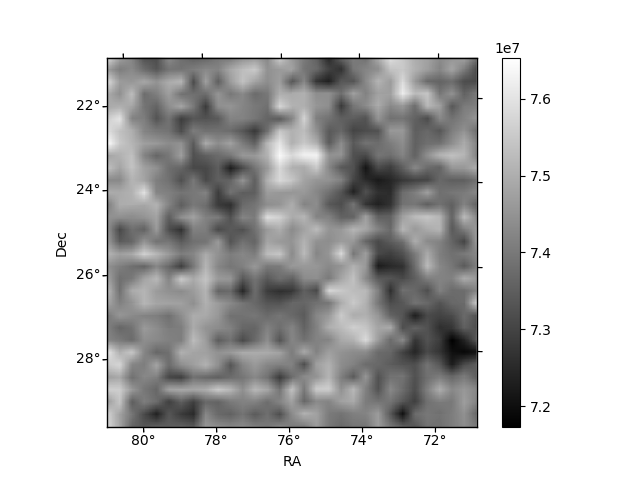 |
| Module-wise count rates for Quadrant C Data is divided into 100 sec bins |
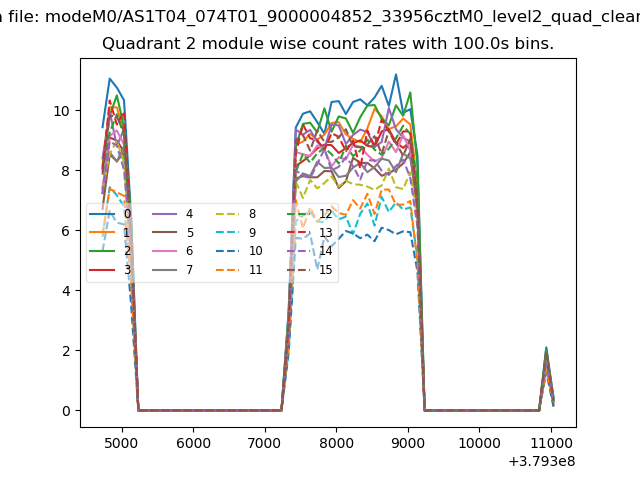 |
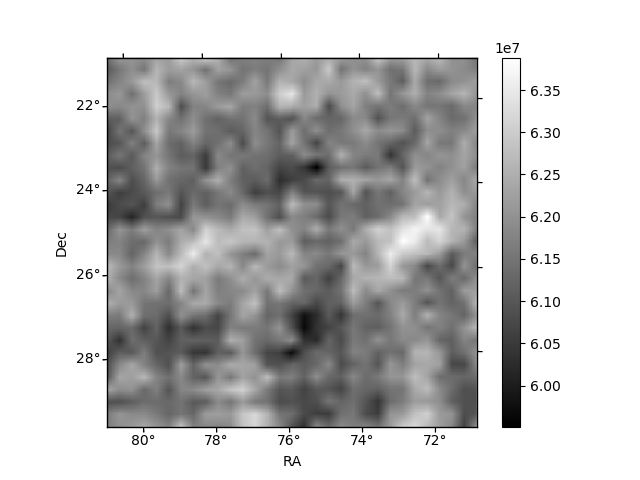 |
| Module-wise count rates for Quadrant D Data is divided into 100 sec bins |
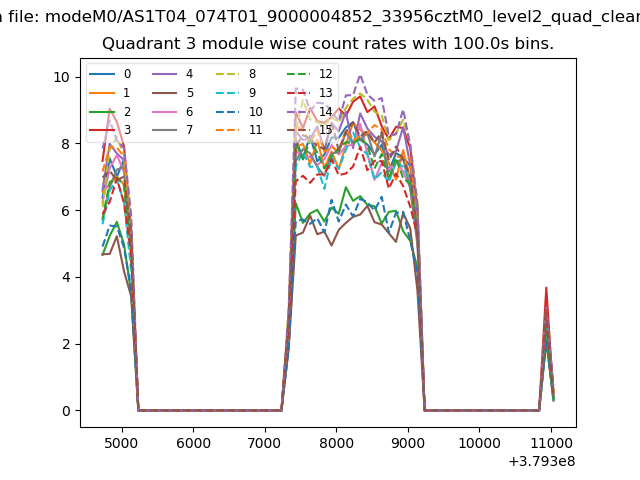 |
 |
| Parameter | Plot |
|---|---|
| CZT HV Monitor | 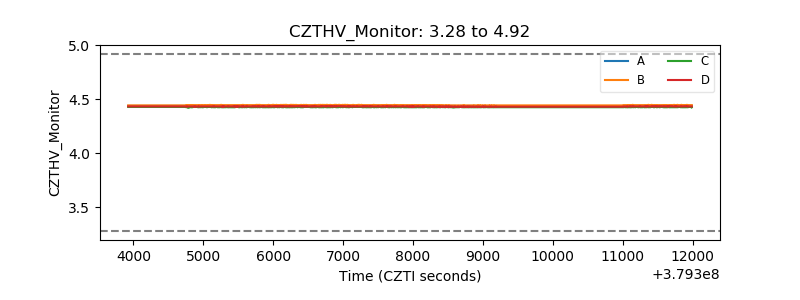 |
| D_VDD | 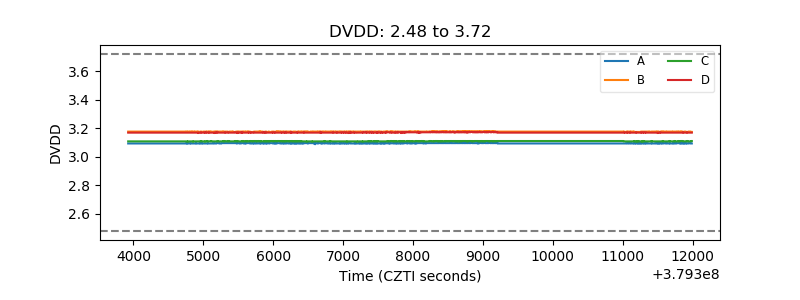 |
| Temperature 1 | 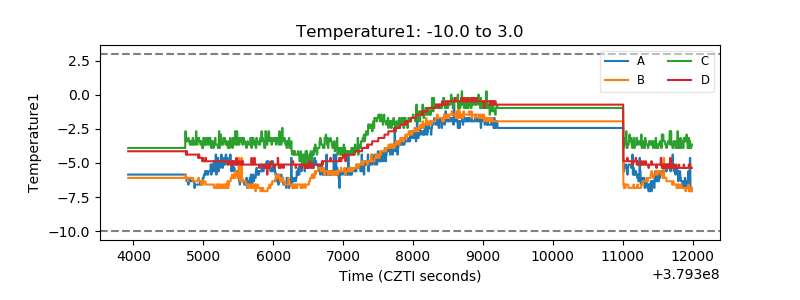 |
| Veto HV Monitor |  |
| Veto LLD | 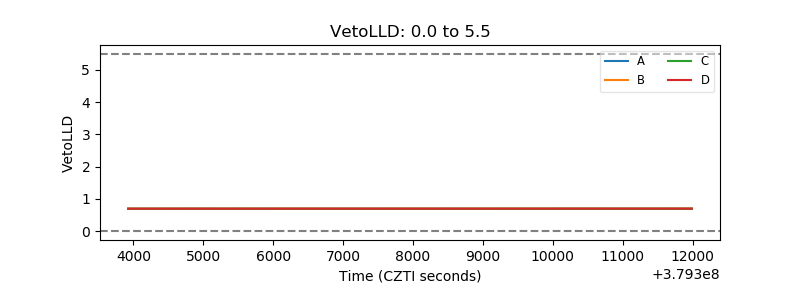 |
| Alpha Counter | 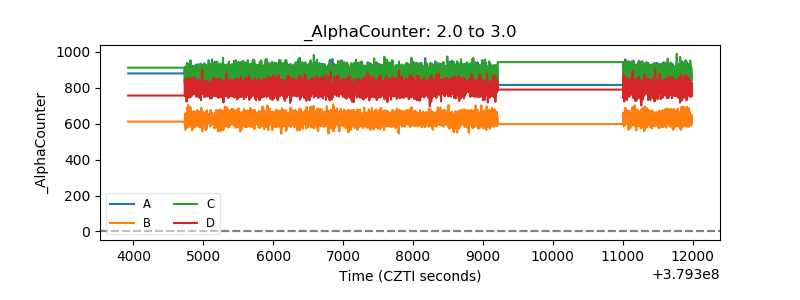 |
| _CPM_Rate |  |
| CZT Counter | 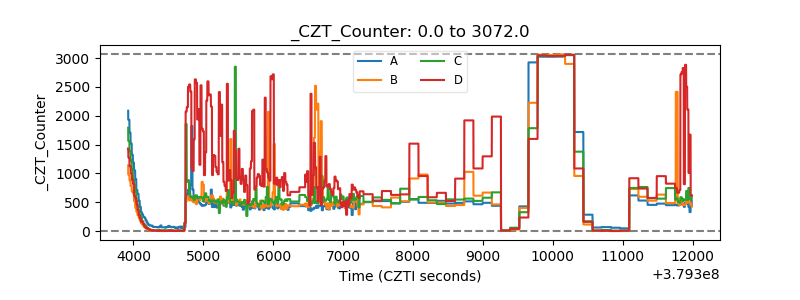 |
| +2.5 Volts monitor |  |
| +5 Volts monitor |  |
| _ROLL_ROT | 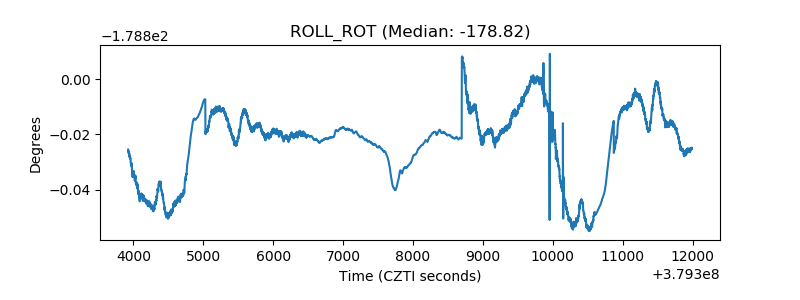 |
| _Roll_DEC | 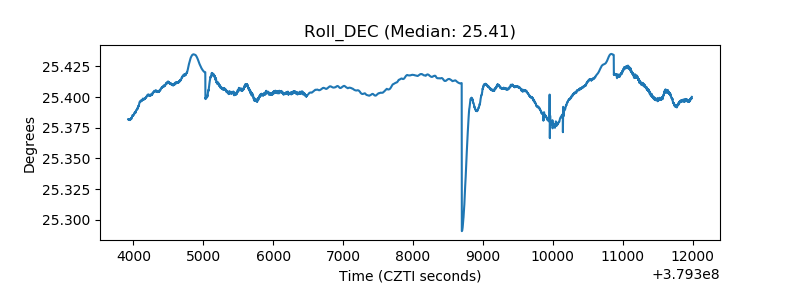 |
| _Roll_RA | 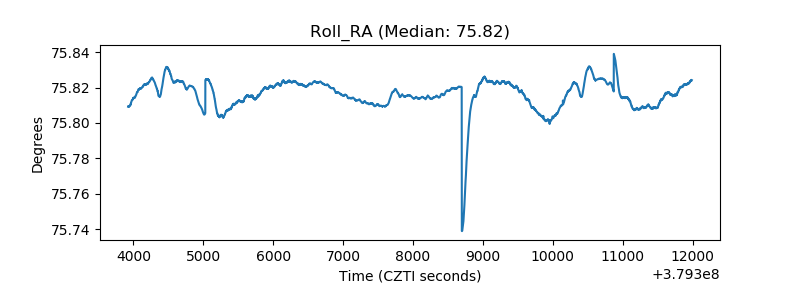 |
| Veto Counter | 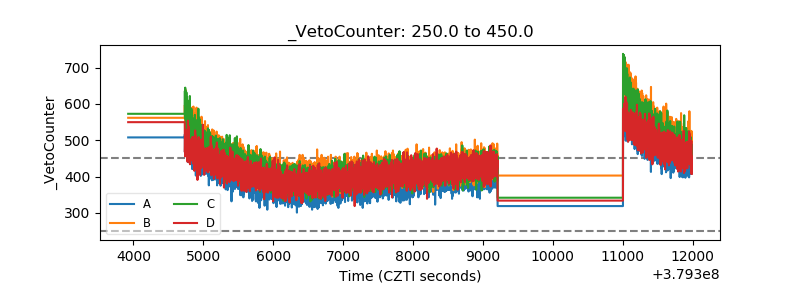 |