| Param | Original file | Final file |
|---|---|---|
| Filename | modeM0/AS1T04_074T01_9000004852_33957cztM0_level2.evt | modeM0/AS1T04_074T01_9000004852_33957cztM0_level2_quad_clean.evt |
| Size (bytes) | 371,859,840 | 39,867,840 |
| Size | 354.6 MB | 38.0 MB |
| Events in quadrant A | 1,935,749 | 243,296 |
| Events in quadrant B | 2,908,813 | 229,137 |
| Events in quadrant C | 2,471,673 | 238,393 |
| Events in quadrant D | 3,676,950 | 217,024 |
| Mode SS | |||
|---|---|---|---|
| Quadrant | BADHDUFLAG | Total packets | Discarded packets |
| A | 0 | 80 | 0 |
| B | 0 | 80 | 0 |
| C | 0 | 80 | 0 |
| D | 0 | 80 | 0 |
| Mode M9 | |||
|---|---|---|---|
| Quadrant | BADHDUFLAG | Total packets | Discarded packets |
| A | 0 | 7 | 0 |
| B | 0 | 7 | 0 |
| C | 0 | 7 | 0 |
| D | 0 | 8 | 0 |
| Mode M0 | |||
|---|---|---|---|
| Quadrant | BADHDUFLAG | Total packets | Discarded packets |
| A | 0 | 8011 | 1 |
| B | 0 | 11049 | 1 |
| C | 0 | 9649 | 1 |
| D | 0 | 13680 | 1 |
| Quadrant | Total seconds | Saturated seconds | Saturation percentage |
|---|---|---|---|
| A | 3947 | 4 | 0.101343% |
| B | 3947 | 296 | 7.499367% |
| C | 3947 | 46 | 1.165442% |
| D | 3947 | 281 | 7.119331% |
Noise dominated data is calculated using 1-second bins in cleaned event files. If a bin has >2000 counts, and if more than 50% of those come from <1% of pixels, then it is considered to be noise-dominated and hence unusable.
| Quadrant | # 1 sec bins | Bins with >0 counts | Bins with >2000 counts | High rate bins dominated by noise | Noise dominated (total time) | Noise dominated (detector-on time) | Marked lightcurve |
|---|---|---|---|---|---|---|---|
| A | 3947 | 3947 | 0 | 0 | 0.00% | 0.00% | 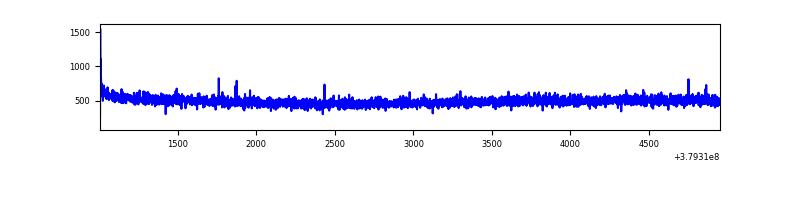 |
| B | 3947 | 3947 | 193 | 193 | 4.89% | 4.89% | 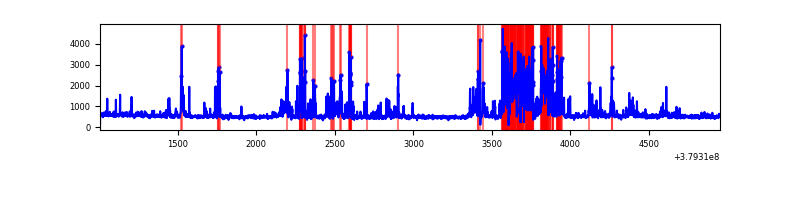 |
| C | 3947 | 3947 | 34 | 34 | 0.86% | 0.86% | 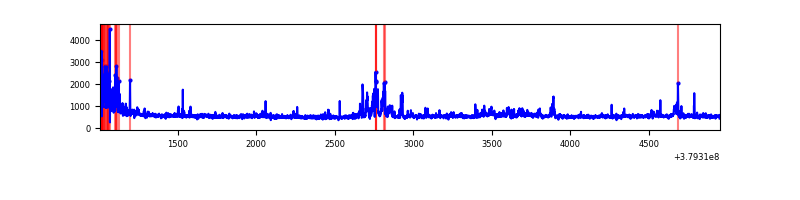 |
| D | 3947 | 3947 | 238 | 238 | 6.03% | 6.03% | 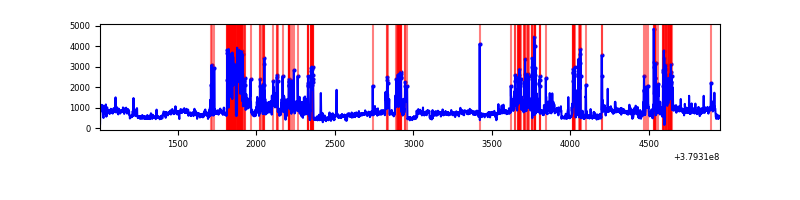 |
Top three noisy pixels from each quadrant. If the there are fewer than three noisy pixels in the level2.evt file, extra rows are filled as -1
| Pixel properties | Quadrant properties | ||||||
|---|---|---|---|---|---|---|---|
| Quadrant | DetID | PixID | Counts | Sigma | Mean | Median | Sigma |
| A | 13 | 6 | 8159 | 76.72 | 497 | 487 | 100.0 |
| A | 10 | 83 | 8008 | 75.21 | 497 | 487 | 100.0 |
| A | 13 | 254 | 7216 | 67.29 | 497 | 487 | 100.0 |
| B | 5 | 172 | 933958 | 10100.06 | 481 | 468 | 92.4 |
| B | 0 | 229 | 25033 | 265.79 | 481 | 468 | 92.4 |
| B | 3 | 112 | 12350 | 128.56 | 481 | 468 | 92.4 |
| C | 3 | 233 | 265214 | 2401.0 | 476 | 482 | 110.3 |
| C | 15 | 214 | 168571 | 1524.49 | 476 | 482 | 110.3 |
| C | 0 | 10 | 151480 | 1369.48 | 476 | 482 | 110.3 |
| D | 8 | 195 | 827653 | 7295.13 | 459 | 447 | 113.4 |
| D | 8 | 230 | 564233 | 4972.03 | 459 | 447 | 113.4 |
| D | 7 | 238 | 179070 | 1575.28 | 459 | 447 | 113.4 |
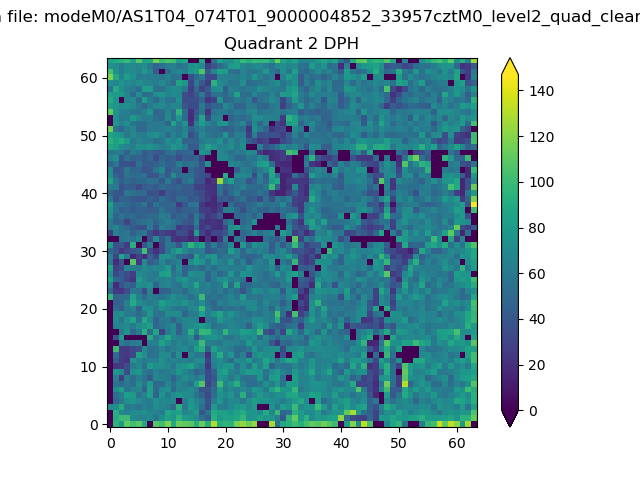
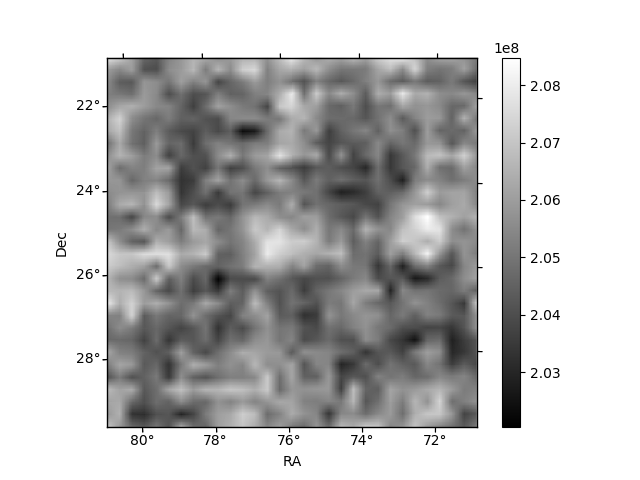
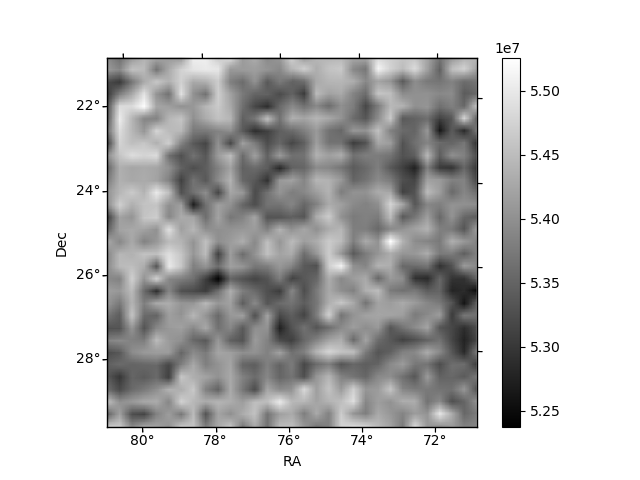
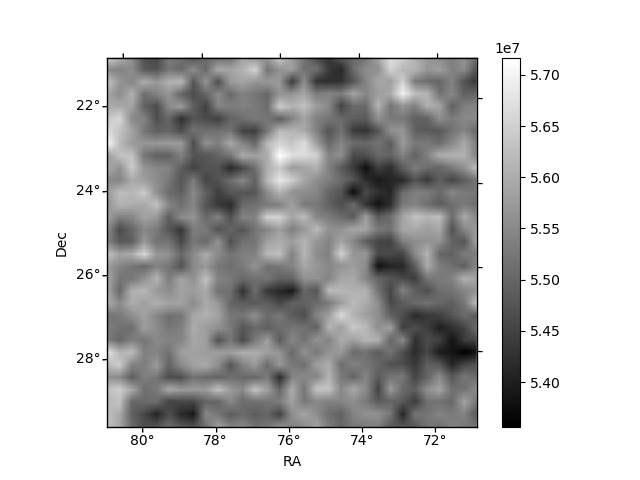
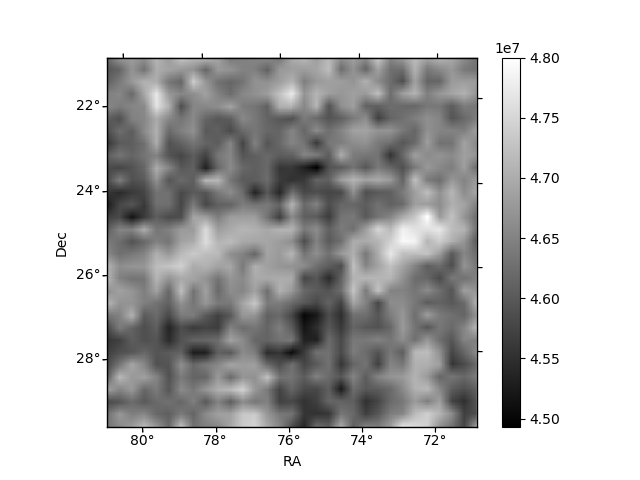
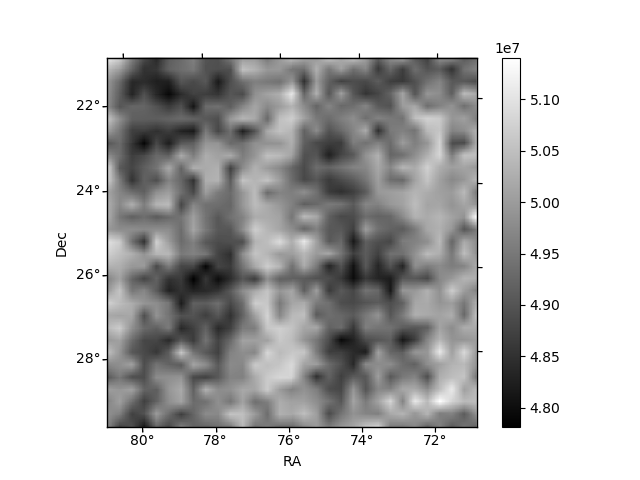
Histogram calculated using DETX and DETY for each event in the final _common_clean file
| Quadrant A | 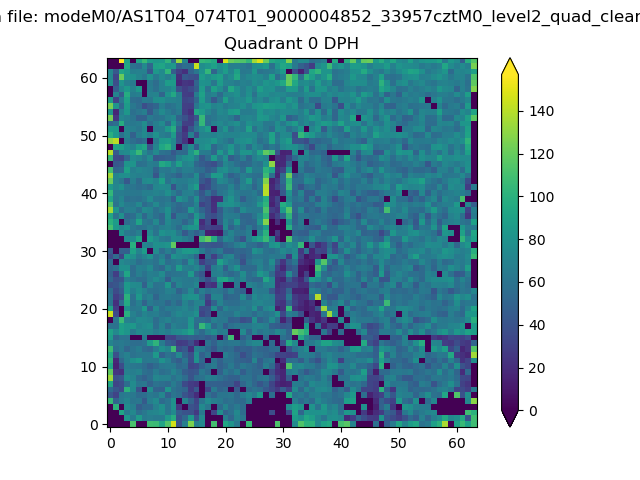 |
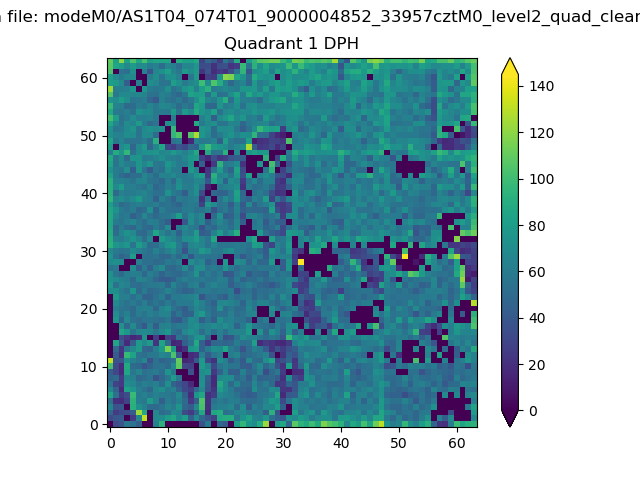 |
Quadrant B |
|---|---|---|---|
| Quadrant D | 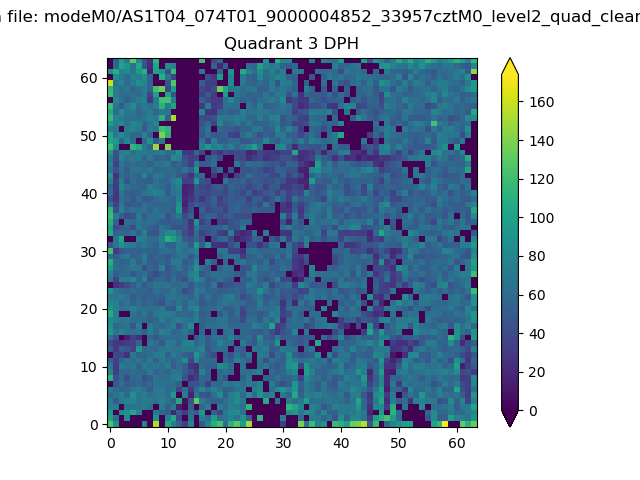 |
 |
Quadrant C |
| Plot type | Count rate plots | Images |
|---|---|---|
| Comparison with Poisson distribution Blue bars denote a histogram of data divided into 1 sec bins. Red curve is a Poisson curve with rate = median count rate of data. |
 |
 |
| Quadrant-wise count rates Data is divided into 100 sec bins |
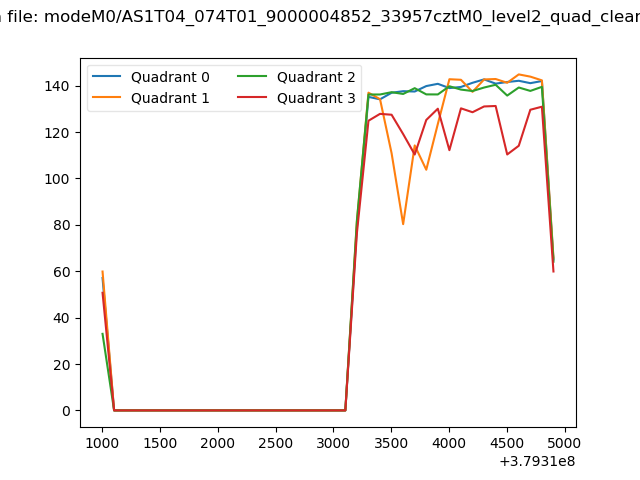 |
|
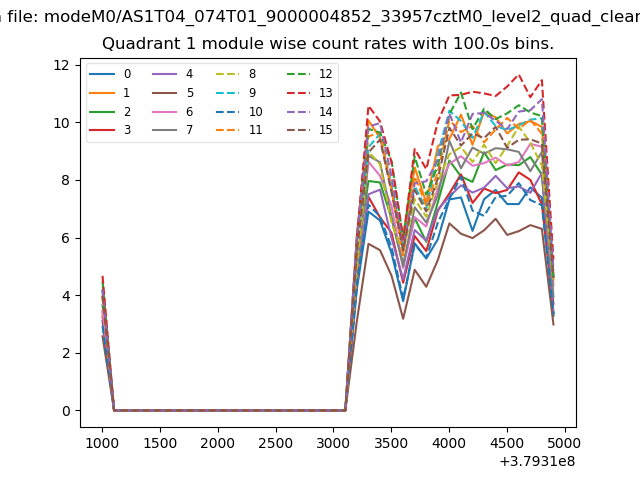
| Module-wise count rates for Quadrant A Data is divided into 100 sec bins |
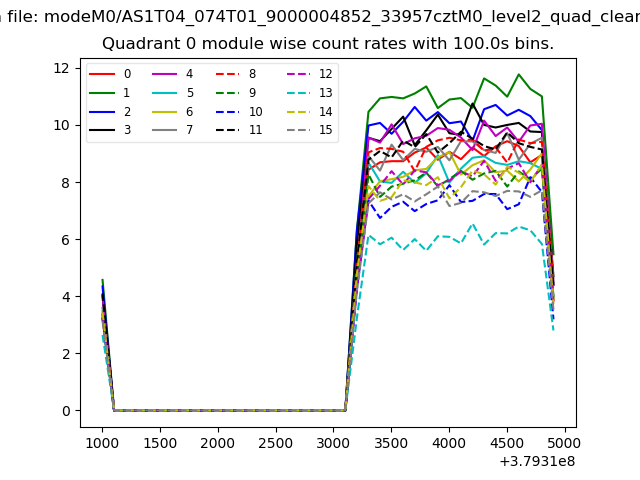 |
 |
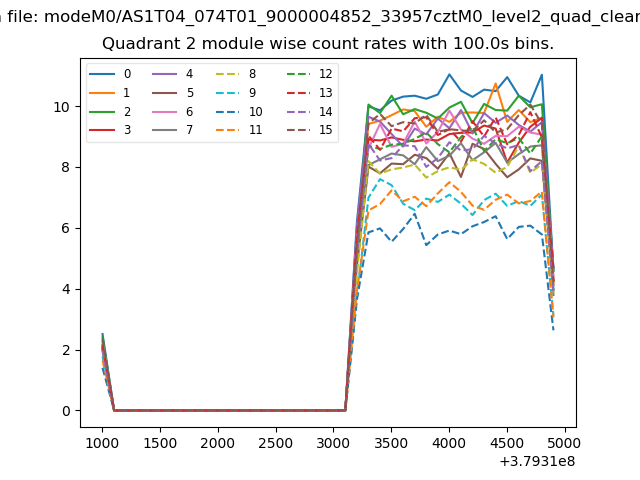
| Module-wise count rates for Quadrant B Data is divided into 100 sec bins |
 |
 |
| Module-wise count rates for Quadrant C Data is divided into 100 sec bins |
 |
 |
| Module-wise count rates for Quadrant D Data is divided into 100 sec bins |
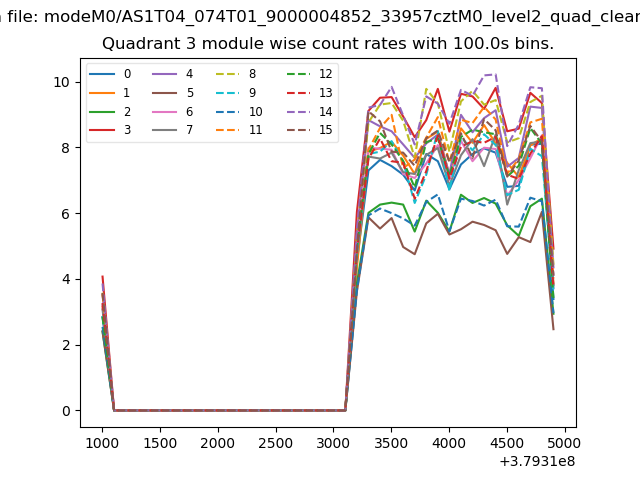 |
 |
| Parameter | Plot |
|---|---|
| CZT HV Monitor | 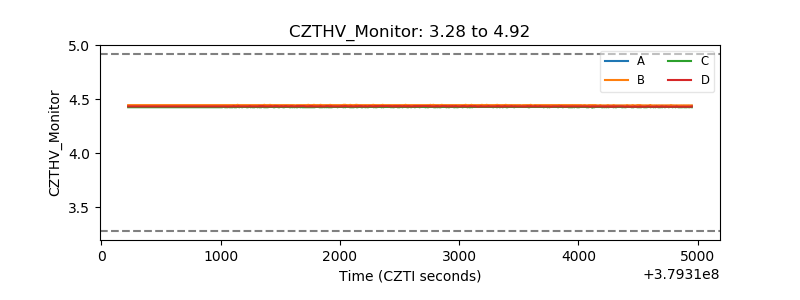 |
| D_VDD | 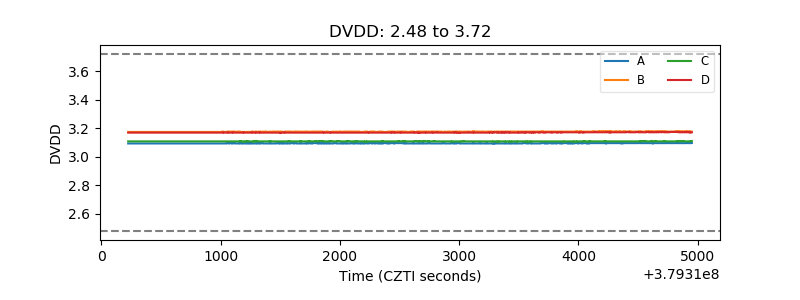 |
| Temperature 1 | 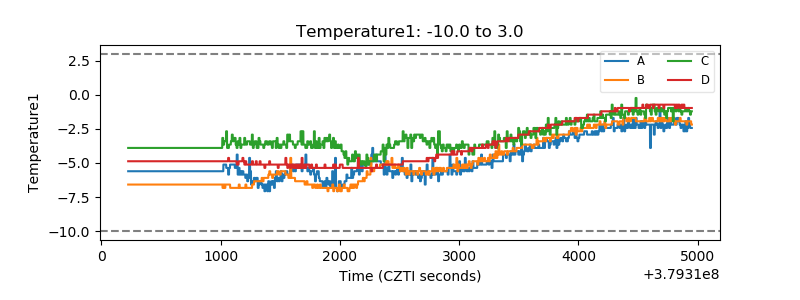 |
| Veto HV Monitor | 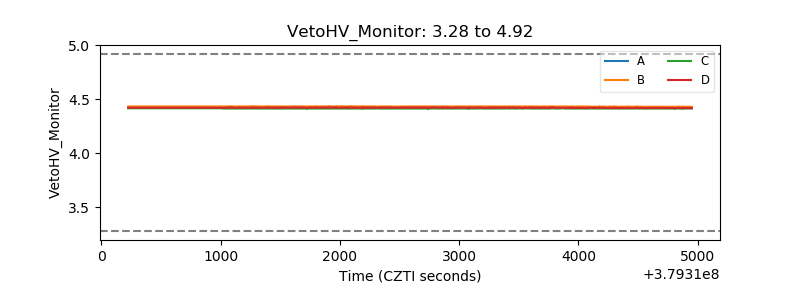 |
| Veto LLD | 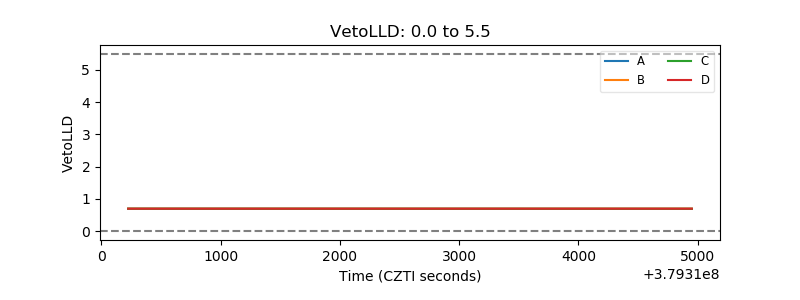 |
| Alpha Counter |  |
| _CPM_Rate | 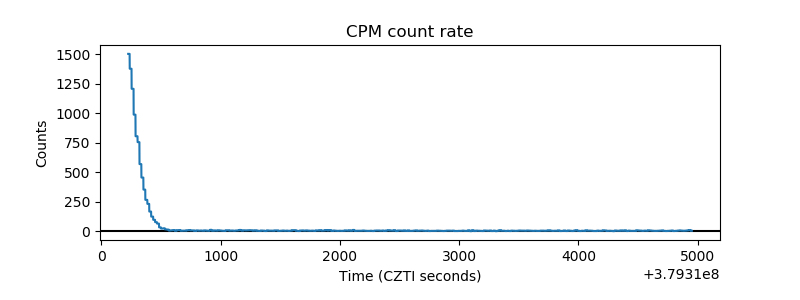 |
| CZT Counter |  |
| +2.5 Volts monitor |  |
| +5 Volts monitor |  |
| _ROLL_ROT | 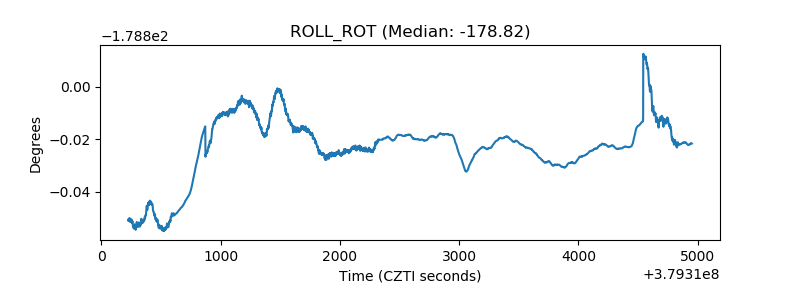 |
| _Roll_DEC | 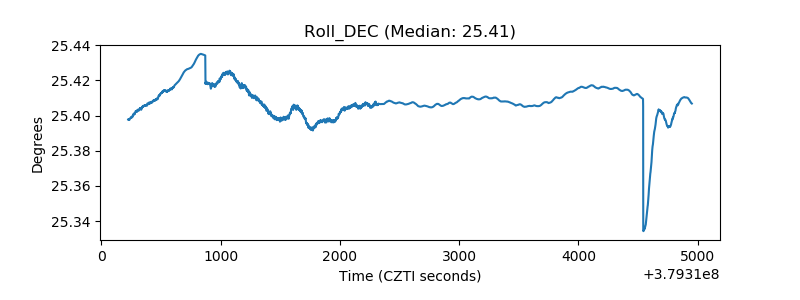 |
| _Roll_RA |  |
| Veto Counter | 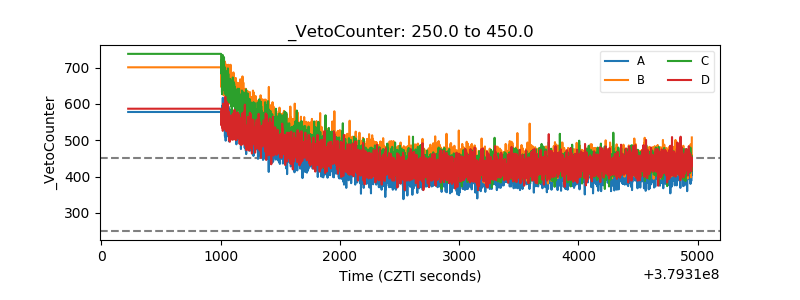 |